References
Supramolecular polymers form tactoids through liquid–liquid phase separation
Hailin Fu, Jingyi Huang, Joost J. B. van der Tol, Lu Su, Yuyang Wang, Swayandipta Dey, Peter Zijlstra, George Fytas, Ghislaine Vantomme, Patricia Y. W. Dankers & E. W. Meijer
Nature volume 626, pages 1011–1018 (2024)
Published:
Abstract
Liquid–liquid phase separation (LLPS) of biopolymers has recently been shown to play a central role in the formation of membraneless organelles with a multitude of biological functions. The interplay between LLPS and macromolecular condensation is part of continuing studies. Synthetic supramolecular polymers are the non-covalent equivalent of macromolecules but they are not reported to undergo LLPS yet. Here we show that continuously growing fibrils, obtained from supramolecular polymerizations of synthetic components, are responsible for phase separation into highly anisotropic aqueous liquid droplets (tactoids) by means of an entropy-driven pathway. The crowding environment, regulated by dextran concentration, affects not only the kinetics of supramolecular polymerizations but also the properties of LLPS, including phase-separation kinetics, morphology, internal order, fluidity and mechanical properties of the final tactoids. In addition, substrate–liquid and liquid–liquid interfaces proved capable of accelerating LLPS of supramolecular polymers, allowing the generation of a myriad of three-dimensional-ordered structures, including highly ordered arrays of micrometre-long tactoids at surfaces. The generality and many possibilities of supramolecular polymerizations to control emerging morphologies are demonstrated with several supramolecular polymers, opening up a new field of matter ranging from highly structured aqueous solutions by means of stabilized LLPS to nanoscopic soft matter.
Main
Supramolecular polymers are known to form homogeneous solutions and gels under dilute and concentrated conditions, respectively, or precipitate if they are not sufficiently soluble in the solvent used. By contrast, macromolecules can also undergo liquid–liquid phase separation (LLPS) and form inhomogeneous solutions with spherical droplets. Condensations of biomacromolecules can lead to LLPS; however, the formation of droplets can also cause further condensations or aggregations of biomacromolecules. Although there are reports of LLPS of small organic molecules preceding the formation of supramolecular polymers or crystals, synthetic supramolecular polymers undergoing LLPS has not been reported yet. This is even more surprising given the similarities of supramolecular polymers to biological fibrils and their enormous potential for biomedical applications, either as solid materials or as drug-assembled nanostructures and biofunctional hydrogels. Biofilaments such as actin, amyloid fibrils, microtubules, collagen and nanocellulose can form structured liquids or liquid crystals in vitro. According to Onsager’s theory, phase separation and spontaneous ordering of rod-like colloids are largely driven by maximization of the translational entropy at high concentrations. This theory is beautifully adopted in the liquid crystal field to explain the internal ordering of liquid crystalline phases. Macromolecular crowders have been reported to be promotional in the phase separation of colloids and proteins and in the formation of coacervates and biomolecular condensates through volume exclusion effect. Recently it has also been shown that macromolecular crowders could influence the supramolecular polymerization process.
By studying the supramolecular polymerization of 1 wt% of ureidopyrimidinone glycine (UPy-Gly) in an aqueous solution, with a small fraction of the dye UPy-Cy5 (less than 0.1 mol%), we observed the overnight transition from a homogeneous solution to a heterogeneous LLPS solution with confocal laser scanning microscopy (CLSM) (Fig. 1a–c and Extended Data Fig. 1). This coexistence of concentrated and diluted liquid regions in the aqueous solution reminded us of macromolecular solutions undergoing LLPS. Even more striking was that the shape of the droplets was not spherical but spindle-like, reminiscent of the tactoids formed by biofilaments. Inspired by the crowding effect, we introduced dextran as a macromolecular crowder into the UPy-Gly solution to tune both the supramolecular polymerization and phase-separation behaviour (Fig. 1e). The coupling of supramolecular polymerization and phase separation eventually led to dynamic, highly ordered, three-dimensional (3D) structures up to millimetre or even centimetre scale (Fig. 4 and Extended Data Fig. 6).

a. Chemical structures of UPy-Gly, UPy-Cy5 and dextran (MW ≈ 500 kDa), and schematic representations of UPy-Gly and its supramolecular polymer.
b. Schemes for the spontaneous phase separation of UPy-Gly supramolecular polymers into tactoids over time with the association and elongation of supramolecular polymer rods.
c. The transition from homogeneous solution to liquid–liquid phase-separated solution followed by the growth of tactoids over time tracked by CLSM. The UPy-Gly (1 wt%, 8.4 mM) supramolecular polymers were labelled with 0.02 mol% of UPy-Cy5, PBS × 0.25, pH = 7.6.
d. The length distributions of fibrils tracked by AFM show fibril growth and more heterogeneous populations over time.
e. LLPS of UPy-Gly supramolecular polymers (top, labelled by UPy-Cy5) could be promoted by the volume exclusion effect of dextran (1.5 wt%, middle, labelled by 0.08 mol% of dextran-FITC). The bottom graph shows the partitioning of UPy-Gly and dextran in the two phases. Scale bars, 20 μm (e), 50 μm (c).
Driving forces for LLPS
We observed the tactoids by coincidence while studying a diluted solution of water-soluble supramolecular polymers that are a few days old. Previous studies showed that UPy dimerization and stacking of the units result in the formation of isolated, semirigid supramolecular polymers immediately after preparing the solution, as observed by cryogenic transmission electron microscopy (cryoTEM). This early observation of tactoids started a detailed study on the phase behaviour of these one-dimensional polymers. The change in structure and morphology over time of fresh solutions of UPy-Gly (1 wt%, pH = 7.6 ± 0.2, phosphate-buffered saline (PBS) × 0.25 with 0.02 mol% of UPy-Cy5) were first studied by atomic force microscopy (AFM) and CLSM. We observe that fibrils are formed, which grow significantly longer over time before tactoids appear (from 0.5 ± 0.2 μm to 1.7 ± 1.1 μm in 8 h; Fig. 1d and Extended Data Fig. 2a). The hydrodynamic radius, Rh, obtained from dynamic light scattering (DLS) in the dilute fibril solution, increases with time. The Rh values along with the radius of gyration, Rg, conform to semirigid chains with a persistent length of the order of 100 nm (Extended Data Fig. 3c,e,f and Supplementary equation (14)). Even when LLPS occurs, the fibrils continue to grow (Fig. 1d and Extended Data Fig. 2). When we fragment the long fibrils in the aged, phase-separated solution into short fibrils (0.15 ± 0.05 μm) using dual asymmetric centrifugation, the solution becomes homogeneous again. In this case the phase separation reappears only 7 days later owing to the drastically reduced growth rate of aged fibrils (Supplementary Fig. 1). Thus, a critical length of supramolecular fibrils is required before macroscopic LLPS is observed.
To understand the origin of the tactoids formed by LLPS of supramolecular polymers, we analysed the chemical and geometrical properties of the UPy–Gly polymers, as the free energy change during LLPS is controlled not only by the solvent–solute interactions, but also by the size and shape of the solutes. The partially exposed hydrophobic groups and the amphiphilic nature of the end groups allow continuous elongation and relatively weak parallel association of the UPy-Gly polymers (Fig. 1a). At the same time, the negative zeta potential exerted by the ureidopyrimidinone functional group is modulated by pH and salt concentration to partially counteract these associative interactions (Supplementary Fig. 4). Geometrically speaking, the supramolecular polymers are rod-like, and their size and aspect ratio increase with time owing to the longitudinal supramolecular polymerizations. This suggests that the UPy–Gly polymers have weak repulsive interactions with water and the elongation of fibrils causes the transition of the solution from a stable to a metastable state, in which phase separation occurs by means of the nucleation-growth pathway instead of spinodal decomposition (Extended Data Figs. 1 and 4; for more discussions, see Supplementary Information). The spontaneous ordering within the tactoids should be a result of maximized translational entropy at the cost of rotational entropy of the high-aspect-ratio fibrils according to Onsager’s theory26. A study on the temperature effect shows that the phase separation is faster and results in smaller tactoids at higher temperature, suggesting that LLPS behaviour is entropically favourable (Supplementary Figs. 15 and 16).
Crowding effect on LLPS
As the concentration of UPy-Gly is rather low (1 wt%), we introduced dextran (MW ≈ 500 kDa) as the macromolecular crowder into the UPy–Gly solution to accelerate the phase-separation process. Adding crowders leads to the synergistic acceleration of the fibril elongation, as well as to the formation of tactoids (Extended Data Figs. 2 and 3). Our initial focus was on the morphology of tactoids. We used UPy-Cy5 or Nile red to follow the process: Nile red would colour the hydrophobic domains and UPy-Cy5 is co-assembled into the fibrils. By increasing the concentration of dextran, the LLPS process becomes faster, and the tactoids formed are smaller in size, thinner in shape and, as a result, more dense and rigid (Fig. 2a). Quantification of the aspect ratio as a function of the dextran concentration (0–1.5 wt%) results in a bell-shaped curve that reaches a maximum at approximately 0.9 wt% of dextran (Fig. 2b). At 3 wt% of dextran and above, the tactoids look more like long filaments/bundles (for discussions, see Supplementary Information). Notably, aspect ratios of tactoids at 0.75–1.5 wt% of dextran increased by 30–70% from time t = 19 ± 1 h to 50 ± 2 h. For tactoids formed by amyloid fibrils, by contrast, the aspect ratio was reported to decrease over time because of the increasing volume of droplets. In the meantime, the aspect ratio was increased when the initial amyloid fibril length was longer. Therefore, we propose that the increase in the aspect ratio of UPy-Gly tactoids over time, despite the increase of volume, can be attributed to the further elongation of fibrils as the result of supramolecular polymerizations. AFM experiments showed that the fibrils grew in length by five to ten times in 3 days and that the fibrils with 0.5 wt% of dextran were 30–70% longer than those without dextran (Extended Data Fig. 2). The hypothesis is further supported by the increase of R g and R h , extracted from static light scattering (SLS) and DLS, in the beginning, and the decrease of fibril self-diffusion constant,
Fig. 2: Controlling the LLPS of UPy-Gly supramolecular polymers with dextran concentration.
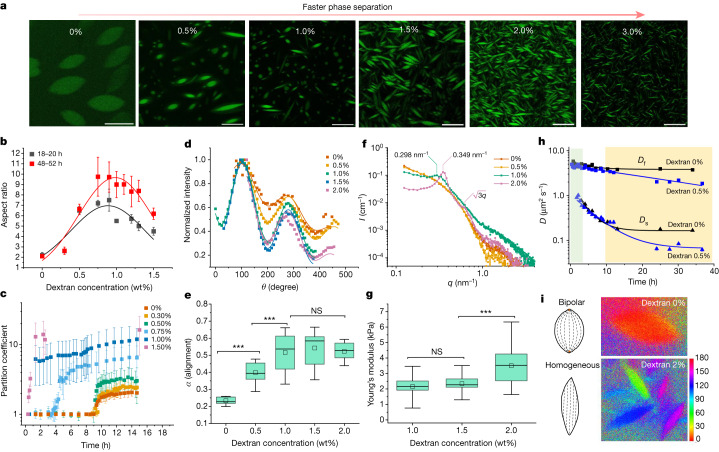
a. Variations in the morphology and the number density of tactoids as a function of dextran concentration. The UPy-Gly (1 wt%, 8.4 mM) supramolecular polymers were labelled with UPy-Cy5.
b. Change in the long axis to short axis ratio (aspect ratio) as a function of dextran concentration and time (n = 3–19).
c. Change in the phase separation states and kinetics as a function of dextran concentration (n = 6–26) tracked by the fluorescence intensity of UPy-Cy5 using CLSM.
d. Plot of the normalized fluorescence intensities as a function of the angle of the polarized excited beam for 2-day-old solutions with different dextran concentrations. Solid lines are the fits to the data as explained in the Supplementary Information.
e. Plot of the fibril alignment factors for 2-day-old solutions with different dextran concentrations (n = 12–18). The UPy-Gly (1 wt%, 8.4 mM) supramolecular polymers were labelled with 1.8 μM of UPy-Cy5 (0.02 mol% of UPy–Gly).
By tracking the concentration ratios of UPy-Cy5 inside and outside the droplets (the partition coefficient), we could follow the phase-separation process in real time (Fig. 2c). The incubation period was significantly shortened with increased dextran concentrations, which is likely to be the result of faster supramolecular polymerizations, shorter critical fibril length and/or accelerated nucleation of LLPS. The elevated plateaus of the concentration ratios suggest stronger phase separations with more crowders. The transition to the phase-separated state can also be detected by the slow diffusion of tactoids in the dilute phase, Dus , using DLS (Supplementary Fig. 9). In conclusion, increasing crowder concentration accelerates phase separation; this separation increases the concentration of supramolecular polymers in the concentrated phases, which in turn promotes fibril elongation, a kind of autocatalytic effect. This conclusion also makes the question as to whether LLPS induces protein associations and/or whether associative interactions between biomacromolecules are required for LLPS less relevant,as both occur at the same time.
To understand and quantify the internal order of the tactoids, we conducted polarized fluorescence microscopy experiments. The fluorescence intensities of the tactoids were shown to be strongly dependent on the angle of the linearly polarized excitation beam with a period of 180°, which is typical of axially aligned fibrils (Fig. 2d and Supplementary Fig. 8). In the normalized intensity plot, the amplitude of the sinusoidal curves increases with the dextran concentration (Fig. 2d). The extent of alignment obtained by fitting the sinusoidal curves demonstrates that the fibrils are better aligned with the increase of dextran concentrations in a narrow range (Fig. 2e and Supplementary Fig. 8), in full agreement with the increased aspect ratio of the tactoids. To cross-check, we also used small-angle X-ray scattering (SAXS) to characterize the UPy-Gly solution. It showed the regular packing and enhanced order of individual fibrils with sharp peaks and increased peak intensities at higher dextran concentrations. The drifted peak position from 0.30 nm−1 to 0.35 nm−1 corresponds to an interfibril distance change from 21 nm to 18 nm, confirming more compact packing at a higher dextran concentration (Fig. 2f). This finding implies an increased internal viscosity, as also inferred from Ds in Fig. 2h. The peak near 0.62 nm−1 indicates hexagonal packing of the fibrils. The in situ AFM force measurements of the 8-day-old samples showed that the Young’s modulus of tactoids increased with the dextran concentration from 2.2 ± 0.8 kPa (1 wt% of dextran) to 3.5 ± 1.3 kPa (2 wt% of dextran), which may be a result of the more compact distributions of fibrils (Fig. 2g and Supplementary Fig. 5). The instant molecular orientation microscopy based on a polarization-sensitive camera (POLCAM) showed the liquid crystalline state of the tactoids (Fig. 2i). At 0 wt% of dextran, the tactoids are bipolar, whereby fibrils on the edge are tangentially anchored. In the presence of dextran (0.5–2 wt%), most tactoids transition to the more ordered ‘homogeneous’ configuration in which most fibrils are aligned with the long axis of the tactoids (Figs. 2i and 3f and Supplementary Fig. 10).
Fig. 3: Time evolution of the fluidity and internal ordering of the tactoids and geometry change of supramolecular polymers. 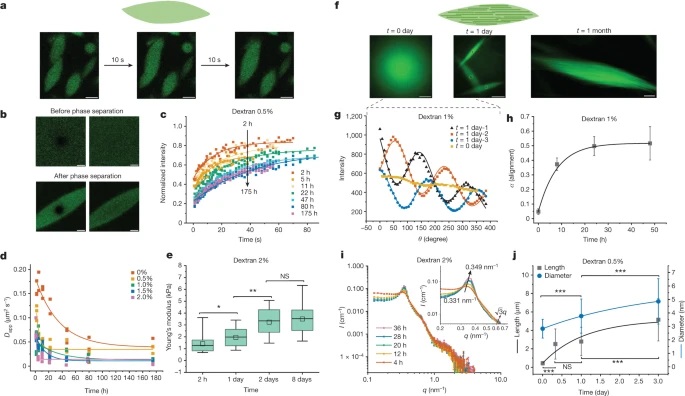
a. Spontaneous fusion of two tactoids in 20 s. The images were taken for the solution with 1 wt% (8.4 mM) of UPy-Gly, 2 wt% (0.04 mM) of dextran and 1.8 μM of UPy-Cy5, at pH = 7.6, PBS × 0.25 at t = 1 h. This is the default solution condition if not otherwise specified.
b. Typical images for the FRAP experiment representing that the solutions (0.5 wt% of dextran) before and after phase separation were bleached (left) and reached a high percentage of recovery afterwards (right).
c. The FRAP curves for the solution with 0.5 wt% of dextran at different ageing times.
d. Plot of the diffusion constants extracted from the recovery curves at different ageing times for solutions with different dextran concentrations (0 wt%, 0.5 wt%, 1 wt%, 1.5 wt% and 2 wt%).
e. The change of the Young’s modulus of the tactoids over time (2 wt% of dextran, two-sample t-tests were conducted, n = 10–14; the empty square in the box plot represents the mean).
f. Representative images of the solution (0 wt% of dextran, t = 0 day) or tactoids (1 wt% of dextran, t = 1 day and 1 month) at different times.
g. Representative curves of the fluorescence intensities in the circular areas of samples indicated in f at t = 0 and 1 day under linearly polarized excitation with polarization angle θ.
h. The time evolution of the extent of fibril alignment extracted from the polarized fluorescence microscopy curves in Fig. 3g and Supplementary Fig. 12 (1 wt% of dextran, n = 5–14).
i. SAXS profiles showing the regular distance between fibrils and more compact packing over time (2 wt% of dextran).
j. Diameters and lengths of UPy-Gly fibrils from the cryoTEM and AFM images showing the increase of fibril width and length over time (0.5 wt% of dextran) (n = 51–194). Scale bars, 5 µm (a), 10 µm (b,f). *P ≤ 0.1, **P < 0.05, ***P < 0.01.
Besides, the crowding effect can be achieved by other macromolecules. The negatively charged alginate also promotes LLPS of UPy-Gly supramolecular polymers. Tactoids with similar morphology are formed with even lower concentrations (less than 1 wt%) of alginate because the negative charge in alginate can increase its excluded volume through both intramolecular and intermolecular repulsive interactions (Supplementary Fig. 3).
To confirm the liquid nature of the tactoids formed by the phase-separated UPy-Gly supramolecular polymers, we examined the tactoids with CLSM and AFM using different amounts of dextran. The fresh tactoids, using 2 wt% of dextran, fused together in 20 s on contact, demonstrating the fluid nature of the tactoids (1 wt% or 8.4 mM of UPy-Gly, t = 1 h; Fig. 3a). High percentages of fluorescence recovery within 1 min after photobleaching (FRAP) of the UPy-Cy5 were observed but the percentages of recovery decreased over a few days (Fig. 3b,c). The apparent diffusion constants (Dapp, Fig. 3d and Supplementary Fig. 11) obtained by fitting the recovery curves, are on the same order as the self-diffusion constants of fibrils (Ds) obtained from DLS (Fig. 2h), indicating that the fluorescence recovery should have been realized by the diffusion of fibrils. Dapp showed exponential decay over time, the rate of which increases with the dextran concentration. This could be due to accelerated fibril elongation with more crowders and the increase of the internal viscosity of tactoids (Fig. 3d and Extended Data Fig. 3). The in situ AFM force curve measurements showed continuously increasing Young’s modulus in 2 days (from 1.4 ± 0.5 kPa to 3.2 ± 1.0 kPa, 2 wt% of dextran), which is comparable to the mechanical strength of the cytoplasm (Fig. 3e and Supplementary Fig. 5).
To understand the change in the internal order of the tactoids, we tracked the UPy-Gly solution containing 1 wt% of dextran over time. The fluorescence intensity of the UPy-Cy5 from the homogeneous solution was barely responsive to the angle of the linearly polarized excitation beam other than some slight decay due to photobleaching (Fig. 3f,g). However, on phase separation, the fluorescence from the tactoids started to depend on excitation polarization with a period of 180°, indicating increasing internal alignment (Fig. 3f,g). By fitting the sinusoidal curves, a ten-fold increase in the extent of alignment within the tactoids was shown over 2 days (Fig. 3h and Supplementary Fig. 12).
To investigate the origin of changes in the liquid state and the internal order of the tactoids, we zoomed in on the individual fibrils. With cryoTEM and AFM, we observed that the fibrils became both thicker (from 2.8 ± 0.7 nm to 4.9 ± 1.7 nm, 0.5 wt% of dextran) and longer (from 0.4 ± 0.2 µm to 5.2 ± 2.3 µm, 0.5 wt% of dextran) in 3 days, revealing continuous supramolecular polymerizations coupled with LLPS (Fig. 3j, Extended Data Fig. 2 and Supplementary Fig. 2). An extreme case of the extended, bundled structures can be observed in the 1-month-old tactoids with CLSM (1 wt% of dextran; Fig. 3f and Supplementary Fig. 13). The increase in peak intensities and change in peak positions (from 0.33 nm−1 to 0.35 nm−1) shown by SAXS further consolidated the formation of more regularly and compactly distributed fibrils over time (2 wt% of dextran; Fig. 3i). The change in fibril dimensions and the interfibril spacing within the tactoids could explain the decreased diffusion rate and more rigid nature over time. The improved alignment could be attributed to the entropic effect after the elongation of fibrils.
LLPS of UPy-Gly supramolecular polymers at the substrate–liquid interface occurred several minutes to several hours/days earlier (in a narrowly confined space) than in the bulk solution containing a dextran concentration of 0.5 wt% or lower. This is consistent with the report that the substrate can nucleate new liquid phases or states. With 1.5 wt% or higher concentrations of dextran, the nucleation effect of the interface was less pronounced, and the phase separation happened almost simultaneously at the substrate–liquid interface and in the solution. More strikingly, highly ordered arrays of vertical tactoids were obtained at the substrate–liquid interface, compared with the less oriented tactoids in the solution (0.5–2.0 wt% of dextran; Fig. 4, Extended Data Fig. 5 and Supplementary Video 1). Large areas (millimetre to centimetre in diameter) of the substrate were found to be covered with vertical tactoids that look circular on the x–y plane (0.5 wt% of dextran; Extended Data Fig. 6). The tactoids rooting on the substrates could slowly tilt/diffuse and merge with their neighbours, generating larger tactoids. The height of the tactoids was found to increase almost linearly in 14 days (0.5 wt% of dextran; Figs. 3d and 4b). On the other hand, real-time tracking of areas, tens of micrometres above the substrate, revealed that some flat tactoids in the solution were able to slowly flip and quickly merge with one or several vertical tactoids, increasing the overall order in the z direction of the bulk solution (1 wt% of dextran; Supplementary Video 2 and Extended Data Fig. 7). Note that the fusion of tactoids is fast in the beginning and gradually slows down during ageing, which can give rise to trapped fusion states in transition (Supplementary Fig. 19). When the solution was confined between two substrates, two layers of vertical tactoids could be formed, both nucleated from their own surfaces (0.5 wt% of dextran; Fig. 4b and Extended Data Fig. 8). Moreover, the density of the tactoids seemed to increase with dextran concentration. At relatively low concentrations of dextran (less than or equal to 1 wt%), the tactoids generated from the solution were able to float, generating multilayered structures (Supplementary Video 1 and Extended Data Fig. 5b). At higher concentrations of dextran (1.5–2.0 wt%), the tactoids formed in the bulk solution would sink to the bottom because of gravity, leaving an almost perfectly aligned top layer, an empty middle layer and a less ordered bottom layer mixed with vertical tactoids and flat ones falling from the bulk solution (Fig. 4a, Supplementary Fig. 14 and Extended Data Fig. 5c,d). Several reasons can be given for the vertical alignment of tactoids on the substrates, including the nucleation of the metastable solution at the substrate–liquid interface overruling fibril–substrate interactions and sample flow while mounting the glass substrate.
Fig. 4: Interface directed vertical alignment of tactoids.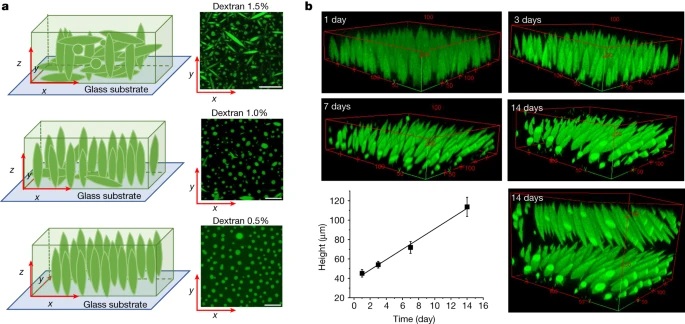
a. The 3D distribution of tactoids at the water–glass substrate interface as a function of dextran concentration. Left, 3D schematic representations. Right, cross-section images (t = 14–19 h).
The effect of liquid–liquid interfaces
Because biopolymer fibrils stabilize droplets in cells, it can be intuitively assumed that the accelerated LLPS, presented above, could also be extended to these liquid–liquid interfaces to preferentially form these ordered structures around droplets49. To test this idea, we constructed the liquid–liquid interface with the well-known polyethylene glycol (PEG)–dextran aqueous two-phase system, where dextran droplets can be generated in the continuous phase of PEG (Supplementary Fig. 20)50,51. On mixing the supramolecular polymers of UPy-Gly with the PEG–dextran solution, the fibrils partitioned preferentially to the PEG phase as it is chemically more like PEG (Fig. 5a and Extended Data Fig. 10b). When the dextran droplets are removed by centrifugation, the supramolecular polymers phase-separate into tactoids (Supplementary Fig. 23). In the presence of dextran droplets, crown-shaped UPy-Gly supramolecular polymer condensates (tactoids distorted by the circular interface) are first initiated at the droplet interface, precedent to LLPS in the bulk solution of the PEG-rich phase (Fig. 5a and Supplementary Video 3). Subsequently, gradually aligned bundles formed within the supramolecular polymer condensates, eventually generating a network that stabilized the droplets (Fig. 5a,b). pH and salt concentrations can change the bundling state of UPy-Gly supramolecular polymers and the morphology of tactoids probably because of their influence on the zeta potential of the supramolecular polymers (Supplementary Figs. 1, 17, 18, 21 and 22). As a result, they can also influence the supramolecular polymer networks. By varying pH and salt concentrations, continuous or discrete supramolecular polymer networks could be generated that can either support or deform the dextran droplets (Fig. 5b; for more discussions, see Supplementary Information).
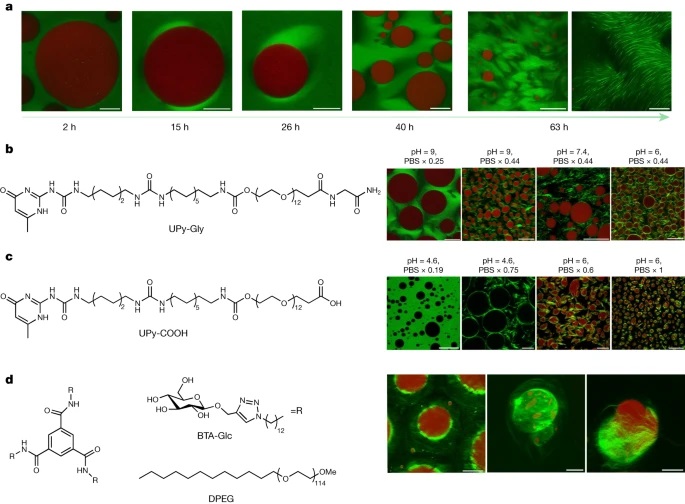
a. The LLPS of UPy-Gly supramolecular polymers was accelerated at the PEG–dextran interface. Solution composition: 1 wt% (8.4 mM) of UPy–Gly, 5 wt% of dextran and 5 wt% of PEG; pH = 9, PBS × 0.19. Red: dextran-FITC, green: Nile red or UPy–Cy5.
b. and c. Stabilization and deformation of the dextran droplets (red or dark) after the phase separation and ageing of the UPy-Gly (b) and UPy-COOH (c) supramolecular polymers under different pH and PBS concentrations, t = 1 day.
d. Stabilization of the dextran droplets after the phase separation and ageing of the BTA-Glc supramolecular polymers. The hairy ball-like BTA-Glc cage (Nile red, green) could encapsulate the dextran droplets inside and release the droplets under pressure. Solution composition: 0.22 wt% (1.5 mM) of BTA-Glc, 0.18 wt% (0.34 mM) of DPEG, 8 wt% of PEG and 2 wt% of dextran, t = 3 or 4 days. All experiments have been replicated at least two to three times. Scale bars, (left to right) 50, 10, 10, 50, 200 and 50 µm (a), 50, 20, 50 and 20 µm (b), 50, 20, 20 and 50 µm (c), 50, 20 and 20 µm (d).
According to the Flory–Huggins theory, LLPS should be a general phenomenon for different supramolecular polymer systems given appropriate solvent conditions, concentrations and chain length. To verify this hypothesis, we tested UPy-COOH and benzene-1,3,5-tricarboxamide (BTA)-EG4 in the aqueous solution and found that both could form into tactoids (Extended Data Fig. 9; see also discussions in Supplementary Information). To further validate this idea, we loaded both molecules to the PEG–dextran solution. The behaviour of UPy-COOH was generally similar to that of UPy-Gly, except for its response to pH and salt concentrations (Fig. 5c and Supplementary Figs. 4b and 24). BTA-EG4 failed to stabilize the dextran droplets as it aggregated strongly in the PEG phase and could not attach to the dextran droplets. BTA-Glc, on the other hand, could interact with dextran through the glucose functional group and tended to condense at the interface of the droplets (Fig. 5d and Extended Data Fig. 10c). The surfactant, dodecyl PEG (DPEG), was used to break down the heavily entangled network of BTA-Glc to enhance its solubility and mobility in the PEG phase. The condensed supramolecular polymers of BTA-Glc then transformed into bundles and extended to the PEG phase, forming into hairy ball-like structures with droplets encapsulated inside (Supplementary Video 4 and Fig. 5d). By pushing the droplets with the weight of the coverslip, the droplets were released, leaving most parts of the BTA-Glc cages intact (Fig. 5d).
Discussion
We have developed a new way to produce highly ordered liquid tactoids with micrometre dimensions. The formation is based on a spontaneous LLPS behaviour of high-aspect-ratio fibrils, which is supposed to be a general phenomenon for various rod-like supramolecular polymers based on phase-separation theory. The process starts with the growth of supramolecular polymers and fibril elongation, followed by an entropy-driven phase separation to one ordered aqueous phase in a continuous aqueous solution with a low concentration of fibrils. The exact nature of the highly structured aqueous phase is intriguing and requires more investigation. Over time, the tactoids become more rigid. The rigidifying rate and extent increase with the concentration of crowders. Ordered arrays of structures over multi-length scales could be achieved in liquids by controlling LLPS and supramolecular polymerizations with solution conditions (pH and salt concentration), crowding effects and heterogeneous nucleation at the interface with the substrate. In addition, the dynamic behaviour caused by the liquidity of the new phase and the non-covalent nature of the intermolecular interactions makes it responsive to the actively evolving chemical system and the interactive environment. With tunable kinetics, dynamics, internal order, morphology and mechanics and many possibilities to combine different functional groups, we propose LLPS of supramolecular polymers as a general way to produce biomaterials that are applicable in the biological, medical and pharmaceutical fields by serving as the active interface with cells and tissues. Besides, the notable observation of LLPS of supramolecular polymers qualifies them as a new and amplified analogue to the low molecular weight liquid crystals and gives important insights into understanding the liquid crystal self-assembly. Moreover, the simplicity of the synthetic systems together with a high chemical diversity to modify the behaviour of LLPS make it an attractive model to explain many of the intriguing challenges of biological equivalents. The introduction of chiral and stimuli-responsive supramolecular polymers is notable and is part of further detailed studies.
Materials
All chemicals and reagents were purchased from commercial sources at the highest purity available and used as received unless otherwise stated. UPy-Gly, BTA-EG4 and BTA-Glc were ordered from SymoChem. mPEG-O-C12 (DPEG, PEG MW: 5,000), PEG-fluorescein isothiocyanate (FITC) (MW: 10,000) and dextran-FITC (MW: 550,000) were obtained from Creative PEGWorks. PEG (MW: 8,000), cetrimonium bromide (CTAB) and alginate and sodium salt from brown algae were purchased from Sigma-Aldrich. Dextran 500 was ordered from Pharmacosmos (pharmaceutical quality). Water was purified on an EMD Millipore Milli-Q Integral Water Purification system. UPy–COOH was synthesized following previous methods. The synthesis of BTA-Cy5 is also reported in our previous work. The synthesis route for UPy-Cy5 can be found in the Supplementary Information.
Sample preparation
UPy-Gly or UPy-COOH stock solution
The stock solution was always freshly made. To prepare 4 wt% of stock solution, either UPy-Gly or UPy-COOH solid was dissolved in the PBS buffer and a calculated amount of 1 M NaOH, to make the final pH higher than 11. The solution was then heated at 75 °C for 15 min. Subsequently, a calculated amount of 600 μM of UPy-Cy5 or 1 mM of Nile red in methanol was added and mixed with the stock solution to reach a final concentration of 7.2 µM (UPy–-Cy5) or 2 µM (Nile red). Finally, 1 M HCl was added to adjust the pH to the targeted pH.
UPy-Gly or UPy-COOH solution with dextran
The freshly made UPy-Gly or UPy-COOH stock solution was immediately added into the prediluted PBS solution and mixed. Then 10 or 20 wt% of dextran solution (with 0.08 mol% of dextran-FITC) was added to reach to the required concentration. The mixture was vortexed for 20–30 s.
UPy-Gly or UPy-COOH solution with PEG and dextran
The freshly made UPy-Gly or UPy-COOH stock solution was immediately added into the premixed PBS and PEG solution and mixed. To achieve the required concentration, 10 or 20 wt% of dextran solution (with 0.08 mol% of dextran-FITC) was then added. The mixture was vortexed for 20–30 s.
BTA-EG4 solution with CTAB
A total of 4 mg ml−1 of BTA-EG4 stock solution was freshly made by mixing BTA-EG4 solid with 0.1 mol equiv. of CTAB and water; it was stirred and heated at 80 °C for 15 min. After heating, 500 µM of BTA-Cy5 in methanol was added to get a final concentration of about 1 µM. A small volume of the concentrated CTAB solution (50 mg ml−1) was added to adjust the BTA-EG4/CTAB ratio later.
BTA-Glc solution with PEG and dextran
A total of 4 mg ml−1 of BTA-Glc stock solution was prepared by dissolving BTA-Glc solid in water; it was stirred and heated at 75 °C for 15 min. After heating, 500 µM of BTA-Cy5 in methanol was added to get a final concentration of 1 or 2 µM. The stock solution was then mixed with the heated dPEG solution. Next, the preheated 20 wt% of PEG was added before adding 20 wt% of dextran solution (with 0.08 mol% of dextran-FITC). The volumes of the added solutions were adjusted to arrive at the designed concentrations. The solution was shaken or vortexed after each step. All solutions except for the UPy-Gly or UPy-COOH stock solution were either incubated in the Eppendorf tube or transferred to the imaging chambers immediately after preparation.
Zeta potential measurements
Zeta potentials were measured on a Malvern instrument Zetasizer, model Nano ZSP. Zetasizer software was used to analyse and process the zeta potential data. For the preparation of UPy-COOH and UPy-Gly samples, the solid samples were dissolved and annealed in basic 0.84 × PBS (110 mM NaOH) at a concentration of 4.4 wt% for 15 min at 75 °C. After dissolving, the samples were diluted with MiliQ and 1 × PBS and adjusted to the final pH varying from 4.6 to 9 with 1 M HCl, resulting in 0.4 mM of UPy-Gly or UPy-COOH with different PBS concentrations. A DTS1070 cuvette was used for measuring the zeta potential. The measurement duration time was automated, and automatic attenuation and voltage was selected. The samples were measured in triplo at RT with a 30 s equilibration time.
To break down UPy-Gly fibrils, dual asymmetric centrifugation was performed using a Hettich ZentriMix 380 R equipped with a ZentriMix rotor. Samples were added to 0.2 ml Eppendorf tubes and centrifuged for 60 min with a rotational speed of 2,500 rpm. The samples were subjected only to shear forces generated by the dual rotor set-up with no milling beads added.
Confocal laser scanning microscopy
Sample preparation method 1
A total of 8–9 µl of the fresh sample was loaded into a 120-µm-thick chamber built with two pieces of #1.5 cover glass with an imaging spacer (Grace Bio-Labs SecureSeal imaging spacer, 8 wells, diameter × thickness: 9 mm × 0.12 mm) in the middle.
Sample preparation method 2
A total of 45–48 µl of the fresh sample was loaded into an 800-µm-thick chamber (Grace Bio-Labs SecureSeal hybridization chambers, 8 wells, diameter × depth: 9 mm × 0.8 mm, port diameter: 1.5 mm) with the #1.5 cover glass at the bottom. The open ports were sealed after sample loading.
Sample preparation method 3
About 100 µl of the fresh sample was loaded into each well of the ibidi μ-slide (18 wells, no. 1.5H glass bottom, well size: 5.7 × 6.1 × 6.8 mm3) and covered with the lid.
Sample preparation method 4
About 5 µl of the sample was loaded onto the glass holder and covered with the #1.5 cover glass. The surroundings of the cover glass were sealed with nail polish to reduce evaporation-induced drifting or flowing.The fluorescent images and videos were acquired with the Leica TCS SP8 microscope in the confocal mode with 40×/0.9 (dry), 63×/1.2 (water immersion) and 63×/1.3 (oil immersion) objectives at a resolution of 512 × 512, 1,024 × 1,024 or 2,048 × 2,048 pixels. The lasers used were 488 nm (for FITC), 552 nm (for Nile red) and 638 nm (for Cy5). The videos were taken with a time gap of 10 min. The z-stack images were collected with a gap of 0.5, 1.0 or 2.0 µm.The bright field images were collected with the Leica TCS SP8 microscope in the BF mode.The image analysis was conducted with ImageJ or the Leica microscope built-in software (only for some z-stack images).The tracking of the phase-separation states (concentration ratios of UPy-Cy5 inside and outside the droplets) is realized by time-lapsed videos of CLSM. The tempo-spatially resolved change of the fluorescence intensities can be extracted from each frame of the video. To avoid a bleaching effect, we set a 10 min gap between each frame. Several samples were tracked simultaneously using the ‘mark & find’ function.
Fluorescence recovery after photobleaching
The FRAP was conducted on the Leica TCS SP8 microscope in the confocal mode with a 63×/1.2 (water immersion) numerical aperture objective at a resolution of 512 × 512 pixels. The samples were dyed with 1.8 µM of UPy-Cy5. One to three images were taken before bleaching with the imaging power of 0.5–1.0%. Subsequently, selected circular areas with diameters ranging from 0.6 to 7.0 µm were bleached for 10 cycles (0.3–0.7 s per cycle) at 50% of power with the 638 nm laser. The following images were captured with 0.5–1.0% of power every 0.3–5.0 s. The whole process was automated with the built-in software. Three or more measurements were conducted for each sample. The fluorescence intensities of the regions of interest (ROIs) were extracted by ImageJ and normalized with the intensities of the reference area following the equation below.(1) 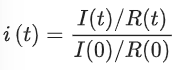
Where i(t) is the normalized fluorescence intensity at time t, I(t) and I(0) are the fluorescence intensities of the ROI at times t and 0, respectively. R(t) and R(0) are the fluorescence intensities of the reference area at times t and 0, respectively. The normalized fluorescence recovery curves were then fitted with a first-order exponential equation (equation (2)) where A is the amplitude of the recovery, τ is the critical recovery time and C is the intercept55.
(2)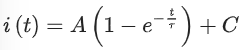
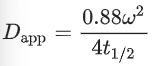
The half-life of the recovery (t1/2) could then be determined by equation (3) and the apparent diffusion constant (Dapp) could be calculated by factoring in the radius of the ROI (ω) following equation (4).
(3)![]()
(4)
Atomic force microscopy
Wet samples for force curve measurements
The freshly cleaved mica was first treated with 20 µM of CaCl2 for 20–30 min and washed with water two or three times. The residual solutions were pipetted away from the mica, eventually leaving a thin layer of water on the top. Next, 1 µl of the sample was evenly added onto the mica by immersing the tip of the pipette into the thin water layer. The mica was then incubated at room temperature for at least half an hour. It was either covered or replenished with water to avoid drying during the incubation time. Finally, about 100 µl of the buffer, which contained the same concentration of dextran and PBS as the sample, was mounted onto the mica right before the measurements.
Dry samples for tapping mode imaging
Samples were first diluted in water with a final concentration of 10 µM. A total of 5 µl of the diluted sample was immediately spin-coated onto a piece of freshly cleaved mica, of size 1.0 × 1.0–1.5 × 1.5 cm2, at 2,000 rpm for 1 min.
In situ force curve measurements on tactoids
AFM measurements were conducted on a Cypher Environmental Scanner equipped with a closed gas cell. An active heating and cooling stage was used to actively control the temperature at 20 °C. The measured force curves on the tactoids were recorded in contact mode using a superluminescent diode to reduce the signal-to-noise ratio. Spherical poly methyl methacrylate (PMMA)-based CP-CONT-PM probes (Nanotools, spring constant k = 0.2 N m−1; r = 750 nm) with a resonance frequency of 30 Hz (approximately 7 Hz in PBS buffer) were used for all measurements. The cantilever was thermally calibrated in solution with blueDrive using the ‘Get Real’ function in the Igor Pro software. Force curves were obtained using a slow scan rate of 0.061 Hz over a force distance of about 4 µm (velocity 414.11 nm s−1) to prevent any perturbations in the PBS buffer that could cause the displacing of the tactoids. Furthermore, the trigger point was kept to between 10 and 15 nN. After obtaining the force curves, we applied the Hertz model (for spherical AFM tips) to extract the Young’s modulus of the tactoids (equation (5)).
(5)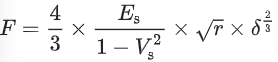
where F is the applied force, Es is Young’s modulus, Vs is the Poisson ratio (Vs = 0.4), r is the radius of the spherical AFM tip and δ is the indentation depth. For all samples, several force curves (6–26) were recorded, and mean values and standard deviations were extracted. Two-sample Student’s t-tests were performed to verify the difference between two populations.
Tapping mode imaging of fibrils
AFM measurements of dry samples in tapping mode (phase less than 90) were similarly recorded on the Cypher Environmental Scanner equipped with a closed cell and a normal laser diode. A heating and cooling stage was used to actively control the temperature at 20 °C. Silicon AC–160TS probes (Oxford instruments, spring constant k = 26 N m−1; f = 300 kHz) with a tip height of 14 µm and a radius of 7 nm were used for all measurements and calibrated using the ‘Get Real’ function in the Igor Pro software. Height images of either 20 × 20 µm or 10 × 10 µm were acquired using a scan rate of 3.0 Hz and 1,024 × 1,024 pixels. Contrast of the images was further enhanced using first-order planefit and flattening using Gwyddion v.2.60. Subsequently, the lengths of the UPy-Gly fibrils in the processed images were measured using the Digimizer software. The histograms of the fibril length were fitted with the Gaussian distributions.
Cryogenic transmission electron microscopy
For cryoTEM measurements, Quantifoil grids (R 2/2, Quantifoil Micro Tools GmbH) or Lacey grids (LC200-Cu, Electron Microscopy Sciences) were used. Before sample addition, grids were treated with surface plasma at 5 mA for 40 s using a Cressington 208 carbon coater. A total of 3 µl of the sample was applied to the grid held in an automated vitrification robot (FEI Vitrobot Mark IV), operating at 22 °C with a relative humidity of 100%. Excess sample was removed by blotting for 3 s using the filter paper with a blotting force of −2. The thin film formed was vitrified by plunging the grid into liquid ethane just above its freezing point. Vitrified films were transferred into the vacuum of a CryoTITAN (Thermo Fisher) equipped with a field emission gun operated at 300 kV, a postcolumn Gatan energy filter and a 2,048 × 2,048 Gatan CCD camera. Virtrified films were observed in the CryoTITAN microscope at temperatures below −170 °C. Micrographs were taken at low-dose conditions, using defocus values including −10 µm, −5 µm and −2.5 µm at 24,000 magnification.
The fibril diameters were extracted from several cryoTEM images per sample with ImageJ. The histograms of the fibril diameters could be fitted with the Gaussion distribution. Two-sample t-tests were carried out to verify the difference of mean values between two populations.
Polarized fluorescence microscopy
A total of 2 µl of the sample was added to the holding glass and covered with #1.5 cover glass. The sides of the cover glass were sealed with nail polish to avoid evaporation and sample drifting.
Optical polarization measurements
The samples were imaged using a commercially available inverted microscope (model: Nikon Eclipse Ti2). After the samples were loaded on the microscope stage, it was illuminated (in epi-illumination mode) using a 637 nm excitation laser (OBIS FP 637LX, Coherent). The excitation parameters (excitation power 0.1 mW) were controlled using the Coherent software. The collimated laser beam was first allowed to pass through a 640 ± 10 nm band-pass filter, followed by a zero-order half-wave plate (Thorlabs) which is mounted on a rotation mount. The excitation beam was reflected by a dichroic mirror (ZT640rdc, Chroma) and was directed to an oil-immersion objective (Apo-TIRF, 60×, 1.49 numerical aperture, Nikon). This set-up results in the sample being illuminated with a collimated light beam with a well-controlled polarization state. To eliminate the concern of the depolarization of the excited light passing through the optics, we mounted a polarizer on top of the objective lens and measured the laser intensity by tuning the angle of the half-wave plate. The minimum laser intensity detected was almost zero. This suggests almost 100% polarization of the excited light.
The fluorescence signal was collected by the same objective lens and passed through a 635 nm notch filter and a 700 ± 75 nm band-pass filter before being collected by the detector (Prime BSI Express sCMOS camera, Teledyne Photometrics). The wide-field fluorescence images from the samples were captured using NIS Elements (Nikon) with an exposure time of 100 ms. For each sample, several 225 s or longer videos were recorded with the half-wave plate manually rotated by 4° every 5 s. This resulted in a polarization rotation of 2θ when the half-wave plate was rotated by θ.
The fluorescence intensities of the tactoids were extracted using ImageJ and plotted against the polarization angle of the incident light beam (Fig. 3g and Supplementary Fig. 8). To fit the oscillating fluorescence intensity curves, we first studied the bleaching effect and found that the intensities decayed linearly over time and that the bleaching rate was roughly linear to the starting intensity (Supplementary Fig. 6). Subsequently, we modified the squared cosine function and fitted the oscillatory curves with the following equations using Origin.
(6)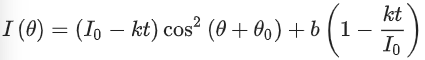
(7)
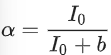
where I0 is the amplitude of the oscillation curve and b is a constant that is not sensitive to the angle of the linearly polarized light (θ). k is the decaying rate of the amplitude due to bleaching. θ0 is related to the orientation of the dyes. The extent of alignment (α) of the fibrils within the tactoids can thus be calculated by equation (8).
(8)
The good correlation between the angles of the dyes (θ0) and the relative orientations of the tactoids (θtactoids) obtained from the images confirmed correlated positioning between the dyes and the fibrils (Supplementary Fig. 7).
Instant molecular orientation microscopy based on a polarization camera
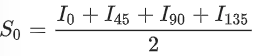
POLCAM is used to map the molecular orientation distribution in the tactoids38. It is a simplified fluorescence orientation microscopy method based on a wide-field fluorescence microscope set-up. In the measurement based on POLCAM, we use the same microscope set-up as in normal linear polarizer-based measurement, as described above, except that instead of an sCMOS camera, we use a polarization camera DZK 33UX250 from The Imaging Source. A quarter-wave plate is installed in the light path to get circularly polarized light for the imaging of the background. The polarization camera is equipped with Sony IMX250MZR Polarsens sensor chip with on-chip polarizers with transmission axis in four directions (0°, 45°, 90° and −45°), thanks to which full Stokes parameters can be calculated on the basis of the fluorescence intensities measured from the four polarization channels. We define the Stokes parameters as follows.
(9)
(10)![]()
(11)![]()
where I0, I45, I90 and I135 are measured intensities in the four polarized channels from the polarization camera. Defined as such, the Stokes parameters describe the total intensity of the optical field (S0), the intensity of linear horizontal or vertical polarization (S1) and the intensity of linear 45° or −45° polarization (S2). The pixel-by-pixel Stokes parameters are then used to calculate the in-plane orientation ϕ of the fluorescence emission coming from UPy-Cy5 in the tactoids. We define the in-plane orientation of the fluorescence emission by:
(12)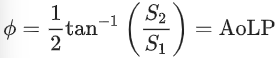
where AoLP stands for the angle of linear polarization.
To analyse the images from polarization camera measurement, we use the open-source software for the POLCAM method (POLCAM-SR) under the diffraction-limited mode.
Small-angle X-ray scattering
The SAXS measurements were conducted on a SAXSLAB Ganesha system, equipped with a GeniX-Cu ultra-low divergence source and a photon flux of 1 × 10⁸ photons s−1. The wavelength of the X-ray is 1.5 Å. About 150 µl of solutions were loaded into each fixed, 2 mm quartz capillary. Two-dimensional intensity images were collected with a Pilatus 300 K silicon pixel detector with a measurement of 4 h and converted to one-dimensional plots with SAXSGUI. The q range covered by a single measurement was 0.12–6.90 nm−1 and the absolute q value was calibrated with AgBeh. Solvent and capillary contributions to the scattering intensities were subtracted from the blank solution with the PRIMUS program from the ATSAS software package.
Dynamic and static light scattering
DLS and SLS experiments were performed on an ALV/CGS-3 compact goniometer system (ALV-GmbH), which consists of a single detector, ALV/LSE-5004 light-scattering electronics, several tau digital correlators and a Cobolt Samba 50 laser (laser wavelength 532 nm). DLS/SLS data were collected from 20° to 150° with a 10° step.
New insights in the 3-D rheological properties and collagen fibers orientation in murine periodontal ligaments
Mahmoud Sedky Adly, Richard Younes, Marta Martin, Thierry Cloitre, Afnan Sedky Adly, Ivan Panayotov, Philippe Bousquet, Csilla Gergely, Frederic J.G. Cuisinier, Delphine Carayon and Elias Estephan
Journal of the Mechanics and Physics of Solids, Volume 189, August 2024, 105715
doi: https://doi.org/10.1016/j.jmps.2024.105715
Abstract
The rheological properties of the periodontal ligament are key parameters to understand the homeostatic stability of the tooth supporting apparatus. The objective of this study is to lay new insights on the rheological properties and structural information of different regions in murine periodontal ligament by using atomic force (AFM) and multi-photon microscopy (MPM). A significant variation in elasticity of different regions was measured. The elasticity of periodontal ligament showed a significant tendency to become softer towards the furcation, the nearest area to the center of resistance of the tooth. This can open a new prospective for connecting the rheological adaptation of periodontal ligament to the tooth geometry that defines the center of resistance. Another important finding revealed by the second harmonic generation (SHG) signal exhibited by collagen fibers and measured by MPM is that the orientation of fibers in the furcation region can both provide space for tooth vertical movement with high compressive loads and prevent horizontal tooth movement. Additionally, it was found that the dispersion of the angles at different levels of cutting indicates homogeneity in the directionality of fibers across different regions. These results provide an accurate description of the rheological properties and structural information of periodontal ligament, which can serve as a base for comparison with other local and systemic diseases that may influence the periodontal ligament.
IntroductionThe rheological properties of the periodontal ligament are essential parameters to understand the biomechanical behavior of the tooth as well as its surrounding tissues (Limjeerajarus et al., 2023). Periodontal ligament is an essential component of the tooth which has many important functions. These include: (i) supportive function as it provides an attachment for the root of the tooth to the alveolar bone, allows the teeth to withstand the forces of mastication, prevents the tooth from moving too far by non-elastic fibers and the components of the ligament which act together as shock absorber or hydraulic damper; (ii) nutritive function, as blood vessels of the ligament provide nutrition for cells of the ligament, cementum, and alveolar bone; (iii) homeostatic function because cells of the periodontal ligament have the capacity to synthesize and resorb the extracellular substances of the ligament, cementum and alveolar bone; (iv) sensory function by inclusion of mechanoreceptors for touch and pressure sensations, hereby protecting the tooth in case of sudden overload; (v) finally, a protective function which is achieved by collagen fibers arranged in bundles running in different directions so they counteract the forces applied to the tooth whatever is their direction. Also, blood capillaries that are arranged in the form of coils act as shock absorber and nerves protect the tooth in case of sudden overload.
Moreover, the periodontal ligament (PDL) is considered the most deformable dental component having the ability to transmit both orthodontic and functional forces to the alveolar bone (Dong-Xu et al., 2011). The ligament is composed mainly of collagen fibers running in several directions between alveolar bone and root surfaces. In addition, the fibers density was found to be different along the various sites of the periodontal ligament (Connizzo and Naveh, 2020). The unique architecture of the PDL collagen fibers, their perpendicular or oblique alignment along the length of the tooth is essential for maintaining proper tooth functioning as well as facilitating development of alveolar bone during childhood (Huri et al., 2015).
Reviewing the literature, it appears that numerous imaging techniques are used to study the biomechanical behavior of periodontal ligament related biomechanics, which include photo-elasticity (Asundi and Kishen, 2000), Moire interferometry (Wood et al., 2003), electronic speckle pattern interferometry (Zaslansky et al., 2006), strain gauges (Popowics et al., 2009), digital image correlation (Zhang et al., 2009), and a micro CT scanner with a loading system (Naveh et al., 2012).
Nanoindentation techniques, powerful technologies to explore mechanical aspects of biological matter at the nanoscale, open generating significant contributions in the comprehension of various human diseases. Atomic force microscopy (AFM) is a nano-sensing device that provides accurate measurements of elastic modulus and determines cellular strain distribution (Saab et al., 2013). AFM is also a label-free imaging technique providing high resolution images of cell morphology. AFM has the potential to spatially resolve the sample's elasticity by nanoindentation, and to map sample properties that are directly correlated to the topography. (Shi et al., 2010).
A number of recent studies proposed multi-photon microscopy (MPM) as a valuable label-free imaging technique to characterize different aspects of the periodontal ligament (Martínez-Ojeda et al., 2020). MPM is a non-linear optical technique enabling deep imaging of a biological sample when scanned by an IR pulsed-laser. The spatial localization of the excitation in the focusing volume of the objective allows a significant reduction of photobleaching. Therefore, MPM can provide high resolution sectioning images without the need of histological approaches or staining (Chen et al., 2007). The multiphoton excitation process will produce a second harmonic generation (SHG) signal, providing useful information on the structure and optical properties of a non-centrosymmetric specimen like the fibrillar collagen.
The minimal invasiveness of AFM and MPM imaging modalities and the valuable complementary information they can provide renders these approaches highly suitable to monitor dental tissues (Chen et al., 2007). Towards diagnostic applications, experimental animal models have been used to enable the study of periodontal ligament and oral structures (Marchesan et al., 2018).
In orthodontic applications, the movement of teeth within the alveolar bone is based mainly on the ability of the surrounding periodontal ligaments to react to mechanical stimulation with remodeling processes (Kawarizadeh et al., 2003; Adly et al., 2024). Furthermore, the emerging dental implant applications aim for using bioengineered PDL around the osseointegrated dental implants to improve efficiency of the biological function (Mathew et al., 2020).
Evaluation of the rheological properties of periodontal ligaments is considered a great challenge for guiding orthodontic applications. This study aims to investigate the rheological properties in relation with the structural information of different regions in murine periodontal ligament by a combined AFM and MPM study.
2. Materials and methods2.1. Animals and ethics statements
Animal experiments were approved by the national ethics committee on animal experimentation and were conducted in compliance with the European Community and national directives for the care and use of laboratory animals. C57BL/6 J mice were purchased from Jackson laboratory (Bar Harbor, MA (USA)) and maintained under specific–pathogen free conditions. In our experiments, mice were used at 140 days of age. They were housed in cages with light/dark cycle with 12 h each. Mice were feed ad libitum in the animal facilities of Institute for Neurosciences of Montpellier (INM), UMR 1298 Inserm, University of Montpellier, France accredited by the French Ministry of Food, Agriculture and Fisheries (B34 172 36–11 March 2010). In addition, all the experiments were done in accordance with the Directives of the Council of the European Communities of November 24, 1986 (86/609/EEC) and the French Ethics Committee (approval number D3417236).
This study was conducted on 3 mice that were sacrificed and their mandibles were dissected then cleaned from soft tissue and finally sectioned. According to the method recommended by Kawamoto (Kawamoto and Kawamoto, 2021), the samples were immediately embedded in SCEM followed by snap freezing in 2 methyl-butane cooled with liquid nitrogen, then were stored at −80 °C until testing. The mandibles were then mounted on a cryostat (Epredia cryostar NX50 (Kalamazoo, Michigan, USA)) and sectioned every 20μm in the transverse plane from the apical region till the furcation region. Finally, samples were mounted on an adhesive film for study by AFM and MPM.
Sectioning of mandibular roots were performed at three different levels of the second molar and every level was examined with at least 7 sections. These include the furcation level (NF) having a thickness of ∼140μm, level 2 (N2) having a thickness of ∼ 220μm and level 1 (N1) having a thickness of ∼ 260μm (Fig.A). Measurements were made on eight regions on every section. The examined sites were named according to Fig. B and Fig. 1 C.
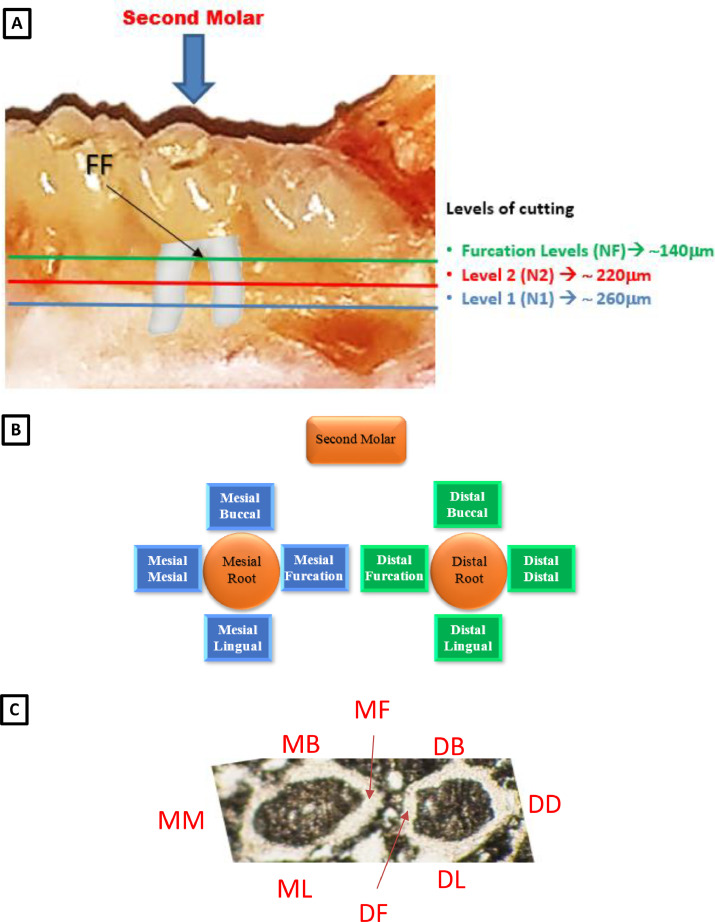
Fig. 1. Samples definition A) the different examination levels of mandibular roots and the Furcation (FF) area. B) schema explaining the labelling of different surfaces of the root. C) histological section illustrating the different surfaces. Mesial (MM), Mesial Buccal (MB), Mesial Lingual (ML), Mesial Furcation (MF), Distal Furcation (DF), Distal Buccal (DB), Distal Lingual (DL), Distal (DD).
2.3. Atomic force microscopy (AFM)
AFM force spectroscopy (FS) experiments were performed using an Asylum MFP-3D head coupled to a Molecular Force Probe 3D controller (Asylum Research, Santa Barbara, CA, USA). Borosilicate glass spherical colloid probe cantilevers with a nominal spring constant of 0.1 N/m, radius of 10 μm, length 125 μm, width 35 μm and resonance frequency 30 kHz (CP-qp-CONT-BSG-B-5, NanoAndMore GmbH) were used. The spring constant of the cantilevers was determined using the thermal noise method available within the MFP-3D software. Force measurements were performed in phosphate buffred saline (PBS) buffer, at room temperature and with a maximum loading force of 25 nN. Force-volume experiments were performed on a grid of 15 × 15 points over a region of 5 × 5 µm2 in the different areas, with at least 3 measurements per area type. The recorded AFM-FS data were used to determine the Young's modulus (E) of the tissue using a modified Hertz model based on the work of Sneddon (Sneddon, 1965). Histograms of the Young's moduli distribution were fitted with a Gaussian function to obtain the mean E value of the probed area in the different locations.
2.4. Multiphoton microscopy (MPM)
MPM images were acquired with a custom-made multiphoton microscope build on an upright SliceScope microscope (MPSS-1000P, Scientifica, Uckfield, UK) equipped with a galvanometer scan head and a Nikon 16x water immersion objective (CFI75 LWD-16x-W, Tokyo, Japan). Samples were excited at 780 nm by a femtosecond Ti:Sapphire laser with ∼100 fs pulse duration at 80 MHz (Tsunami, Spectra Physics, Milpitas, CA, USA). The polarization of the beam was controlled by a combination of achromatic half wave and quarter wave plates mounted on rotary stages. SHG signal was detected in transmission by a high sensitivity GaAsP photomultiplier (H7422P, Hamamatsu, Hamamatsu-city, Japan), through a 1.4-NA water-immersion condenser (U-AAC, Olympus, Tokyo, Japan), filtered by a 482 nm long pass dichroic mirror (86–331, Edmund Optics, Barrington, NJ, USA), a 550 nm short pass filter (84–708 Edmund Optics, USA) and a 447 nm high-performance band-pass filter (NT 48–074, Edmund Optics, USA). In depth, Z-stack images were recorded in a window of 410 × 410 µm2, at 1024 × 1024 pixels resolution, with a 6 µm Z-step.
2.5. FIJI-Image J
MPM images were analyzed using ImageJ 1.54f (NIH (New York, USA)). First of all, images were stacked and grouped in Z, enhancing the contrast of the resultant image in order to delineate our region of interest (Fig. 2 A). This latter was extracted from the original images Fig. 2 B) and treated with the tubeness filter in order to enhance the structure as shown in Fig. 2 C.
Finally, the plugin directionality was used and histograms were built (Fig. 2 D) following the landmark in Fig. 2 The average of the orientation angle of fibers and its dispersion were extracted from the histograms.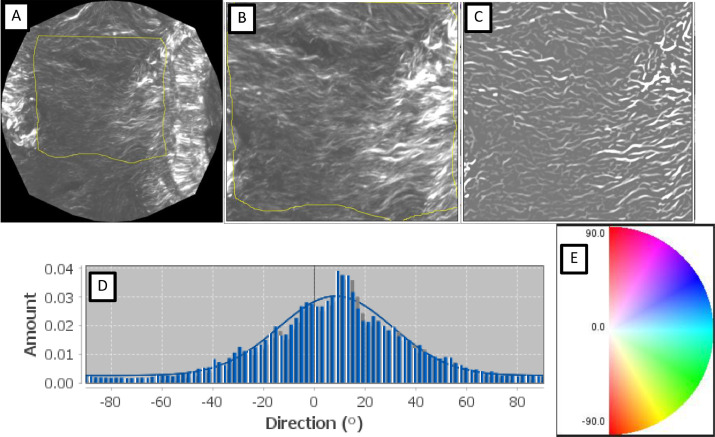
Fig. 2. Steps to measure the directionality of collagen fibers in the MPM images. A) view of furcation area; B) zooming of A; C) after tubeness filter used to enhance the filamentous structures of the specified thickness (Sato et al., 1998); D) directionality histogram (Diagram for directionality is in the range of blue); E) landmark for the measured angles.
2.6. Statistics
One-way ANOVA was assessed for comparison of Young's modulus values. Tukey's multiple comparisons were employed after performing normality tests for comparison of mean values. Three mice were studied, analyzing for each 3 different height sections (at N1, N2 and NF levels), 8 different areas of acquisitions (MM, MB, MF, ML, DD, DB, DF and DL) for N1 an N2 and 7 different areas of acquisitions (MM, MB, ML, DD, DB, DL and FF) for NF. Statistical significance was set at p ≤ 0.05. Data were analyzed via the GraphPad PRISM (ver.8.4.2) software. Results The main challenge to perform combined AFM and MPM studies on the murine second molars periodontal ligaments was to obtain high quality cryostat sections from the apical region till the furcation region on non-demineralized mandibles. Using the adhesive films proposed by KAWAMOTO method we succeeded to obtain net mandible sections at all levels. Fig. 1 C clearly shows the mesial and the distal roots in addition to the bone and the ligament at all regions in the N2 level.
3. Results
The main challenge to perform combined AFM and MPM studies on the murine second molars periodontal ligaments was to obtain high quality cryostat sections from the apical region till the furcation region on non-demineralized mandibles. Using the adhesive films proposed by KAWAMOTO method we succeeded to obtain net mandible sections at all levels. Fig. 1 C clearly shows the mesial and the distal roots in addition to the bone and the ligament at all regions in the N2 level.
3.1. Biomechanics of periodontal ligaments by AFM
High resolution combined 3D height-force map images were recorded in the FF region (Fig. 3). Elasticity maps reveal that the ligament in the middle of the region is softer (blue color in the Figure), becoming harder when closer to the dentine part. Fig. 3 A highlights the contrast in Young modulus, this latter is in the order of 0.5 kPa for the ligament and higher than 2.5 kPa at the border of the dentine. A zoomed image was recorded in the middle of the furcation region, revealing a Young's modulus histogram with an average of 440 Pa (Fig. 3 B).
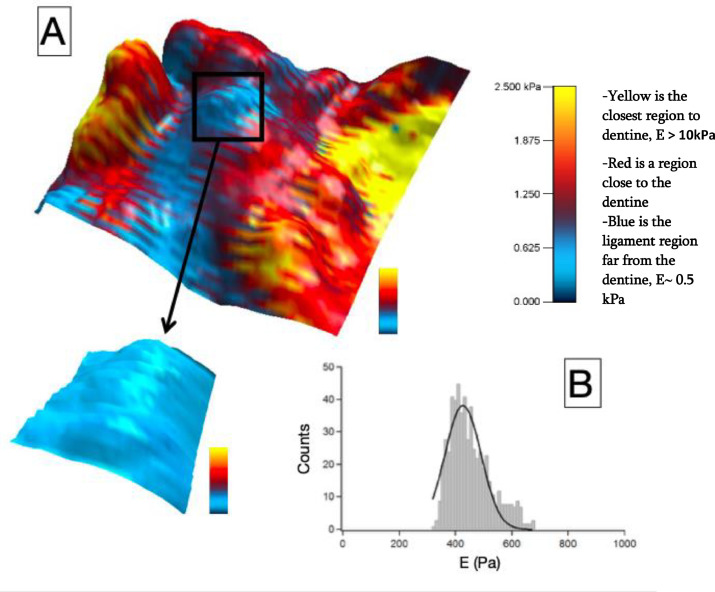
Fig. 3. A) High resolution combined 3D height - Young's modulus map images recorded by AFM at the furcation level (80μm2 x 80μm2 [top image] and 5μm2 x 5μm2 [lower left image], color bars 2.5 kPa). B) Histogram of the associated Young's modulus (E) of the highlighted furcation level showing one Gaussian distribution with a mean value of 440 Pa.
At least three force maps were performed on every region of each section. The results of the calculated Young's modulus (E) are illustrated in Fig. 4. No significant differences between sections were found at the first level (N1) and the second level (N2), as shown in Figs. 4 A and B. However, significant differences were found at the furcation levels (NF) between MM and DD (P = 0.0028), ML and DD (P < 0.0001), and finally DD and FF (P = 0.0003) sections, as shown in Fig. 4 This latter Figure indicates that the MM, ML and FF (where MF and DF are in contact at the furcation level) regions are softer than the DD one.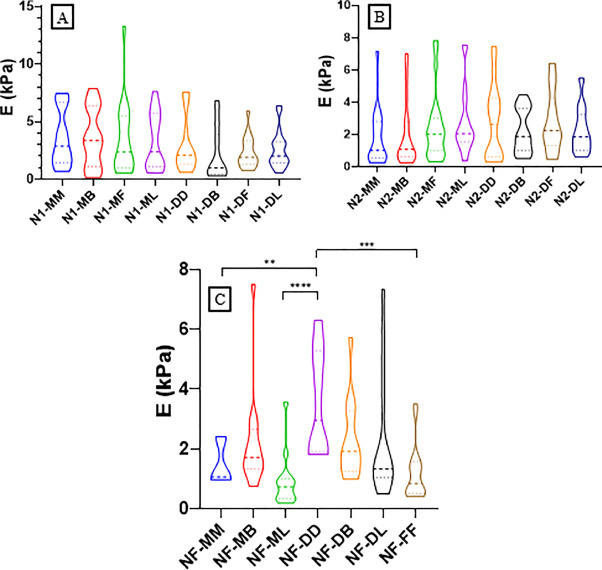
Fig. 4. Violin plot of the Young's modulus values for A) N1 level, B) N2 level and C) NF level of mandible. This chart, a combination of a box plot and a density plot, was used to display the distribution shape of the data, also including markers for the medians of the data and boxes indicating the interquartile ranges. NF, Furcation level; N2, Level 2; N1, Level 1; FF, Furcation; MM, Mesial; MB, Mesial Buccal; ML, Mesial Lingual; MF, Mesial Furcation; DF, Distal Furcation; DB, Distal Buccal; DL, Distal Lingual; DD, Distal.
Additionally, a comparison between N2 and NF, as well as N1 and N2, revealed no significant differences for all the regions (see supporting information Figures 1 and 2). On the other hand, comparison between N1 and NF levels revealed significant differences between N1-MM and NF-FF (p = 0.0425), N1-MM and NF-ML (p = 0.0125), N1-MB and NF-FF (p = 0.0405), N1-MB and NF-ML (p = 0.0118), and finally N1-MF and NF-ML (p = 0.0181). These results are shown in Fig. 5: Young's modulus is softer when we are close to the furcation level (higher level).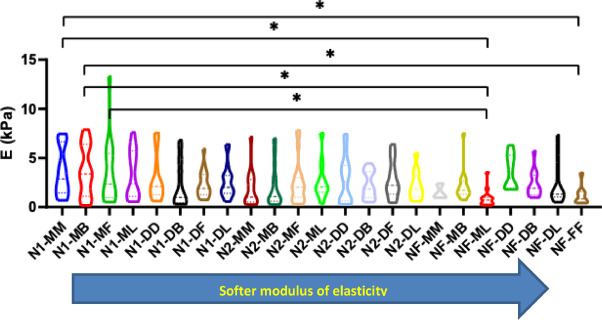
Fig. 5. Comparison of the Young's modulus (E) between different levels and regions of mice mandible; NF, Furcation level; N2, Level 2; N1, Level 1; FF, Furcation; MM, Mesial; MB, Mesial Buccal; ML, Mesial Lingual; MF, Mesial Furcation; DF, Distal Furcation; DB, Distal Buccal; DL, Distal Lingual; DD, Distal.
3.2. Collagen fibers orientation in the periodontal ligaments by MPM
Eight images (one image per region) were recorded on every section using the MPM. Examples of the acquired images are shown in Fig. 6. The second harmonic generation of the collagen fibers are evident in the MF region of the mesial root at the N1 level (Fig. 6 A). We can clearly differentiate between dentine, ligament and bone. Also, in the FF region between the mesial and the distal roots at the furcation level, the orientation of the fibers is noteworthy (Fig. 6 B). 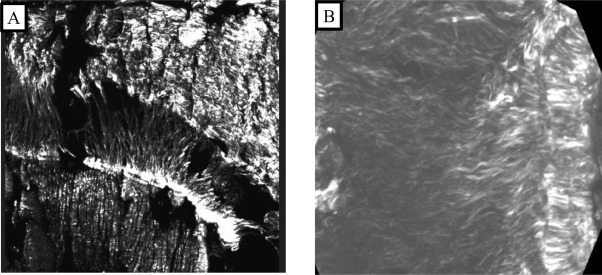
Fig. 6. Second Harmonic Generation – MPM image of: A) MF region of the mesial root. B) FF region between the mesial and the distal roots in the furcation level. MF, Mesial Furcation; FF, Furcation.
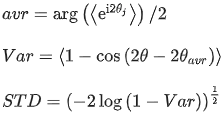
Using the Directionality Plugin of Image J, the orientation of collagen fibers was investigated. After evaluating the mean and the dispersion of the angle for each region and each section, circular statistics has been used to calculate the mean and the standard deviation of the angles according to the following equations (Mardia and Jupp, 2009):
The fibers’ orientation results are gathered in Fig. 7. Knowing that a very large error on the orientation can be obtained when positive and negative angles (blue-red or green-red respectively on the landmark (Fig. 2 E)) are calculated in the same region of a level, we remained careful to make some statistics on our results. Significant differences in angles were found in the N1 level between DB and MB, ML, DL (P = 0.0039, P = 0.0280, P = 0.0120 respectively) as shown in Fig. 7 Additionally, comparisons between angles in the N2 level revealed significant differences between DB and MB, MF, ML, DL (P = 0.0011, P = 0.0446, P < 0.0001, P = 0.0009 respectively) as well as between ML and DF (P = 0.0409) as shown in Fig. 7 Finally, comparisons between angles in the NF level revealed significant differences for MM when compared to MB, ML, DB (P < 0.0001, P = 0.0165, P = 0.0003 respectively), MB when compared to DD, DL, FF (P < 0.0001, P < 0.0001, P < 0.0001 respectively), ML when compared to DD, DL, FF (P = 0.0069, P = 0.0001, P = 0.0090 respectively), and DB when compared to DD, DL, FF (P < 0.0001, P < 0.0001, P < 0.0001 respectively) as shown in Fig. 7 However, no significant differences were found between the other regions. It should be pointed out that at all levels when we are localized in MM, MF, DF, DD and FF we are parallel to the x axis with angles ranging between 0 ͦ and rarely 20 ͦ. Contrariwise, when we are in MB, ML, DB and DL we are not perpendicular to the x axis with angles ranging between 35 ͦ and rarely 85. ͦ
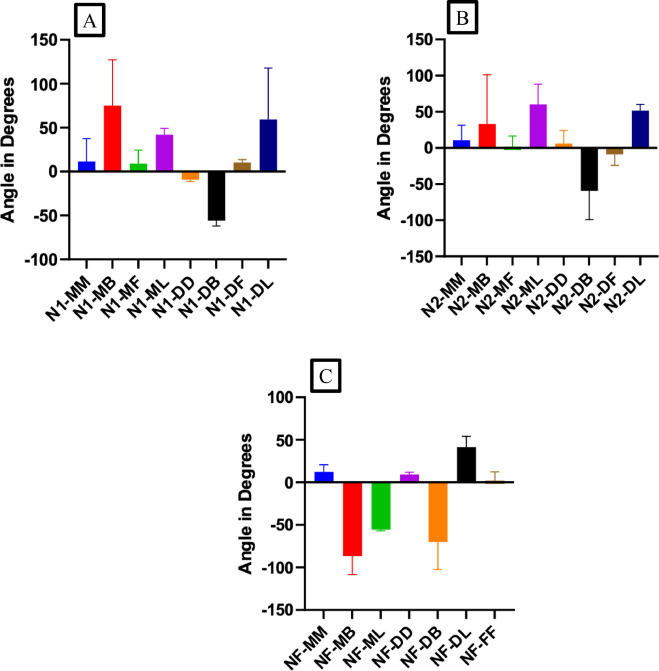
Fig. 7. Angles of collagen fibers orientation for A) N1 level, B) N2 level and C) NF level of the periodontal ligaments. NF, Furcation level; N2, Level 2; N1, Level 1; FF, Furcation; MM, Mesial; MB, Mesial Buccal; ML, Mesial Lingual; MF, Mesial Furcation; DF, Distal Furcation; DB, Distal Buccal; DL, Distal Lingual; DD, Distal.
Comparisons between levels were also performed. When comparing N1 level with N2 level, significant differences in angles were found between N2-DB and N1-DL, MB, ML as well as between N1-DB and N2-ML (See supporting information Figure 3 and Table 1).
When comparing N1 level with NF level, significant differences in angles were found between NF-DB and N1-DF, DL, MB, MF, ML, MM. In the same manner, significant differences in angles were found between NF-MB and N1- DF, DL, MB, MF, ML, MM in addition to DD. Moreover, significant differences were found between NF-ML and N1-DL, MB, ML. There was also significant difference between NF-FF and N1-MB as well as between NF-DL and N1-DB (See supporting information Figure 4 and Table 2).
When comparing N2 level with NF level, significant differences in angles were found between NF-DB and N2-DD, DL, MB, MF, ML. In the same manner, significant differences in angles were found between NF-MB and N2- DD, DL, MB, MF, ML in addition to DF and MM. Moreover, significant differences were found between NF-ML and N2-DL, MB, ML. There was also significant difference between NF-FF and N2-DB, ML as well as between NF-DL and N2-DB and between NF-DD and N2-DB (See supporting information Figure 5 and Table 3). However, no significant differences were found between the remaining sections.
When comparing all angles at all levels we observe that the average of the orientation angle in MB is positive in N1 and N2 and it becomes negative at NF. While in DB and DL it is always negative and positive respectively (Fig. 7A, B, C). There was no change in the dispersion of the angles extracted from the original histograms on the Image J plugin at different levels and different regions (Figure not shown).
4. Discussion
The periodontal ligaments have been investigated mainly in terms of their histological properties and the biochemical nature of its fibers (Motoji et al., 2020). However, linking rheological properties to the ability of these fibers to stretch at any functional loads is an important item also as it is responsible for the maintenance of the root at nearly elastically fixed state (Muslov et al., 2023). Our study was able to perform mechanical and structural assessment of the murine periodontal ligaments in several multiple regions of mice mandible through measuring the Young's modulus at these sites. These findings support previous studies that assume different Young's moduli in different regions (Connizzo and Naveh, 2020; Fill et al., 2011). Analysis for the values of different moduli showed inhomogeneity in tissue properties based on the anatomical locations (Connizzo and Naveh, 2020). Compared to these reports our study explore and discuss the elastic modulus at different levels and heights of the periodontal ligament.
The rheological properties of periodontal ligament have an essential role in controlling the deformation of these ligaments (Dorow et al., 2003). The application of external forces can result in major changes of the response of alveolar bone to the remodeling process (Ho et al., 2013). Thus, differences in Young's modulus at several levels of the periodontal ligament can significantly affect the process of remodeling inside the alveolar bone (Lin et al., 2017).
Indeed our AFM results revealed significant variations in tissue elasticity in different regions of the periodontal ligament. Elasticity of periodontal ligament showed a significant softening towards the furcation. A possible explanation for this finding can be attributed to the location of the center of resistance in molar teeth. The softening can be an important property that causes the center of resistance to be considered the point of greatest resistance to tooth movement. The center of resistance in the molar teeth was predicted to be positioned between the roots and just below the furcation (Oh et al., 2019). The center of resistance is considered an analogous to the center of mass because the tooth is not a free object as it is held by periodontal ligament (Gandhi et al., 2021), therefore it can be regarded as a balancing point for restrained bodies. This is because if a force is applied to this point, the tooth will produce pure bodily movement without any tipping (Nanda et al., 2010; Kuruthukulam and Patil, 2023). The position of the center of resistance of a tooth is dependent on various morphological or compositional factors. Morphological factors include length, number and shape of the roots in addition to the level of alveolar bone height surrounding the tooth. Unlike morphological factors, compositional factors such as periodontal ligament, elasticity of desmodontal structures and density of surrounding alveolar bone can be affected by more systemic rather than local factors such as age and nutrition (Nanda, 2014; Winning et al., 2021). Thus, elasticity of periodontal ligament can be significantly influenced by the position of the center of resistance. A study conducted by Kawarizadeh et al., found that strain at furcation area of molars was significantly higher than any other area indicating lower elastic modulus, in accordance with our findings (Kawarizadeh et al., 2003). This was confirmed by another AFM study that indicated that a low Young's modulus at the furcation area serves as a cushion that absorb vertical loading (Connizzo and Naveh, 2020). Another study on living periodontal ligament using AFM showed that generally the periodontal ligament exhibited a high elastic modulus value at the cell's nuclear sites, while most of the lower elastic modulus were found within the peripheral regions of the periodontal ligament cell. The heterogeneity in elasticity was assumed to be related to the distribution of stress fibers (Shi et al., 2010). Therefore, as demonstrated in Fig. 3, we suggest that the blue region is softer than the neighboring regions because the collagen fibers are more concentrated near the bone and/or the dentine (37). In addition to that, the longest collagen fibers inside the PDL are in the furcation region. They are attached from one side to the dentine and from the other side to the bone, rendering softer the middle region.
Liao et al., demonstrated that the computational characterization of dynamic dental structures can be conducted in the context of a predetermined or presumed PDL stiffness range. The PDL stiffness varies if an external load or orthodontic force is applied, therefore the non-linearity of the PDL Young's modulus should be considered (Liao et al., 2015).
MPM has been proven a powerful method for analysis of the morphology and directionality of collagen fibers in dental tissues. Although, using MPM in vivo can be unreliable because of the inability to control intrinsic tissue movement (Martínez-Ojeda et al., 2020) studies on excised tissues can provide valuable information on tissue organization.
Our MPM results revealed that the angle of the distal buccal surface was always negative and became more negative at the furcation level. On the other hand, the angle of the distal lingual surface was always positive and became less positive at the furcation level. We hypothesized that by the different orientation of collagen fibers in the furcation region periodontal ligaments can both provide space for tooth vertical movement with high compressive loads and prevent tooth movement in the other direction via its particular orientation. However, no change was found in the dispersion of the angles at different levels and different regions which indicate homogeneity in the directionality of fibers across different regions. When comparing directionality of fibers on level N1 and N2, where the oblique fibers of periodontal ligament is usually found, no-significant difference between the orientation angles have been revealed (De Jong et al., 2017). On the other hand, significant differences in fibers orientation were found when comparing N1 and N2 to NF. This can be explained with the fact that the type of fibers in NF are inter-radicular between the two roots and horizontal in other areas (Gilani et al., 2021). Finally, we can hypothesize that fiber orientations can be correlated to periodontal tissue elasticity by allowing cushioning properties against both vertical and horizontal masticatory forces with a predominance of resistance to the vertical force type. This was confirmed by MPM, which revealed different orientations of collagen fibers in the furcation region in addition to the softer Young's modulus revealed by AFM. The main limitation of our study was the small sample size; therefore, future work should aim at comparing some pathologies to a control group but with a larger sample size.
Conclusion
The combination of atomic force microscope and multiphoton microscopy is a promising approach to investigate in a label-free manner the nanomechanical and structural properties of the periodontal ligament. The main highlight of our study is that the collected and sectioned mice mandibles, without any further preparation, were investigated in their whole, enabling to compare the tissue elasticity and fibers collagen orientation in the periodontal ligament at different locations, levels and to correlate these with their functional and physiological role.
The main insights revealed by this study are the following:
The elasticity of the periodontal ligament showed a significant tendency to become softer towards the furcation, which is the nearest area to the center of resistance of the tooth. Additionally, it was found that there were no significant differences between N2-sections (level 2) and NF-sections (furcation level), as well as between the N1 and N2 sections (level 1 and 2) for all the regions.
The orientation of fibers in the furcation region can both provide space for tooth vertical movement with high compressive loads and prevent horizontal tooth movement.
The dispersion of the angles at different levels of cutting indicates homogeneity in the directionality of fibers across different regions.
CRediT authorship contribution statement
Mahmoud Sedky Adly: Writing – review & editing, Writing – original draft, Visualization, Methodology, Investigation, Conceptualization. Richard Younes: Methodology. Marta Martin: Methodology, Conceptualization. Thierry Cloitre: Methodology, Conceptualization. Afnan Sedky Adly: Writing – review & editing. Ivan Panayotov: Methodology, Conceptualization. Philippe Bousquet: Writing – review & editing, Visualization, Supervision, Methodology, Investigation, Conceptualization. Csilla Gergely: Writing – review & editing, Visualization, Supervision, Methodology, Investigation, Conceptualization. Frederic J.G. Cuisinier: Writing – review & editing, Visualization, Supervision, Methodology, Investigation, Conceptualization. Delphine Carayon: Writing – review & editing, Visualization, Supervision, Methodology, Investigation, Conceptualization. Elias Estephan: Writing – review & editing, Visualization, Supervision, Methodology, Investigation, Conceptualization.
Declaration of competing interest
The authors declare that they have no known competing financial interests or personal relationships that could have appeared to influence the work reported in this paper.
Acknowledgments
We gratefully acknowledge Dr. Vasiliki Kalatzis for her help concerning the microcryostat experiments. We also thank Antoine Picot and Denis Greuet who provided expertise in animal experiments. Finally, we acknowledge and express gratitude to EDMOS platform.
Special contribution of atomic force microscopy in cell death research
Ning Li , Li Zhang , Ou Qiao , Xinyue Wang , Linyan Xu and Yanhua GongFrom the journal Nanotechnology Reviews
Published by De Gruyter February 15, 2024
doi: https://doi.org/10.1515/ntrev-2023-0208
Abstract
Cell death is an important life activity in individual development. Changes in morphological and mechanical properties during cell death are crucial to identify the modes of cell death. However, due to technical limitations, little is known about these characteristics. The emergence of atomic force microscopy (AFM), a nanoscale research tool that integrates imaging and mechanical measurement functions, provides new insights into our understanding of cell death. Based on a brief introduction to the structure, principle, and working modes of AFM, this article elaborates on the contribution of AFM in cell death to detect morphological and mechanical properties, especially in apoptotic cells. Meanwhile, the potential of AFM in distinguishing different cell death modes and visualizing membrane pores (medicated by apoptosis and pyroptosis) is illustrated. In addition, this article states that using single-molecule force spectroscopy by AFM to study the mechanical and adhesive properties of cell death-related molecules. Finally, we discuss the challenges facing and further perspective of AFM.
Graphical abstract
1. Introduction
Cell death is a ubiquitous biological phenomenon in all living organisms and is inseparable from organ development, aging, and the removal of damaged cells. Research on the process of cell death has become a research hotspot in the fields of biology, medicine, and pharmacy. Based on functional differences, cell death can be classified into two types: programmed cell death (PCD) and non-PCD (necrosis). Currently known PCDs mainly include apoptosis, necroptosis, pyroptosis, autophagy, ferroptosis, and so on. The molecular mechanisms/signaling pathways of different death modes have been extensively explored, and meanwhile, morphological and mechanical properties are also particularly important for the characterization of different death modes. Especially in the field of oncology research, alterations in the elasticity and adhesion of individual cancer cells have been recognized as a property that promotes the spread of cancer cells. The morphological characteristics and mechanical properties of classical cell death modes such as apoptosis have been initially explored, but the morphological and mechanical properties of new cell death modes have not been fully analyzed.
Atomic force microscopy (AFM) is a nanoscale research tool that integrates imaging and mechanical measurement functions. Compared with other traditional microscopy techniques, AFM has many advantages. For example, in terms of sample imaging, the imaging environments are diverse, and samples can be imaged under various conditions, such as air, vacuum, or liquid, including dynamic observation of living cells. In addition, the sample is not limited by its conductive properties. Moreover, AFM does not require staining, labeling, or fixing. The possibility to operate in liquid environments and at ambient temperature moved the application of AFM extends from the materials science to the biological science, which needs to overcome many difficulties, including the difference between material samples and biological samples. In general, the preparation of biological samples is more complex, such as the preparation of suspension cell samples, which needs to use diverse methods (such as electrostatic adsorption and microporous membrane filtration) to fix the cells to the substrate (such as Petri dishes, cover slides). During imaging of certain biological samples, such as membrane proteins protruding ∼1 nm from the membrane, the AFM contact mode can provide sub-nanometer resolution (≤1 nm) for imaging individual membrane proteins. Meanwhile, various physical, chemical, and biological parameters can be characterized during imaging. In addition, as a multifunctional tool, AFM is one of the important tools to study the mechanical properties of cells, including the measurements of cell Young’s modulus, adhesion, and viscoelasticity. And AFM can measure the rupture forces between molecules or particles in the piconewton (pN) range, such as analyzing the interaction force of receptor–ligand. Over the past few decades, AFM has been successfully applied to the imaging analysis of various biological systems, including nucleic acids, proteins, cells, and tissues.
At the same time, recent research advances in AFM technology have strengthened its capabilities, such as multiparametric imaging AFM (MP-AFM), and high-speed AFM (HS-AFM), which enables simultaneous multiparametric imaging in a short time. The extraordinary ability of AFM makes it show a very broad contribution prospect in the field of cell death. It can clearly observe the morphological changes of different cell death methods, including changes in cell size, cell height, cell surface roughness, and the formation of cell membrane pores. In addition, AFM can measure dynamic changes in mechanical properties during cell death. Based on the previous research, this article briefly introduces the basic structure, imaging principle, and working modes of AFM and reviews its contribution in the field of cell death in detail, including the study of morphological and mechanical properties of different cell death modes (Graphical abstract, the curve in the figure is a schematic and does not represent real experimental data). At the end of this article, we also expound on the research status of AFM and discuss its current challenges and future development directions for the shortcomings of AFM.
2. The morphology and mechanisms of different cell death modes
There are multiple cell death modes, such as apoptosis, pyroptosis, necroptosis, and ferroptosis. Apoptosis was first described by Kerr et al. from a morphological point of view to describe the physiological death of cells and named it apoptosis. The main morphological features of apoptotic cells are chromatin condensation, cell shrinkage, cell membrane blebbing, cell budding to form apoptotic bodies, etc. (Table 1). After induction of apoptosis, BAX and BAK are activated and aggregated and inserted on the mitochondrial outer membrane (MOM), undergo conformational rearrangement, oligomerize to form pores, and release pro-apoptotic factors such as cytochrome C and SMAC/DIABLO, etc., thereby initiating the apoptotic program. Then in 2001, Cookson et al. first proposed the definition of pyroptosis, which is described as pro-inflammatory PCD. The main morphological manifestations were DNA breakage, cell swelling, cell membrane pore formation, and release of cell contents (Table 1). During pyroptosis, gasdermin D (GSDMD) or GSDME is activated by caspase-1/4/5/11 or caspase-3 after cleavage, oligomerization and inserts into the cell membrane to form pyroptotic pores, leading to cell swelling and rupture. Afterward, in 2005, the necroptosis term was first proposed by Degterev et al.. Its main features include cell membrane rupture, autophagosome formation, and significant organelle swelling. RIPK1, RIPK3, and MLKL are key molecules in the process of necroptosis. Researchers found that p-MLKL has the potential to create pores in the plasma membrane resulting in membrane rupture. Ferroptosis as a novel cell death mode was first proposed in 2012 by Dixon et al.. The morphological characteristics were cell membrane rupture, increased density, and decreased volume of the mitochondrial membrane.
3. Introduction to AFM structure, principle, and working modes
3.1 AFM structure and principle
AFM was invented by physicist Binnig et al. in 1986. The invention of AFM overcomes the shortcomings of STM in measuring nonconducting samples and expands the detection from conductors and semiconductors to insulators. In addition, AFM has a wide range of applications compared to other microscopes, including working in liquid environments (PBS) as well as soft samples (living cells), combining topographic imaging with force spectroscopy and nanomechanics (Table 2). AFM mainly consists of the following systems: a laser system for laser generation, a head detection system consisting of a cantilever and a very sharp tip at its end, a laser detection system that receives laser reflection, and a feedback system that processes and transmits feedback signals to the piezoelectric scanner. The working principle of AFM is shown in Figure 1a. When the tip of the probe begin to scan the sample, the weak interaction force (mechanical contact force, van der Waals force, electrostatic force, etc.) between the probe tip and the sample causes the cantilever to swing. The deformation signal is converted into a photoelectric signal and amplified, and the signal of the interaction force between atoms can be obtained. Among them, the interaction force between the tip and the sample is related to the distance between them, which can be simply divided into attractive force and repulsive force, as shown in Figure 1b.
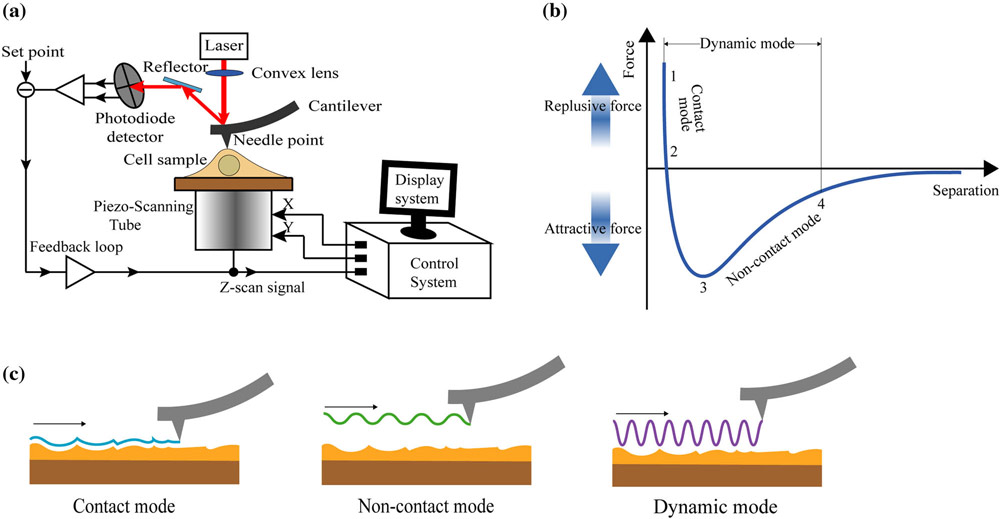
AFM. (a) Schematic diagram of AFM operation. (b) Force–distance curve by AFM. (c) Three working modes are commonly used in AFM.
3.2 AFM working modes
AFM provides three commonly used working modes, namely contact mode, non-contact mode, and dynamic mode (originally called tapping or oscillation mode), as shown in Figure 1c. In the contact mode, the sample and the tip are always in contact (corresponding to segments 1–2 in Figure 1b). In this mode, high-resolution images can be obtained due to the close proximity of the sample to the tip. But also because of this, too close distance may cause contamination and damage to the tip, and the friction force of the tip to the sample will also cause damage to the sample and affect the quality of imaging. Therefore, when applying it to softer biological samples, it is necessary to adjust the force applied to the tip, generally avoiding more than 100 pN, as excessive force may lead to reversible or even irreversible deformation. In the non-contact mode, the microcantilever vibrates near the sample surface (corresponding to segments 3–4 in Figure 1b). In this mode, the tip is not in direct contact with the sample, which makes up for the problems of sample damage and tip contamination in the contact mode. However, compared with the contact mode, the non-contact mode has a lower resolution and is unsuitable for imaging in liquid environments. In the dynamic mode, the cantilever oscillates with a larger amplitude (greater than 20 nm) near the resonance frequency during the scanning process (corresponding to segments 1–4 in Figure 1b). This mode minimizes friction and shear forces between the tip and the sample while maintaining a resolution that is essentially the same as the contact mode. In summary, the dynamic mode is suitable for objects that are more flexible and more brittle and only weakly adsorb to supports, such as DNA, proteins, and fibrils of Tau.
4. Use AFM to detect the dynamic changes of morphological and mechanical properties of different cell death modes
Some caution should be taken into account to reduce the invasiveness degree toward the delicate biological cell samples during AFM technique. The first is sample preparation. In living cells, the position change of the sample caused by the lateral force applied by the AFM probe during scanning imaging should be avoided. For adherent cells, because they can be naturally attached to the substrate (such as Petri dishes, cover slides), they can be directly imaged after adherent. The substrate surface can also be covered with a layer of polylysine to increase the adhesion effect. For suspension cells, appropriate fixation methods (such as electrostatic adsorption and microporous membrane filtration) are needed to adsorb them to the substrate and then image them. The second is the choice of probe. Probe quality and probe parameters will directly affect the final result. Because of its small contact area with the cell, the pyramidal probe can capture the details of the geometric properties of the cell surface and is often used for cell surface topography scanning. The micrometer-sized spherical probe is often used to measure the more holistic mechanical properties of cells because of their stable contact.
4.1 AFM exploring the morphological characteristics of apoptotic cells
Human understanding of cell death has gone through a long process. Prior to the advent of cell staining and microscopy, early studies of cell death largely focused on morphological observations with the naked eye. So far, morphological observation is still one of the important basis for judging different cell death modes. And different death modes show different morphological characteristics. Currently, cell morphology is mainly observed by optical microscopy (OM), transmission electron microscopy (TEM), and scanning electron microscopy (SEM), but these methods all have certain limitations (Table 2). For example, conventional OM suffers from a resolution limit of 200 nm, making it impossible to reveal the nanostructure of cells. Second, the essential advantage of AFM over TEM/SEM is the ability to measure the biophysical properties of biological samples under physiological conditions. In recent years, with the development of microscopy technology, AFM has been gradually applied to the morphological observation of different cell death modes. According to the obtained 2D and 3D topological maps of cells, relevant information such as cell volume, cell height, cell membrane surface roughness, and cell membrane pore formation can be clearly collected, which provides a strong support for further understanding the morphological characteristics of specific cell death modes.
AFM has been used to observe the morphological characteristics of different cell death modes, but existing studies have mainly focused on apoptosis. Previous studies have shown that reduction in cell volume is a prerequisite for the early stages of apoptosis. In 2005, Hessler et al. used AFM to observe early morphological changes in human oral epidermoid carcinoma cells (KB cells) apoptosis induced by staurosporine (STS). The images were obtained using the contact mode by silicon nitride cantilevers MSCT-AUNM (cantilever C) at the spring constant of about 0.01 N m−1. AFM data showed a 50% reduction in total cell volume and a 32% reduction in total cell height, and the reduction in apoptotic cell volume preceded other key hallmarks of apoptosis, such as loss of mitochondrial membrane potential. Researches also indicated that there was a significant change in cell volume during the initial stage of apoptosis. Cells are generally in the range of an AFM scan, but even the same cell type can vary by up to a few micrometers. Therefore, there are many difficulties that need to be overcome in using changes in cell volume as a marker of early apoptosis. However, it is much more convenient to observe the surface characteristics of the membrane. Moreover, the variation of cell membrane surface roughness is an indication of early apoptosis. AFM morphological imaging allows the extraction of 3D topology-related data of cells, which enables analysis of cell membrane surface roughness. Therefore, to identify apoptosis at an early stage, in 2011, Wang et al. employed AFM to observe changes in the membrane surface roughness of hydrogen peroxide (H2O2)-induced apoptosis in the mouse macrophage cell line RAW264.7. Results showed that the mean roughness increased between 24 and 60 nm with increasing H2O2 concentration. It is worth noting that, although under normal circumstances, with the occurrence of apoptosis, the surface roughness of the cell membrane shows an increasing trend. However, there are some exceptions. For example, when Cai et al. used AFM to observe the apoptotic K562 cells induced by peripheral lymphocytes. The UL20B cantilever whose length, width, and thickness are 115, 30, and 3.5 μm, respectively, was chosen in the contact mode. The oscillation frequency is 255 kHz and the force constant is 0.01 N m−1. And they found that after co-culturing these two type cells, K562 cells showed typical characteristics of apoptosis, but the cell surface roughness was significantly reduced. Furthermore, the formation of cell membrane pores is one of the sources of cell surface roughness, and as the pores become deeper, the cell surface becomes rougher. Therefore, to better describe the morphological characteristics of apoptosis, cell membrane pores are usually observed and analyzed. These studies further reveal morphological changes during apoptosis and deepen our understanding of cell death.
4.2 Advances in AFM measurement of mechanical properties during cell death
Likewise, cell mechanics can be used to describe the state of a cell, where certain changes in mechanical properties occur during cell death. AFM has been shown to be a powerful non-destructive nanotechnology that can be used to obtain dynamic processes related to cellular mechanics, such as elasticity and adhesion. Studies have shown that apoptosis may be associated with changes in cell elasticity. In addition, the adhesion of cell membranes plays a very important role in cell physiology and pathological processes. Hu et al. used AFM measurement and calculated by Hertz model to obtain the Young’s moduli of lymphocytes in three states of resting, activated, and apoptotic, which were 11.2 ± 5.9, 19.7 ± 4.0, and 7.1 ± 4.1 kPa, respectively, indicating that the Young’s modulus of apoptotic cells was significantly reduced. The high values of the Young’s modulus of elasticity reported in this article may be due to the limitations of experimental conditions, such as force profiles measured in air, where humidity, temperature, cell dehydration, or cell drying can have a dramatic effect on the results. For example, in 2014, Jin et al. showed the damaged effect of sodium nitroprusside (SNP) on cell surface adhesion (30% reduction) and elasticity (90% reduction) at the nano level in apoptotic chondrocytes. In this study, the force spectrum experiment was performed at the force loading rate is 1.2 × 10⁵ pN s−1. The mechanical properties of cells have gradually become an important characteristic to distinguish healthy cells from dead cells. Meanwhile, due to the extremely high mechanical resolution of AFM, AFM single-molecule force spectroscopy technology (AFM-SMFS) developed in AFM technology has gradually become an effective tool to measure the intra- and inter-cellular interactions of biological macromolecules at the single-cell level. Future AFM holds great potential for the mechanistic measurement of different cell death modes.
4.3 Use AFM to study the relationship between cell death and cytoskeleton
In the process of studying cell mechanics, the study of the cytoskeleton is an essential part. The cytoskeleton is important for maintaining cell mechanical properties, and cytoskeleton remodeling plays an important role in the process of apoptosis. Importantly, it has been shown that changes in cellular elasticity are inextricably linked to the components of the cytoskeleton in addition to the intrinsic properties of the cell membrane. Actin filaments and microtubules, two major components of the cytoskeleton, are severely damaged in structure, organization, and function, leading to cell death. For example, Jin et al. studied the cytoskeleton of SNP-induced chondrocyte apoptosis, and after SNP treatment, the F-actin and α-tubulin cytoskeleton of chondrocytes reorganized and polymerized. In addition, other researchers have continued to explore how the composition of the cytoskeleton affects cell elasticity. Rotsch and Radmacher found drugs that depolymerized actin filaments could significantly reduce the elastic modulus of cells, while drugs that stabilized microtubules had no significant effect on cell elasticity, suggesting that the actin network primarily determines the elastic properties of living cells. To learn more about the effects of how microtubules and actin filaments affect cytoskeletal mechanical properties during apoptosis. Pelling et al. indicated that cell structure was highly dynamic during the early stages of apoptosis, with F-actin in actin filaments controlling the cell’s initial elastic response, while microtubules appear to control the cell’s viscous relaxation for extended periods. Due to the limitations of AFM imaging, the most common way to monitor cytoskeletal changes is to combine AFM with confocal microscopy to study the dynamic changes of actin filaments and microtubules. However, the study by Henderson et al. showed that AFM could directly image actin filaments in living cells and observe the dynamic changes of actin filaments. Although researchers have a preliminary understanding of the role of the cytoskeleton in maintaining the mechanical properties of cells, the relationship between the cytoskeleton and cell death remains to be further explored.
4.4 Potential of AFM to distinguish different cell death modes
With the development of AFM technology year by year, studies using AFM to observe various cell death modes have emerged in recent years. Meeren et al. tested the differences in morphological and mechanical properties between three different PCD modes: intrinsic and extrinsic apoptosis, necroptosis, and ferroptosis in mouse tumor cell lines (L929sAhFas cell line). In morphological measurements, the resulting topographic image was obtained using the ATEC-CONT cantilever in a JPK QI® mode using the selected AFM nanowizard 4™ (JPK GmbH Instruments/Bruker). In cell elasticity measurements, all force curves were obtained in a contact mode using a colloidal probe containing a spherical tip of 5 μm diameter (CP-qp-SCONT-BSG, force constant 0.1 N m−1) and using a setpoint of 2 nN at 2 µm s−1. During intrinsic apoptosis, cells shrink and irregular structures are formed (Figure 2a, middle left). During extrinsic apoptosis, cell shrinkage was increased with concomitant apoptotic body generation (Figure 3a, middle right). During necroptosis, cells did not shrink but detached and swelled, and pores of different sizes were formed in the cell membrane (Figure 2b, middle). During ferroptosis, circular protrusions of 1–5 μm were observed to form on the cell membrane surface (Figure 2c, middle). In addition, the data showed that as the cell death process progressed, the cell surface roughness of these three cell death modes increased significantly. And the smallest increase is necroptosis. Overall, the AFM data clearly showed morphological characteristics in different cell death modes. Second, Meeren et al. also used AFM to measure the elasticity of multiple cells in these three PCDs. In the process of intrinsic apoptosis, Young’s modulus decreased rapidly 15 min after induction (Figure 2a, bottom left) and remained basically stable after the decrease. In contrast, for extrinsic apoptosis, Young’s modulus showed a trend of first increasing and then rapidly decreasing 60 min after induction (Figure 2a, bottom right). For both necroptosis and ferroptosis, Young’s modulus showed a continuous decreasing trend (Figure 2b and c, bottom). When comparing the Young’s modulus of these three cell death modes, it was found that the Young’s modulus of apoptosis (intrinsic and extrinsic apoptosis) decreased more rapidly compared with necroptosis and ferroptosis. Therefore, using AFM to study different cell death modes will help us to more clearly understand the dynamic changes of morphological and mechanical properties in the process of cell death.
Figure 2
Schematic diagram of different cell death modes morphology (top), AFM imaging 3D topology (middle), and Young’s modulus (bottom). (a) Apoptosis, including intrinsic apoptosis and extrinsic apoptosis; (b) necroptosis; and (c) ferroptosis. The AFM imaging 3D topology (middle) and Young’s modulus (bottom) are reprinted, with permission.

Figure 3
MAC, BAX, BAK, and perforin pore morphological characteristics detected by AFM scanning. AFM imaging 3D topography of the MAC, BAK, BAX, and perforin pore (top of each image). The MAC, BAX, BAK, and perforin molecules around the pore protrude around the membrane plane, as confirmed by the height cross-sections below each image (corresponding to the gray dashed line in the AFM image) (bottom of each image). (a) Open access source, under Creative Commons license. (b) Reprinted, with permission. (c) Open access source, under Creative Commons license, from. (d) Reprinted, with permission, from.
5. AFM visualizes membrane pores in different cell death
A membrane pore can be defined as any local membrane perturbation that allows passive flow of molecules. Different types of pores formation in the membrane may lead to different types of cell death. For example, after induction of apoptosis, BAX and BAK will aggregate into pores in the mitochondrial membrane, release pro-apoptotic factors, and start the apoptosis process. In addition, during apoptosis, perforin (PFR) released by T/NK cells can also form pores in the cell membrane. Similarly, the gasdermin family (such as GSDMD or GSDME), the ultimate executor of pyroptosis, induces the occurrence of pyroptosis by punching holes in the cell membrane. MLKL is the only known effector molecule associated with necroptosis. Available data suggest that p-MLKL has the potential to create pores in the plasma membrane resulting in membrane rupture. Unfortunately, we are not yet able to understand the structure and topology of MLKL in the cell membrane. In addition, the membrane attack complex (MAC), a terminal pathway common to the three complement activation pathways, can also be assembled by soluble monomeric proteins and form killer transmembrane pores that mediate cell death. AFM has successfully imaged the morphology of membrane attack complex structures on the cell membrane (Figure 3a). Similarly, in the past experiments, SEM, TEM, and other microscopes were mostly used to observe the formed membrane pores. However, because of the harsh imaging environment, it is usually difficult to observe clear membrane pore images and the shape of the formed oligomers. In contrast, AFM, as a microscope that allows the acquisition of native membrane images at sub-molecular resolution, enables a clearer observation of the dynamic assembly process of transmembrane pores. Therefore, we broadly review relevant studies on the dynamic visualization of membrane pore formation mediated by various molecules by AFM. These studies reveal real-time morphology during pore formation and greatly advance our understanding of pore formation-mediated cell death.
5.1 AFM visualization of BAX/BAK and PFR-mediated apoptosis pore formation
BAX and BAK are pro-apoptotic members of the BCL-2 family required for mitochondrial outer membrane permeability (MOMP) and play a key role in apoptosis. Under normal conditions, BAX and BAK are present in healthy cells in inactive forms. After receiving an apoptotic signal, they are activated and oligomerically inserted into the MOM, which is accompanied by an increase in MOMP, and then BAX and BAK form giant pores. However, the mechanism of how BAX and BAK aggregate and form apoptotic pores is still not fully understood. A recent study showed that AFM analysis of supported lipid bilayers (SLBs) prepared from proteoliposomes containing activated BAX monomers revealed that BAX formed linear, arc-shaped, and ring-shaped in SLBs of varying sizes and shapes. In other words, AFM can observe the formation of membrane pores associated with this protein (Figure 3b), which are not uniform in size and shape but are generally circular with diameters between 24 and 176 nm. In the same way, Cosentino et al. observed the structure formed by BAK in SLBs and compared it with the pores formed by BAX. BAK also formed straight lines, arcs, and ring structures in SLBs (Figure 3c), but the pores formed by BAK were smaller and more uniform, and the rings had an average pore radius of about 8.12 nm.
As a pore-forming protein, PFR can form oligomeric pores in target cell membranes, which allow the entry of pro-apoptotic granzymes, thereby causing apoptosis of target cells. Leung et al. visualized the PFR nanopore assembly in real time, where PFR first forms loosely but irreversibly bound, short prepore oligomers on target cell membranes. These short oligomers, after insertion into the membrane, recruit additional prepore oligomers, facilitating further assembly to form larger arc- and ring-shaped transmembrane pores (Figure 3d).
5.2 AFM visualization of gasdermin family protein-mediated pyroptosis pore formation
Gasdermin family proteins, as the final executors of pyroptosis, consist of six members in humans, namely GSDMA, GSDMB, GSDMC, GSDMD, GSDME (DFNA5), and PJVK (DFNB59). Among them, GSDMD, as one of the earliest discovered, most widely studied, and most in-depth members of the gasdermin family, can be activated and cleaved by caspase 1/4/5/11 to form N-GSDMD and C-GSDMD. N-GSDMD acts directly on the cell membrane, forming pores in the membrane and triggering pyroptosis. However, how the N-GSDMD domain assembles the pores and the mechanism of penetrating the plasma membrane remains poorly understood. To address this issue, Mulvihil et al. applied high-resolution and time-lapse AFM to directly image the pore-forming process of N-GSDMD on supported lipid membranes (SLMs). Results showed that N-GSDMD released from GSDMD cleavage by caspase-1 can assemble into slit-, ring- and few arc-shaped oligomers (Figure 4a). And each oligomer structure occasionally forms transmembrane pores penetrating the SLMs. The structure height of slit- and ring-shaped oligomers protruding from the SLM is about 3.6 nm, indicating that they are almost completely inserted into the membrane. The analytical data also showed that the diameters of the ring-shaped oligomers were widely distributed between 13.5 and 33.5 nm, with an average value of approximately 22.6 nm. These findings are consistent with the study by Sborgi et al. that N-GSDMD binds to lipid membranes and forms arc-, slit-, and ring-shaped oligomers, and the formed arcs and slits may fuse into ring-shaped N-GSDMD oligomers of variable diameter with an average value of 21 nm. On the basis of AFM imaging, it can be speculated that the pathway for N-GSDMD to form pores is roughly as shown in Figure 4b. Furthermore, it is necessary to explore whether the pore-forming activity of GSDMD-N is also present in other gasdermin family members. Mari et al. characterized the pore-forming activity of mouse GSDMA3 by high-resolution time-lapse AFM. It was found that GSDMA3 oligomers assemble on the SLMs and remain in a mobile or attached state. And once inserted into the membrane, it oligomerizes to form arc-, slit-, and ring-shaped oligomers, each of which also forms transmembrane pores, the pathway of N-GSDMA3 to form pores is shown in Figure 4b. In addition, Liu et al. visualized the pore-forming process of GSDME on the cell membrane by AFM. Overall, these studies collectively suggest that the gasdermin family proteins are the direct and ultimate executor of pyroptosis. The high-resolution information of the pyroptotic pores shows the unique value of AFM in the study of pyroptosis.
Figure 4
GSDMD/A3 pore formation diagram. (a) AFM images of arc-, slit-, and ring-formed by N-GSDMD/A3 and (b) model of N-GSDMD/A3 oligomerization and pore formation. (a) (Top) Reprinted, with permission and (a) (bottom) open access source, under Creative Commons license.
5.3 Problems with AFM visualization of membrane pores
To date, AFM has made great progress in visualizing membrane pore formation, but most studies have imaged pores on artificial liposomes or SLMs, and only a few studies have imaged membrane pores on real living cells. This could be due to the strict requirements of high-resolution imaging (nanoscale) and sample preparation problems, imaging in real cell membrane pores is difficult and complicated. Because cell membranes are mainly composed of membrane proteins and phospholipids. Artificial lipid bilayers model (artificial membranes) can simulate cell membranes and keep their function intact. Therefore, the artificial membranes are good alternative to cell membranes. It provides a lot of information about the morphology and properties of a phospholipid bilayer. However, there are still some limitations in the use of artificial liposomes and SLMs for pore visualization, including the lack of a membrane protein-intrinsic cytoskeleton, leading to possible discrepancies among pores in liposomes and SLMs and the actual cell membrane, generating possible errors in observing the dynamics of pore formation. For example, related studies have shown that in real cells, PFR-induced pore size is about 200 nm, much larger than that detected from SLMs (about 10–20 nm). In addition, the size of pores formed by GSDMD proteins in real cell membranes and SLMs is also inconsistent. Therefore, the results obtained using artificial liposomes and SLMs as research subjects may not reflect the relationship between cell membrane pore formation and cell death. To make a better connection between the formation of membrane pores and cell death, the study of real cell membrane pore formation using AFM should be accelerated. However, there is another problem with the visualization of membrane pores by AFM. Although studies are comparing the membrane pores depth with the cytoplasmic membrane thickness to confirm that the membrane pores imaged by AFM are real cell membrane pores and not from membrane depression or folds. We still do not know how to exclude that only hollows were formed as the AFM tip cannot probe the inner part of the cell nor the underneath part of a supported lipid layer.
6. Study of cell death-related molecules using AFM-SMFS
The reasons for different cell death modes are not the same, it has been described above that the changes in morphological and mechanical properties of different cell death modes induced by different substances can be directly detected by AFM. However, as with other imaging techniques, we cannot obtain quantitative information on intermolecular or intramolecular interactions from AFM images, which also leads us to be unable to fully determine that cell death is induced by a specific substance. And the single-molecule force spectroscopy technique of atomic force microscopy (AFM-SMFS) is a good solution to this problem. Since this technique requires tip-sample interaction, we can achieve this by functionalizing the AFM tip with particular chemical groups/ligands/antibodies. The main methods for attaching specific molecules to the AFM tip include physical adsorption, specific interaction, and chemical coupling (silanization, covalent coupling). In the experimental process, according to the nature of the sample, different connection methods can be used. After functionalization, AFM-SMFS allows the measurement of the adhesion and mechanical strength of specific bonds formed between the tip and individual sample molecules. Therefore, AFM can not only be used for imaging but has also become an indispensable measurement tool for studying biological macromolecular interactions.
The rapid development of AFM-SMFS has made it successfully applied to the analysis of single-molecule mechanical properties and intermolecular interactions, including DNA melting and dynamic structural changes, the dissociation mechanisms of DNA duplex, protein folding and unfolding, and interactions between biological macromolecules (protein–protein interaction, protein–nucleic acid interaction, protein–ligand interaction, etc.). However, past studies have typically used only one biomolecule to functionalize the AFM tip when applying single-molecule force spectroscopy, but Pfreundschuh et al. further developed this technique. Pfreundschuh et al. functionalized the AFM tip with two different ligands to map the two binding sites of human G protein-coupled receptors. It can be seen that AFM-SMFS has great prospects in the field of biological research. Therefore, in recent years, AFM-SMFS has also been gradually applied in the field of cell death. pf-80 is an anti-PFR monoclonal antibody that recognizes PFR epitopes without interfering with plasma membrane binding of PFR. In studying PFR-induced apoptosis in bulk tumor cells and tumor-repopulating cells (TRC, low flexibility prevents membrane pore formation caused by PFR released by cytotoxic T cells), they attached pf-80 to the AFM tip and examined the adhesion between pf-80 and PFR (Figure 5a, left). The results showed that in bulk tumor cells, the adhesion between pf-80 and PFR was very high. But in TRC cells, the adhesion between pf-80 and PFR was very low, which may be due to the decreased expression of MYH9 (a motor protein that interacts with PFR) in TRC, which has the function of cross-linking and hardening F-actin. Its reduced expression may lead to a decrease in the interaction force between stable pf-80 and PFR, which ultimately leads to less adhesion between pf-80 and PFR in TRC cells. Epidermal growth factor receptor (EGFR) is a cell transmembrane protein whose overexpression is common in many cancers, which can be activated by binding to epidermal growth factor (EGF). In other words, low expression of EGFR can induce tumor cell death. Resveratrol, as an anti-tumor drug, can inhibit the activity of EGFR, thereby inducing tumor cell death. Zhang et al. used EGF-functionalized AFM probes to study the cell surface EGFR expression changes after treatment with different resveratrol concentrations (Figure 5a, right). The results showed that there was no significant change in the unbinding force of the low-dose resveratrol-treated group (up to 20 μg ml−1) compared with the untreated group. However, when cells were treated with 40 μg ml−1 resveratrol, the unbinding force was significantly reduced. Furthermore, they also demonstrated that when EGF (100 mg ml−1) is added gently to untreated MCF-7 cells, the interaction forces between EGF and EGFR were specifically blocked (Figure 5b). Thus, can we apply a similar idea to other cell death processes (Gasdermin family-mediated pyroptosis, MLKL protein-mediated necroptosis) using single-molecule force spectroscopy? This will help us to understand the dynamic changes and mechanisms of single molecules in the process of inducing cell death.
Figure 5
The specific recognition and detection of the molecule related to cell death by single-molecule force spectroscopy technique of atomic force microscopy (AFM-SMFS). (a) Schematic diagram of measuring the interaction between perforin and its monoclonal antibody pf-80, epidermal growth factor (EGF) and its receptor EGFR on the cell membrane by AFM-SMFS technology. (b) Typical force curve of EGF and EGFR interaction with specific unbinding peaks on cancer cells.
7. Discussion and further perspective
Clearly, AFM has emerged as a powerful imaging tool capable of imaging biological systems at high resolution (nanoscale). AFM topography can be used to characterize the morphological characteristics of different cell death modes. Analysis of cell biomechanical properties can detect the early onset of cell death and the dynamic changes in mechanical properties during death, thereby distinguishing different cell death modes. Notably, AFM is currently the only force measurement technique that can map the nanoscale lateral distribution of individual molecular recognition sites on biological surfaces, which is beyond the reach of traditional biochemical methods. And in recent years, great progress has been made in enhancing the function of AFM, including the development of different AFMs such as multiparametric AFM (MP-AFM), molecular recognition AFM (MR-AFM), multifrequency AFM (MF-AFM), high-speed AFM (HS-AFM), and fluidic force microscopy (FluidFM). At the same time, to better image and identify the complex structure of some biological systems, AFM can also be combined with other complementary techniques, including OM, fluorescence microscopy, confocal microscopy, super-resolution microscopy, etc. The most commonly used combination of AFM is fluorescence microscopy or confocal microscopy. For example, in addressing the limitations of AFM imaging on the cell surface, a study combined AFM with confocal microscopy to directly penetrate the cell membrane and localize to the nucleus through the AFM tip to measure the elasticity of the nucleus. Obviously, this has become a hot spot of current AFM research and a trend of future AFM development. The combination and development of these technologies and functions have greatly enhanced the roles of traditional AFM, but the application of AFM still faces some challenges.
First, how to further improve the spatiotemporal resolution of AFM. At present, conventional AFM is only used to take static snapshots or very slow dynamic processes, because it takes up several minutes to acquire an image of each sample, which is far more than the time required for normal cellular physiological activities. Although high-speed atomic force microscopes with high temporal resolution in the subsecond range have been developed in recent years. However, due to the limitations of its high-speed imaging, this technique is currently only used for imaging small and relatively flat biological samples, such as single proteins and DNA molecules. But, for some large biological systems, the spatial resolution of AFM imaging becomes another challenge. For example, the resolution of current AFM imaging of mammalian cells is limited to 50–100 nm, which makes it impossible to observe the individual components of cell-surface machinery. The imaging resolution of microbial cells is slightly higher, but only about 10 nm. So, next, we should consider how AFM can maintain its high temporal resolution and high spatial resolution at the same time when imaging different biological samples.
Second, AFM is low throughput and labor intensive. Current AFM experiments are manual rather than automated. Meanwhile, the traditional AFM takes several minutes or even longer to process one sample, and the next one can only be processed after one sample is processed, which makes the entire operation very time-consuming and labor-intensive. In addition, when measuring the mechanical property changes during cell death based on the force-distance curve, it is usually necessary to measure and analyze thousands of force curves, which will undoubtedly further increase the time and labor consumption. In response to this problem, Chopinet et al. provide a novel modality called quantitative imaging™ (QI™), which overcomes the data processing problems associated with acquiring thousands of force curves. However, since this model has not yet been popularized, further researches are needed on related issues. Furthermore, the technical requirements for operators during AFM operation are very strict, especially for dynamic monitoring of living cells, which requires operators to have rich experience and good patience. Therefore, it is imminent to study the AFM of automated operation and simplified operation of data processing systems.
Finally, AFM does not need to be marked to be a double-edged sword. AFM does not need to mark the sample when observing the sample, which is one of the advantages of AFM. However, as the research system becomes more complex, this will turn into a weakness of AFM. For example, many proteins do not exhibit distinct morphologies, which are difficult to distinguish using AFM. Although the existing technology has been able to functionalize the AFM probe, using the tip with specific molecular modification to specifically recognize the sample molecule. However, this technique is complicated and time-consuming in the molecular modification process, the experimental process is difficult to standardize, and the damage to the tip is unavoidable. Therefore, further development of techniques that allow molecular-specific recognition by AFM is critical for imaging complex biological systems.
Generally speaking, the powerful functions exhibited by AFM make its research prospects in cell death immeasurable. However, as mentioned above, AFM still has many deficiencies in studying the physiological process of cells. Although some novel AFMs have been developed under the joint efforts of experts in multidisciplinary fields, the underlying problems remain unsolved. We expect a new and more powerful AFM that integrates multi-mode, multi-parameter, multi-frequency, and high-speed modes in the future. Coupled with the advancement of various complementary technologies, this will allow us to more clearly explore the unsolved problems of the cell death process and the entire field of biology.
Methods for making and observing model lipid droplets
Sonali A. Gandhi, Shahnaz Parveen, Munirah Alduhailan, Ramesh Tripathi, Nasser Junedi, Mohammad Saqallah, Matthew A. Sanders, Peter M. Hoffmann, Katherine Truex, James G. Granneman, Christopher V. Kelly
Cell Reports Methods, Volume 4, ISSUE 5, 100774, May 20, 2024
doi: https://doi.org/10.1016/j.crmeth.2024.100774
Highlights
Methods for making model lipid droplets (LDs) that mimic natural droplet biophysics
Model LDs include buoyant droplets, droplet-embedded vesicles, and surface-adhered caps
Optical measurements reveal binding, diffusion, sorting, and tension
A custom tensiometer and scanning probe spectroscopy provide cross-validation
Motivation
The mechanisms by which the lipid droplet (LD) membrane is remodeled in concert with the activation of lipolysis incorporate a complex interplay of proteins, phospholipids, and neutral lipids. However, the interconnected biophysical properties that guide complex biological processes are challenging to measure in living samples. Model LDs provide an isolated, purified system for testing how droplet composition, size, shape, and tension affect triglyceride metabolism. We present sample creation and observation methods that enable the detailed dissection of the intertwined phenomena governing LD biology.
Summary
We present methods for making and testing the membrane biophysics of model lipid droplets (LDs). Methods are described for imaging LDs ranging in size from 0.1 to 40 μm in diameter with high-resolution microscopy and spectroscopy. With known LD compositions, membrane binding, sorting, diffusion, and tension were measured via fluorescence correlation spectroscopy (FCS), fluorescence recovery after photobleaching (FRAP), fluorescence lifetime imaging microscopy (FLIM), atomic force microscopy (AFM), and imaging flow cytometry. Additionally, a custom, small-volume pendant droplet tensiometer is described and used to measure the association of phospholipids to the LD surface. These complementary, cross-validating methods of measuring LD membrane behavior reveal the interplay of biophysical processes on lipid droplet monolayers.
Graphical abstract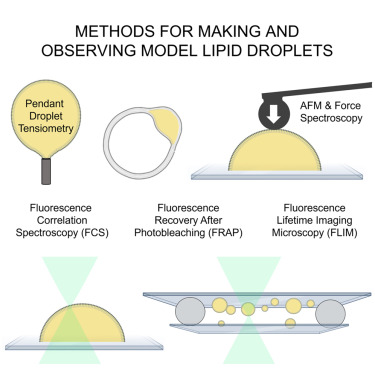
Introduction
Cellular homeostasis relies on maintaining a precise metabolic balance of sugars and lipids during consumption and fasting. The storage and utilization of oil-based energy, such as triacylglycerols (TAGs) and sterol esters, in lipid droplets (LDs) represent a nearly universal cellular mechanism for sustaining healthy free fatty acid levels.1,2,3 Most cells maintain LDs between 0.1 and 100 μm in diameter with an oily core enveloped by a monolayer of phospholipids and proteins.4,5,6 LDs form and grow within the endoplasmic reticulum (ER) bilayer, with proteins spontaneously sorting between the ER bilayer and the LD monolayer.7,8 In addition to maintaining energy balance, LDs play a crucial role in facilitating intracellular coordination among organelles9,10,11 and are engineered for pharmaceutical production and delivery.12,13
Cells carefully regulate their LD composition, size, and number, yet the molecular and biophysical mechanisms of LD nucleation and growth remain unknown. Factors such as LD membrane curvature and tension affect the LD’s budding directionality and fission from the ER.14,15 Still, the significance of variables like LD composition, neutral lipid production rates, and LD-nucleating proteins remains unresolved. Intracellular trafficking balances protein concentrations on the LD monolayer, on membrane bilayers, and in the cytosol.16 Perilipin 5 (PLIN5) is an LD-targeting and LD-regulating protein with diverse roles in fatty acid storage and mitochondrial energy utilization.17 PLIN5 interacts dynamically with various lipid and protein binding partners, contingent upon the cellular metabolic state, which includes a ligand-dependent binding to α/β hydrolase domain-containing protein 5 (ABHD5, also known as CGI-58) that activates lipolysis.18,19 Protein crowding and competition for the limited LD monolayer area have been proposed as key determinants of the LD monolayer structure,20,21 with the specifics of the phospholipid composition, tension, and curvature likely influencing the metabolism of TAGs.22 Simplified model systems are needed for elucidating the underlying biophysical properties and molecular specificities that govern LD behavior.
Model LDs are created through a variety of means for distinct purposes. The binding of small phospholipid vesicles to TAG droplets forms a surrounding monolayer, but the saturation of the monolayer with phospholipids from small vesicles takes >20 min. An equilibrium may be reached faster by sonicating phospholipid-TAG mixtures to create phospholipid-coated, oil-filled LDs when the volume of the aqueous buffer exceeds the volume of the neutral lipid. The phospholipid-to-TAG ratio influences the final LD size, consistent with determining the surface area-to-volume ratio. However, monolayers are most robustly created when either the phospholipids are dissolved within the neutral lipid before its exposure to the aqueous buffer or neutral lipids are incorporated between the phospholipid leaflets of a bilayer. Giant unilamellar vesicles (GUVs) have been adapted to create droplet-embedded vesicles,22,23,24,25 and TAG has been incorporated between the leaflets of a supported lipid bilayer to resolve droplet coalescence.26,27 The buoyancy of oil-filled LDs in an aqueous buffer complicates the imaging of LDs with inverted microscopy. Modifying the LD composition28 or using confined imaging chambers addresses these challenges29 but with new difficulties introduced.
This manuscript reports on methods for fabricating and measuring biophysical processes on model LDs. We measured (1) the binding and competition of phospholipids on the LD surface, (2) the diffusion of proteins, (3) the sorting of proteins between phospholipid monolayers and bilayers, and (4) LD tension changes upon changes to the membrane composition. We have identified and addressed the challenges of observing curved, buoyant LDs with conventional high-resolution inverted microscopy. Droplet-embedded vesicles enable the observation of protein sorting between phospholipid bilayers and phospholipid monolayers despite challenges in sample heterogeneity, high-resolution imaging, and quantitative analyses. By confining micron-sized LDs within microbead-supported glass microscopy chambers, the bottom of the buoyant LDs could be observed without refractive distortion by the curved LD surface or the disruptive proximity of a solid substrate; this method was used with fluorescence correlation spectroscopy (FCS) to measure the concentration-dependent diffusion of PLIN5 on LDs. With nanoscale LDs that diffused throughout the imaging buffer, fluorescence lifetime imaging microscopy (FLIM) was employed to measure the increase in phospholipid packing caused by PLIN5 binding to the LD membrane. Coverslip-bound LD caps enabled high-resolution imaging of LD membranes with short working distances and oil-immersion objectives while maintaining the accessibility and exchange of the surrounding aqueous buffer. Coverslip-bound LD caps were used to measure the membrane binding kinetics, protein diffusion with fluorescence recovery after photobleaching (FRAP), and droplet surface tension with atomic force microscopy (AFM). A custom, cost-effective pendant droplet tensiometer validated the tension measurements by AFM. The combination of methods reported here for making and observing LDs enables new experimental techniques to decipher the biophysical properties governing LD physiology.
Results
Droplet-embedded vesicles
TAG was incorporated between the phospholipid leaflets of a GUV bilayer to create droplet-embedded vesicles with optically distinct phospholipid monolayers and phospholipid bilayers (Figure 1). Bright-field microscopy showed a distinct index of refraction contrast from the GUV and the embedded LD (Figure 1B). Confocal fluorescence imaging enabled isolating different imaging planes, with the buoyant LD typically floating to the top of the GUV (Figures 1C–1F). The net buoyancy of the droplet-embedded vesicles depended on the volumes and densities of the aqueous buffer, the GUV interior, and the attached LD. The density of the GUV interior and the surrounding buffer was controlled via the salt composition present during GUV formation and subsequent dilution, respectively. Using large molecular weight solutes (i.e., sucrose) to fill the GUVs during their formation, the GUVs sank when mixed with physiological buffers.
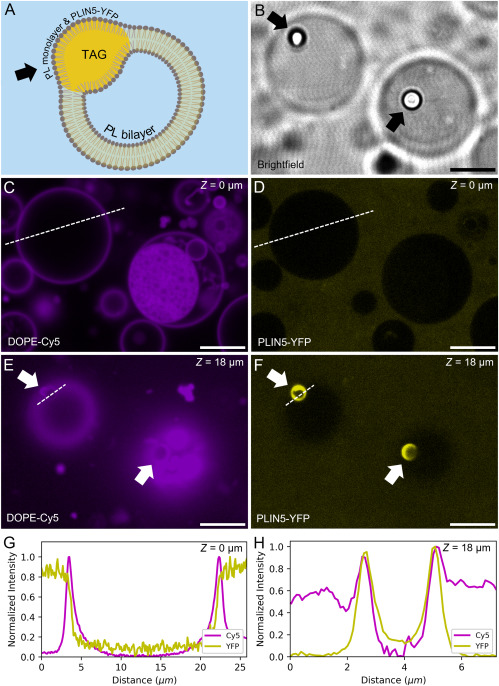
Figure.1 Droplet-embedded vesicles
Electroformation generated large GUVs, but heterogeneity within the sample included variation in the GUV sizes and nesting of vesicles within vesicles. When vesicles were within vesicles, it was difficult to ensure that only one bilayer contributed to the brightness of a given image pixel. Additionally, a membrane parallel to the microscopy focal plane (i.e., when focused on the top or bottom of the GUV) yielded dimmer pixel values than a perpendicular membrane (i.e., when focused on the equator of the GUV). The coupling of these effects complicated the quantification of protein sorting even when the phospholipid bilayer and the phospholipid bilayer were both visible in a single image. However, despite these challenges, the relative brightness of the membrane (i.e., DOPE-Cy5) and the proteins (i.e., PLIN5-YFP) was often able to demonstrate clear differences in protein density on the phospholipid monolayers versus the phospholipid bilayers.22,23,24,25
PLIN5-YFP demonstrated a strong preference to bind to phospholipid monolayers versus phospholipid bilayers (Figure 1). In the presence of 190 nM PLIN5-YFP, confocal imaging showed that PLIN5 was in the surrounding solution, no PLIN5 was inside the GUV, and no PLIN5 was bound to the GUV bilayer. However, PLIN5 was bound to and concentrated in the LD surface, as quantified in line scans of fluorescence intensities across the bilayers and monolayers. There was no increase in the PLIN5-YFP intensity correlated with the phospholipid bilayer when focused through the center of the GUV (Figure 1G); however, intense PLIN5-YFP emission was associated with the phospholipid when focused on the monolayer of the LD (Figure 1H). As a control experiment, droplet-embedded vesicles were similarly used to observe the membrane sorting of cholera toxin subunit B labeled with Alexa Fluor 647 (CTxB), ABHD4-mCherry, and ABHD5-mCherry (Figure S1). CTxB was bound to the monolayer and the bilayer, demonstrating no sorting between the LD and the GUV. Both ABHD4 and ABHD5 showed robust sorting to the phospholipid monolayer.
Spherical model LDs
Spherical oil-in-water and water-in-oil droplets were created through sonication and vortexing TAGs, phospholipids, and aqueous buffer mixtures. The successful creation of suspended droplets was initially apparent through the uniform cloudiness of the sample. Sonication created independent, suspended droplets more reliably than vortexing. However, a wide variability of sonication times was necessary depending on the specific bath sonicator used; between 10 s and 30 min was used. Excessive sonication or vortexing resulted in a creaming of the mixture that was apparent as an oil-rich phase separation that was white and highly viscous. Creaming reduced the number and quality of the suspended LDs available for further analysis.
The size of the oil-in-water droplets was affected by the ratio of TAGs to phospholipids; more TAGs resulted in larger volume droplets, whereas more phospholipids resulted in a larger droplet surface area. When the buffer volume exceeded the TAG volume, oil-in-water droplets were created. The oil-in-water droplets were readily diluted and mixed with varying aqueous reagents but may float out of the field of view of inverted microscopes. When the TAG volume exceeded the buffer volume, water-in-oil droplets were created. Water-in-oil droplets limit the ability to expose the monolayer to additional aqueous components or alter the monolayer composition. Storing droplets on a rotator allowed them to equilibrate with proteins added to the surrounding buffer and avoid coalescence before further analysis.
To address the buoyancy complication of oil-in-water droplets during imaging, we stabilized the LDs within a microscopy imaging chamber created by a coverslip and a glass slide that were separated by 20-μm-diameter microspheres (Figure 2A). The droplets floated to the glass slide and provided an unobstructed viewing of their bottom surface. Fluorescence imaging showed the monolayer of the LDs most brightly when focused on the droplet equator while the monolayer was extended into the microscope optical z axis (Figures 2B, 2C, and S2). By focusing on the bottom of the droplets, fluorescence excitation and emission could transmit to and from the droplet without distortions caused by transmission through a curved droplet surface; all other droplet viewing methods yielded significant aberrations caused by the inherent index of refraction contrast and the shape of the droplet.
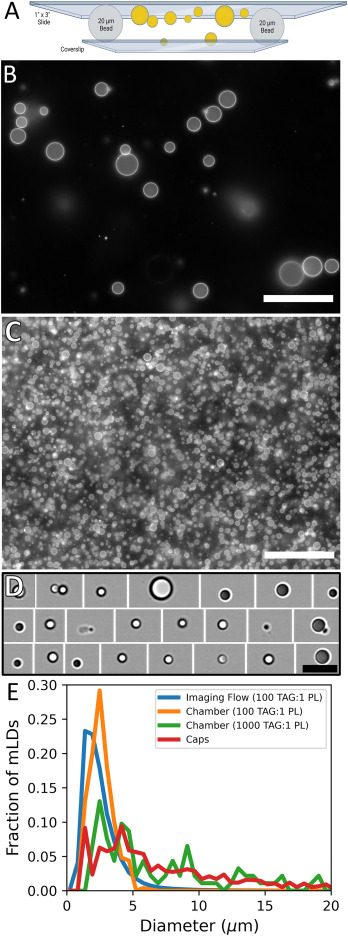
Figure.2 Buoyant oil-in-water LDs
Oil-in-water LDs were also analyzed via imaging flow cytometry (Figure 2D). The droplets were created by sonication and introduced into the cytometer through standard microtubing. The internal fluidics of the cytometer presented the droplets individually into the optical path for bright-field and fluorescence imaging. Images of over 100,000 droplets were acquired within 3 min and saved for offline analysis. Attempts to analyze LD shape changes and protein sorting with imaging flow cytometry were complicated by protein-induced aggregation of the LDs during the sample loading. Initial testing showed that smaller LDs bound together and were indistinguishable from larger LDs changing shape.
Surface-adhered LD caps
Although the glass microscopy chamber enabled the imaging of buoyant LDs with inverted, high-numerical-aperture objectives, it prohibited the addition or exchange of the surrounding buffer once sealed. This limitation prohibited the resolution of time-dependent compositional changes to the monolayer, such as directly monitoring the binding of phospholipids or proteins to the droplets. To overcome this, we developed coverslip-adhered LD caps for which TAG droplets were initially spread across the coverslip by a vigorous N2 stream without an aqueous buffer. 3 μL TAG was pipetted onto the center of a lightly cleaned glass-bottom Petri dish before a focused N2 stream that lightly aerosolized the TAG and dispersed it across the coverslip. Visual inspection of the coverslip could readily determine if the small droplets were made on the coverslip (Figure S3), after which an aqueous buffer was added to the dish (Figure 3).
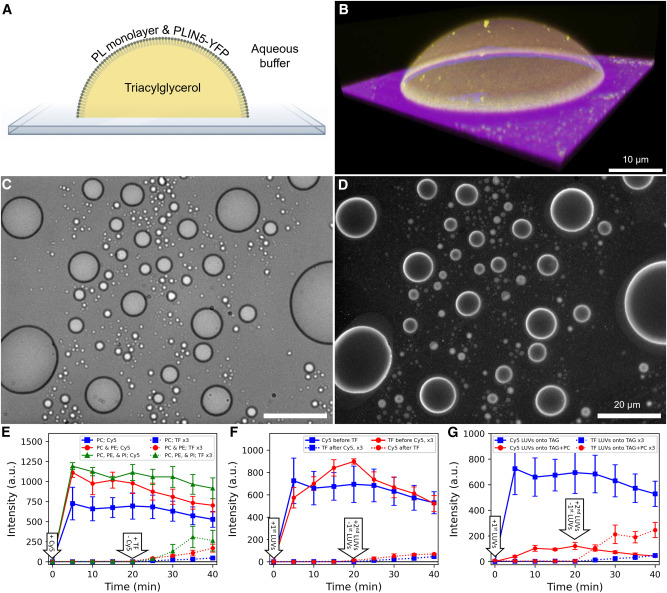
Figure.3 Model LD caps
Without phospholipids, a gentle buffer exchange resulted in a negligible change to the oil droplet shape for droplets smaller than 80 μm in diameter. In the presence of surfactants and the absence of flow, droplets larger than 40 μm in diameter lifted off the glass within 2 h. Droplets smaller than 40 μm in diameter were stably adhered to the coverslip, unperturbed by gentle buffer exchanges, and readily analyzed by long-duration optical or scanning probe methods.
The stability and contact angle of the droplet caps varied with the coverslip surface treatment before spreading the TAG. Creating a highly hydrophilic surface through harsh chemical or plasma cleaning methods resulted in minimal adherence of the TAG to the coverslip and poor droplet stability. Alternatively, insufficient cleaning of the coverslips yielded an overly lipophilic substrate such that the TAG spread on the substrate without coalescing into a hemispherical cap. The optimal coverslip cleaning method depended on the source of the coverslip. Typically, a 5-min submersion of the coverslip in a 1% solution of Micro-90 followed by thorough rinsing with deionized water yielded stable, hemispherical caps (Figure S3).
Buffer-covered LD caps could be readily imaged with confocal (Figure 3B), bright-field (Figure 3C), and epifluorescence imaging (Figure 3D). The coverslip adherence enabled their viewing with inverted microscopes and without concern of a limited objective working distance. Accordingly, the LD caps are an excellent model system with diverse fluorescence and scanning probe techniques, as described below.
Size distributions of LDs
LDs were generated with diameters ranging from less than 1 to over 40 μm, with a strong dependence on their TAG-to-phospholipid ratio (Figure 3E). The TAG-to-phospholipid ratio effectively set the volume-to-surface area ratio for the equilibrated LDs. During imaging within the microscopy chambers, the floating oil-in-water LDs were observed at different imaging focal planes depending on their size (Figure S2). The smallest droplets were observed at a higher focal plane and closer to the glass slide than the larger droplets. To determine the sizes of LDs in each sample, we selected a focal plane corresponding to the equator of most droplets (Figures 2B and 2C).
Imaging flow cytometry uses air objectives with low numerical apertures and deep depths of field compared to oil-immersion objectives. Image culling was based on image contrast and was used to save images of only the in-focus LDs. The images of the droplets were further culled based on the droplet size, shape, and number, as described in the STAR Methods. The lower numerical aperture of the imaging flow cytometer objective yielded lower image resolution and had difficulty distinguishing whether more than one LD had aggregated together. This complexity limited our ability to study LDs with proteins via imaging flow cytometry because the proteins caused the LDs to flocculate.
The LD caps provided the broadest range of droplet sizes for analysis. The available droplet sizes were affected by the substrate treatment, the intensity of the N2 fragmentation, the surface tension reduction caused by phospholipids, and disturbances caused by buffer exchanges. Droplet cap sizes varied across the coverslip due to the initial TAG location and the N2 stream direction (Figure S3). The caps provided the most consistent imaging of LDs of varying sizes because the widest parts of each droplet were visible at the same imaging plane—on the microscopy coverslip.
Phospholipid binding and exchange
The formation of the phospholipid monolayer on the LD caps was monitored by the increase in phospholipid monolayer fluorescence versus time (Figure 3E). Large unilamellar vesicles (LUVs) were created with varying fluorescent and non-fluorescent phospholipid compositions. The LUVs were added to the oil-on-glass caps at 0.4 mg/mL in an intracellular buffer, and epifluorescence images were taken every 5 min. To observe the monolayer brightness distinct from the unbound LUVs in solution, the unbound LUVs were rinsed away, images were taken, and the LUVs were added back. The first 20 min of LUV exposure occurred with Cy5-labeled LUVs, and monolayer brightness was apparently saturated within 5 min. To test the exchange or addition of phospholipid to the monolayer after 20 min, the Cy5 LUVs were removed, and DOPE-TopFluor488 (TF)-labeled LUVs were added. The non-fluorescent phospholipids were 100 mol % phosphocholine (PC), 73 mol % PC and 27 mol % phosphoethanolamine (PE), or 65 mol % PC, 27 mol % PE, and 8 mol % phosphatidylinositol (PI). Both the binding of Cy5 LUVs to the bare oil-water interface and the binding of TF LUVs to Cy5-coated LDs were enhanced when the non-fluorescent lipids included PE and PI rather than only PC.
A control experiment was performed in which the LD caps were exposed to TF-labeled LUVs before the Cy5-labeled LUVs, with indistinguishable results regarding the reduced but notable binding of the second type of LUVs (Figure 3F). A potentially significant difference is that the fluorescence intensity of the TF-labeled LUVs did not saturate within 20 min as did the Cy5-labeled LUVs. This result is consistent with the long durations required for LUV binding for a saturated reduction in the monolayer surface tension, as described below. In all cases, the TF fluorescence emission was approximately one-third as intense as the Cy5 fluorescence emission for the compositions and imaging parameters used here.
Alternatively, LD caps were created with phospholipids initially dissolved within the TAG, which apparently creates the phospholipid monolayer more rapidly and completely than when the only source of phospholipids is the LUVs within the surrounding aqueous buffer (Figure 3G).
In all cases, when the first LUVs were exchanged with a different color of LUVs, the LD monolayers decreased in brightness of the first color and increased in the second, which suggests an exchange of phospholipids between the LD monolayer and the LUVs. Control experiments confirmed that the brightness decrease was not due to photobleaching, which was ≤7%. The LD monolayers approached the composition of the surrounding LUVs regardless of the initial monolayer composition.
Monolayer packing measured by FLIM
The fluorescence lifetime of Flipper-TR reports the packing of the phospholipids within a membrane.30,31 Shorter lifetimes reflect a lower density or more fluid phospholipids, as Flipper-TR has more molecular flexibility for quicker relaxation. FLIM images of LD caps coated with non-fluorescent phospholipids and Flipper-TR show that the Flipper-TR was concentrated in the monolayer surrounding the LD and had minimal partitioning into the bulk oil or aqueous phases (Figure 4A).
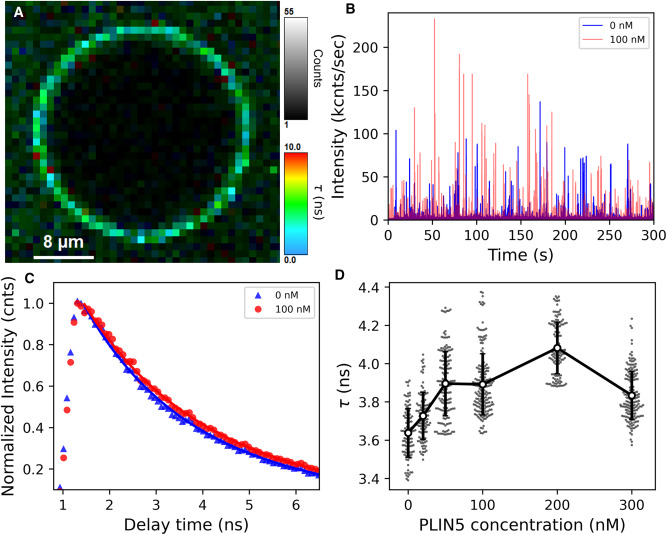
Figure.4 Fluorescence lifetime imaging microscopy on LD membranes
The monolayer packing was measured separately in LD caps and small LDs diffusing through a fixed observation spot. The LD caps provide the changes versus time for a single LD but were vulnerable to photobleaching. Alternatively, by observing the spontaneous diffusion of small LDs through a fixed observation spot, many LDs were observed within a single 3-min acquisition without concern of photobleaching. The buoyant nanoscale LDs were sufficiently stable when initially dispersed throughout the 20-μL sample for observation over 20 min with multiple 3-min acquisitions. This is supported by the expected balance of the droplet’s buoyant force and drag coefficient, as described in the STAR Methods.
The fluorescence lifetime of Flipper-TR was observed in small LDs upon the addition of non-fluorescent PLIN5 (Figure 4). PLIN5 bound to the LDs, intercalated between the phospholipids, caused increased phospholipid packing, reduced Flipper-TR molecular flexibility, and increased the Flipper-TR fluorescence lifetime. The acquired data show modest changes in τ with variability depending on the data fitting methods employed.
Sample-to-sample reproducibility demonstrated a maximum of 1.1% variation in the mean τ observed upon application of the selection criteria described in the STAR Methods. When the data from all samples, including those with low total counts or unusually large bursts of emission, were incorporated, a maximum of 9.6% sample-to-sample variation was observed. The variable fitting methods employed demonstrated a standard deviation of the fit results by less than 3.1% of the mean for all conditions. A 7.5% increase in τ for [PLIN5] ≥ 100 nM versus [PLIN5] = 0 nM and a propagated uncertainty of 3.3% yields a Z score of 2.3 and a p value of 0.01; τ significantly increased with the addition of ≥100 nM PLIN5.
Droplet surface tension changes
The surface tension on the LDs dictates the energetic cost of increasing the droplet area. Force spectroscopy with an AFM measured the force necessary to deform LD caps and increase their surface area (Figure 5A). We modeled the LD cap shape initially as a hemisphere. We assumed a constant droplet-to-coverslip contact area, a constant droplet volume, and a minimum droplet area as the AFM tip pressed upon the cap (Equation 3; Figure S4). Numerically solving for the droplet shape with the above constraints as the AFM compressed the cap yielded the estimated surface tension with droplet height compression (Figures 5B and 5C). For a ≤1% change in the droplet height, the force upon the colloidal AFM tip was estimated to be proportional to the height change of the droplet with a slope of −(4.33 ± 0.01)γ (Equation 4; Figure 5D).
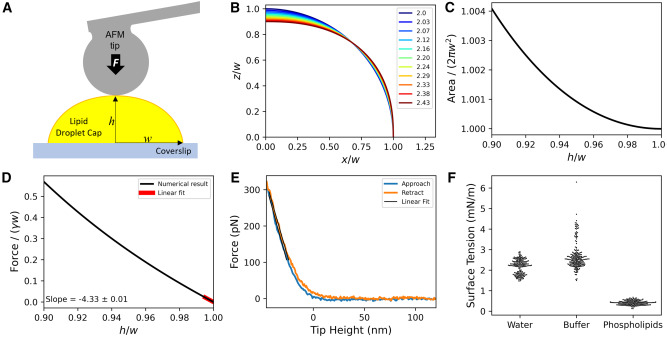
Figure.5 Measuring membrane tension with force spectroscopy
The experimental approach and retraction curves showed a consistent force upon the AFM tip versus tip height (Figure 5E). At far separation distances, there was no measured force upon the AFM tip, which shows the minimal drag on the AFM tip as it was moved through the buffer. The first forces upon the AFM tip were presumably non-contact forces and independent of the LD surface tension. After the cap was compressed to >20 nm, a linear force versus height was observed resisting the compression of the cap, which agreed with our numerical model. The slope of the force versus height was determined and fit to calculate the surface tension of the LD cap (Equation 4). Repeated measurements on individual caps, between caps in a single dish, and in separate dishes yielded consistent surface tensions for the three conditions evaluated while using the 97% TAG. The surface tension decreased from 2.2 ± 0.4 and 2.5 ± 0.6 mN/m in Milli-Q water and intracellular buffer (IB), respectively, to 0.4 ± 0.1 mN/m in 0.8 mg/mL LUVs after equilibrating for >1 h (Figure 5F).
A second approach to measure the LD surface tension was performed with a custom pendant droplet tensiometer (Figure 6). Our method employed a cuvette and needle to minimize the droplet and surrounding buffer volumes. The 30G blunt needle provided an internal diameter of 160 μm that was suitable to hold droplets up to 10 μL within the disposable polystyrene microcuvette. With <10 mN/m surface tension, <6 μL droplets were necessary to limit detachment. Accurate tension measurements could be made on droplets >0.5 μL for tensions <2 mN/m. Inserting the 90° curved needle into the bottom of the microcuvette such that the tip of the needle was within 2 mm of the bottom of the cuvette allowed for the droplet to be fully submersed within 300 μL of buffer. We typically used 400 μL of buffer to ensure that the droplet was >2 mm from the buffer-air interface (Figure S5). The 4.5-mm-wide cuvette provided 0.9 mm of space between the sides of the cuvette and the 10 μL droplets.
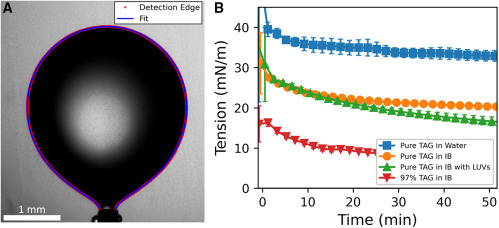
Figure.6 Pendant droplet tensiometry of model LDs
Our custom optical setup incorporates standard optical components with a 4× objective to provide bright-field images of the droplet shape (Figure 6A). The software OpenDrop automatically detects the droplet’s edge and fits it to the Young-Laplace equation to report the droplet’s volume, surface area, and tension versus time. A computer-controlled syringe pump grew the oil droplet within the cuvette containing the aqueous buffer.
The surface tension of the droplets decreased over time as the surfactants within the oil or buffer concentrated on the oil-water interface (Figure 6B). The 99% triolein in Milli-Q water demonstrated a surface tension of 33 ± 1 mN/m, while surfactants within the intracellular buffer resulted in an observed surface tension of 20 ± 1 mN/m after 50 min of equilibration. The surfactants present as impurities within the 97% triolein resulted in a rapid decrease in its surface tension in the intracellular buffer to 7.8 ± 0.4 mN/m. The presence of LUVs in the surrounding buffer resulted in a consistently decreasing surface tension that likely would have reduced below the observed 16.5 ± 1 mN/m with greater time for the LUVs to bind and saturate the monolayer. The long duration of phospholipids equilibrating on the LD membrane when presented as LUVs was noted and likely results in the non-saturating phospholipid monolayers present in most experiments that utilize this method of monolayer creation.
PLIN5 diffusion on LDs
The diffusion of PLIN5-YFP on LD caps and buoyant LDs was observed with FRAP and FCS, respectively (Figure 7). PLIN5-YFP was bound to LD caps in which the phospholipid monolayer was created by 20 min of LUV binding, phospholipids initially mixed within the TAG, or with no phospholipids. The PLIN5-YFP recovery time constants were 14 ± 5, 16 ± 4, and 22 ± 11 s, respectively, yielding diffusion coefficients of 0.21 ± 0.13, 0.20 ± 0.05, and 0.14 ± 0.10 μm2/s, respectively, for the three phospholipid conditions; uncertainties are reported as the standard deviations of the repeated measurements.
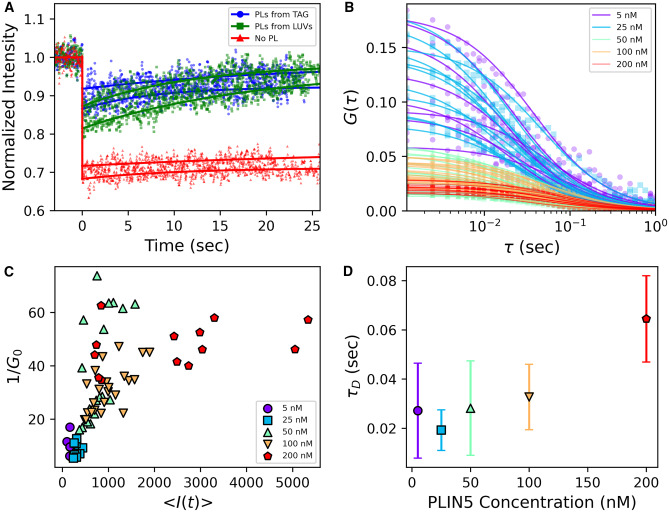
Figure.7 Diffusion of PLIN5-YFP on LDs
The mobile fraction of PLIN5-YFP varied with the LD monolayers. Without phospholipids, the PLIN5-YFP bound to the LD demonstrated little free diffusion, while the bleached region negligibly recovered (Figures 7A and S6). Without phospholipids, the bleached spot maintained prominence with (12% ± 3%) of the fluorescence recovering. With phospholipids, (94% ± 3%) and (97% ± 1%) of the fluorescence recovered when the phospholipids came from the TAG and LUVs, respectively, while accounting for diffusion during the bleaching. These results suggest that PLIN5-YFP mobility highly depends on the phospholipid monolayer coating the LDs.
For FCS, PLIN5-YFP was added to the spherical, buoyant LDs before their incorporation into the microsphere-supported glass microscopy chambers. The diffraction-limited observation point on the LDs was the bottom of the spherical LDs closest to the inverted microscopy objective. The focused laser excitation and emission were transmitted without refraction through the curved LD surface by focusing on the bottom point of the LD. Additionally, the bottom of the floating LDs was >5 μm from the potentially perturbing coverslip. Increasing the solution concentration of PLIN5-YFP resulted in a higher concentration of LD-bound PLIN5-YFP, as assessed by both the increased brightness of the PLIN5-YFP bound to the LD surface and the reduced amplitude of the PLIN5-YFP autocorrelation (Figure 7C). The linear correlation between 1/G0 and the emission intensity observed was readily apparent for intermediate emission intensities, which was only observed for [PLIN5-YFP] < 200 nM. When [PLIN5-YFP] exceeded 100 nM in the surrounding solution, the brightness of the PLIN5-YFP on the LD membrane continued to increase, but the amplitude of the autocorrelation did not continue decreasing. This is consistent with the highest PLIN5-YFP concentrations demonstrating a changed binding modality and slowing the PLIN5-YFP diffusion, such as homo-oligomerization or aggregation. The characteristic dwell time of the PLIN5-YFP remained relatively constant for [PLIN5-YFP] < 200 nM and D = 0.23 ± 0.02 μm2/s, but PLIN5-YFP demonstrated slower diffusion at 200 nM with D = 0.01 ± 0.003 μm2/s (Figure 7D).
Discussion
Evaluating the biophysics of LDs requires methods capable of isolating and measuring the dynamic properties of the oil-water interface. This interfacial membrane is challenging to measure optically because it typically consists of a curved boundary with a high index of refraction contrast that distorts imaging through the droplet and complicates analysis of on-membrane diffusion. Further, the low mass density of the LD’s oily interior causes the droplets to be buoyant in aqueous buffers and potentially float out of the working distance of inverted microscopy objectives. We have enabled high-resolution imaging of LDs with exchangeable aqueous buffers through innovations in imaging chambers, surface adhesion, and flow cytometry.
Transient adhesion of TAG droplets to microscopy coverslips was achieved to yield a moderately lipophilic surface to create LD caps. LD caps provide the experimental benefits of allowing for aqueous exchange surrounding the LDs with a planar bottom while maintaining the proximity of the LDs to the short-working-distance, oil-immersion inverted microscopy objectives. These caps were used to measure the binding rate and the diffusion of phospholipids and proteins on the LD surface. Additionally, mechanical deformation of the caps with an AFM scanning tip has enabled the measurement of the LD surface tension.
The creation of LDs through sonication, vortexing, or N2 fragmentation creates heterogeneous, micron-sized droplets. This size distribution was both a feature and a challenge for systematic LD analysis. Nanoscopic LDs with a low TAG-to-phospholipid ratio were measured with FLIM when mixed throughout the aqueous buffer before they floated out of view. Larger LDs were confined within microbead-stabilized glass chambers to keep the LDs within the short working distance of the oil-immersion objective. These chambers enabled long-duration, single-spot observation of membrane-bound molecules diffusing on the membrane by focusing on the bottom of a spherical LD. Finally, the surface-adhered LD caps were measured during an exchange of the aqueous buffer for time-dependent measurements of the membrane change.
The monolayer surface tension is among the most important physical properties governing the activity of LD-associated proteins for LD nucleation and growth and the regulation of lipolysis. We employed three methods of measuring the LD surface tension: AFM force spectroscopy, FLIM, and pendant droplet tensiometry. These three methods provide distinct physical methods to measure the phospholipid monolayer tension. The scanning AFM probe compressed the LD cap and measured the force resisting expansion of the cap area that was directly related to its surface tension (Equation 4). Successful AFM force spectroscopy required a passive probe-membrane interaction without significant binding, adhesion, or hysteresis. Should the tips crash into the droplet and become coated with TAG, a rigorous rinsing of the used tips in isopropyl alcohol proved to restore them to their original, clean state for a negligible interaction with the droplet upon repeated use. Commercial cleaners such as Hellmanex III to clean the AFM probe resulted in a detachment of the colloidal microsphere from the AFM cantilever. The probe-based compression of the LD cap demonstrated here measures the LD shape deformation force rather than the capillary force-based AFM measurements of surface tension performed previously,32 as evidenced by the lack of adhesion observed in the retract and withdraw force curves.
Commercial pendant droplet tensiometers are readily available. However, we aimed to create a cost-effective, precise, custom tensiometer for samples of minimum volume. Our system incorporates a semi-micro cuvette with a 30G needle inserted near its bottom. The sample enables viewing 1–10 μL oil droplets within 300 μL of aqueous buffer. This small volume of the aqueous buffer will be significant as we use the system to reduce the consumption of expensive reagents on the LD surface in future studies. The optical setup necessary to resolve the shape of 2-mm-diameter droplets may be as simple as a consumer camera with a macro lens.33,34 Further, using open-source software for image analysis (i.e., Fiji and OpenDrop) allows custom pendant droplet tensiometers to be a cost-effective experimental setup.35,36
FLIM offers a technique to optically measure membrane packing without physically manipulating or precisely resolving the LD shape. The fluorescence lifetime of membrane-embedded fluorophores was challenging to correlate to physical measurements of membrane tension because the fluorescence lifetimes of Flipper-TR have been correlated with phospholipid packing, composition, temperature, phase, and tension.30,37 Our discovery that Flipper-TR may be concentrated in the LD monolayer compared to the samples' bulk oil or aqueous phases enables FLIM to resolve membrane changes coupled with metabolic processes. The demonstration that the Flipper-TR fluorescence lifetime increases upon the addition of PLIN5 reveals that PLIN5 binding was affecting the packing of the phospholipids on the LD membrane via mechanisms and with ramifications that are yet to be discovered.
The LD surface tension depends on the surfactants present. Natural surfactants, such as phospholipids, segregate to the oil-water interface, but kinetic limitations in LUV binding complicate the creation of the equilibrated phospholipid monolayer from LUV fusion (i.e., Figure 6B). Dissolving the phospholipid within the bulk TAG before LD or pendant droplet formation is thought to create a complete monolayer quickly,22 but a detailed analysis is warranted in future studies. Interestingly, the diffusion of LD-bound PLIN5-YFP was weakly dependent on the source of the phospholipid, but PLIN5-YFP diffusion was inhibited if no phospholipid was present (Figure 3F). We hypothesize that the incomplete phospholipid monolayer created by <1 h of LUV binding was sufficient for natural PLIN5-YFP diffusion, but future studies are warranted to establish if phospholipid density on the LD affects other properties of protein behavior, such as the maximum bound protein density or protein-protein interactions. Comparing phospholipid monolayers created by LUV binding versus phospholipids dissolved within the TAG will further elucidate how phospholipids affect protein behavior.
Limitations of the study
The methods presented here each contain their strengths and limitations for analyzing the biophysics of LDs. The TAG-filled buoyant droplets have been traditionally challenging to measure in aqueous buffer with inverted microscopy; however, the imaging chambers limit the sample depth, and small droplets float out of view slowly. When creating spherical droplets from mixtures of phospholipids and TAGs, the final droplet size depended on the nuanced power and duration of the sonication or vortexation. Calibration is necessary for the particular equipment used to ensure that consistent droplets were made without a creaming of the sample. Relatedly, droplets could be made with incomplete phospholipid covering of the monolayer if excess agitation was performed or insufficient phospholipid vesicle binding to the oil-water interface was performed. The stability and shape of the LD caps depends on the coverslip preparation (i.e., hydrophobicity) and the cap properties; caps of large size and low tension on a surface of low hydrophobicity would detach from the substrate and float out of view. Typically, the fluorescence measurements are limited by the fluorophore bleaching and potential artifacts caused by the labeling of the biomolecules. The interpretation of the FLIM measurements incorporates a range of phenomena, including phospholipid saturation, packing, and tension. A detailed understanding of why PLIN5 binding results in a more stabilized Flipper-TR structure and longer fluorescence lifetimes is an ongoing area of study. With the use of scanning probe spectroscopies to measure liquid interfaces, it remains challenging to ensure that the surface tension and tip surface chemistry are appropriate to resolve the resistive force to increase the surface area. Proper tip surface preparation is necessary to avoid wetting the tip by the oil. The pendant droplet tensiometer requires the droplet sizes to be within a range determined by the droplet surface tension. Droplets that are too large will detach and float out of view. Droplets that are too small will appear spherical with unresolvedly high tension. Dynamic control of the droplet size may be necessary upon dramatically changing tensions. FCS is a powerful method for resolving the mean diffusion rate through diffraction-limited spots but is limited in its ability to distinguish the distribution of diffusion rates. The diversity of methods for creating and observing the LDs presented here provides complementary analyses and gives confidence that the limitations of any method are not obscuring the underlying biophysics being observed.
Molecular Engineering of a Spider Silk and Mussel Foot Hybrid Protein Gives a Strong and Tough Biomimetic Adhesive
Yin Yin, Nelmary Roas-Escalona and Markus B. LinderAdvanced Materials and Interfaces, Volume 11, Issue 8, March 14, 2024, 2300934
doi: https://doi.org/10.1002/admi.202300934
Abstract
High performance bio-based materials are an important part of future sustainable technology, and engineered proteins provide excellent possibilities as functional polymers. Adhesives are widely needed for composite materials and biomimetic structures. In biological adhesives, two features have emerged as especially interesting—the role of coacervation and the presence of 3,4-dihydroxyphenylalanine (DOPA). To study these, protein engineering is used to construct a hybrid silk-mussel foot protein (mfp) adhesive. Tyr residues in the purified mfp are oxidized to DOPA and an encoded SpyCatcher-Tag system allowed easy click-chemistry to couple silk and mfp and to study the parts separately. The combined silk-mfp protein have a strong tendency to coacervate. DOPA affected the properties of coacervates and increased adhesion by several ways of measuring. In lap shear testing, the combined mfp-silk protein is superior to any of the components studied separately. Coacervation is suggested to contribute to the adhesion of silk-mfp, and shows several features suggested to lead to the strength and toughness of natural adhesives. In the lap shear system, coacervation have a stronger overall effect on adhesion than the presence of DOPA. The results show that protein design provides a route toward high performance biosynthetic polymers and future sustainable materials.
1. Introduction
Molecularly engineered proteins show a great potential for high-performance bio-based materials that are possible to produce from renewable resources in a sustainable way. Proteins show remarkable functions in nature, and a major challenge is to mimic these functions in a new context so that they in a feasible way can be used to make the materials we need for advanced or everyday applications. One material functionality that is of particular interest is adhesion. Adhesives form an increasingly central technology in manufacturing overall, for example, for creating lightweight structures, complex shapes, and enabling new production methods such as additive manufacturing. Importantly, these bio-based materials are formed in aqueous systems and do not require the use of organic solvents. By using adhesives for composites, we can for example upcycle and re-use natural fibers such as cellulose or find new uses for low-value fiber. Nanocomposites are also key approaches for unlocking the potential of components such as carbon nanotubes or graphene for high performance structures.
One unique potential of proteins for materials is that although they are large macromolecules, it is possible to engineer them with atomic detail. Protein engineering allows us to make structural and functional changes that are needed for taking them out of their biological context and developing them for use in new setups that fit our specific materials and processing needs. An example is the engineering of silk proteins to allow high-yield bacterial production and a technically feasible way of producing fiber with excellent properties. For adhesives, a source for bioinspiration are the adhesive systems originating from marine organisms. In particular the holdfast system of Mytilus species, that is, mussels, have served as biomimetic models. Their adhesive systems contain a number of proteins with specialized functions and are found in different regions of the adhesive plaques with specific roles and functions in both the sequence in which they are applied and in forming the final structural assemblies. In a simplified view, there are two features of these adhesive systems that have attracted especially wide attention. One is the extensive occurrence of the modified amino acid side chain 3,4-dihydroxyphenylalanine (DOPA) and the other is that the adhesive mussel foot proteins (mfps) undergo a liquid–liquid phase separation (LLPS)—also known as coacervation or condensation—as a step in their assembly from soluble protein into their final structures. DOPA is introduced as a post-translational modification by oxidization of Tyr-residues. The two hydroxyls of DOPA participate in metal chelation, π-cation interactions, and form hydrogen bonds with hydrophilic surfaces. At acidic pH the reactivity of DOPA is low, but at neutral or higher pH, DOPA is readily oxidized further into dopaquinone that participates in a wide range of reactions leading to, for example, crosslinking. These functions can be involved in both adhesion and cohesion in multiple ways, and it has been found that even the incorporation of DOPA in simple peptides markedly increase their adhesion to different surfaces. However, several studies have brought to attention that the natural system is more complex, with for example Lys residue side chains contributing to interactions and pointing out the important role of the overall structure of the proteins. The importance of coacervation for adhesion has been suggested since their initial observations, but a detailed understanding is still being formed. In parallel to these investigations, a wide understanding of coacervation as a mechanism for formation of biological assemblies and materials has emerged. Silk, the adhesive matrix of nacre, and other marine adhesive systems have been proposed to assemble through coacervation. A recurring theme for coacervating proteins—including silks and mfps—is that they contain intrinsically disordered regions (IDRs), that is, they do not take a specific 3D conformation in solution.
Coacervation can be driven by a number of different molecular interactions, and result in a concentrated phase with a high polymer (protein) concentration and a dilute phase. Some widely studied systems form complex coacervates in which two different polymers interact, typically by complementary charges. In biology, one-component systems are widespread, and in these identical polymer chains form interactions with each other. The water content in the coacervate is reduced and increased polymer–polymer interactions form. The molecular associations within the coacervates lead to a reduced conformational entropy of the protein chains—their order increases. Resulting bicontinuous internal structures in coacervates have been described. Protein association and possible formation of polymer entanglements are of particular interest as a route to enhanced cohesiveness in adhesives. Silk proteins have also attracted attention as adhesives. Silks form a large group of proteins that include ones from a wide range of insects and spiders. The spider-based silks show large variation, including adhesive functions. The exact molecular basis of the functional roles is not clear, as different variants of silk sequences show general adhesive properties. In particular, we have suggested previously that general features such as the interchain interactions in coacervates of also silks lead to adhesion.
In this work, we took a protein engineering approach to explore coacervation and DOPA as elements for designing novel biological adhesives. One problem that has hampered the use of recombinant mfps is that they are difficult to produce in full-length, and that engineered versions often suffer from poor solubility and low yield. Enzymatic in vitro modification of Tyr-residues to DOPA is well established, but the protocol involves many steps and can be difficult to perform if the protein is sensitive to the conditions needed for the reaction. This led us to explore a hybrid approach in which relatively short parts of mfp1-protein were linked to a silk protein that previously has shown promising functionality as an adhesive. As the optimal production procedures for silk and mfp1 protein were not compatible, we utilized a system called SpyCatcher-SpyTag to covalently couple the components after they had been separately purified and mpf1 post-translationally modified. This molecular engineering approach in which components from widely different origins are combined—each bringing a specific functionality—allowed us to take a novel approach to understand and apply biological adhesives.
2. Results
2.1 Protein Production and Modification
Initial experiments showed that a mfp1 variant termed mfp1Tyr having six tandem repeats of the consensus M. edulis mfp1 decapeptide AKPSYPPTYK fused with a SUMO tag SMT3 at the N-terminal could be expressed in E. coli with yields of 80 mg l−1 and was highly soluble. This “mfp1Tyr”-protein contained a SpyTag for ligation and a His-tag for affinity purification. Its sequence and schematic structure are shown in Figure 1. Compared to other variants tested (Table S1, Supporting Information), it was found that the SMT3 domain gave increased yields and solubility.
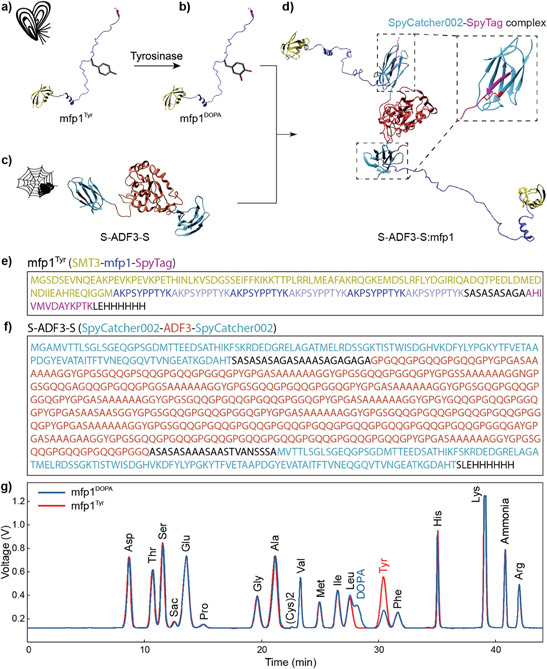
Figure 1
Strategy for assembling S-ADF3-S:mfp1 protein. a) Schematic structure of the mfp1Tyr protein which has three protein domains: a solubility tag SMT3 (based on PDB 1L2N), six tandem repeats of the decapeptide derived from M. edulis mfp1, and a SpyTag (based on PDB 4MLI). b) Schematic structure of mfp1DOPA in which part of the Tyr residues in mfp1Tyr are converted to DOPA. c) Schematic structure of the silk-like protein S-ADF3-S having a triblock structure with an intrinsically disordered silk sequence ADF3 as the mid-block and two SpyCatcher002 domains (PDB 4MLI) at each terminus. d) The S-ADF3-S:mfp1 protein was assembled by linking S-ADF3-S and mfp1DOPA/Tyr through the SpyCatcher002-SpyTag pair. e,f) The amino acid sequence of mfp1Tyr and S-ADF3-S. The colors correspond to the different domains in the proteins. g) Amino acid analysis of mfp1DOPA and mfp1Tyr. In the mfp1DOPA sample, the amount of Tyr was lower than for mfp1Tyr and peak corresponding to DOPA peak appeared. The conversion of Tyr to DOPA was ≈ 65%.
Tyr residues in mfp1Tyr were oxidized into DOPA by tyrosinase enzyme (Figure 1). Based on amino acid analysis, 65% of Tyr in the mfp1Tyr were converted to DOPA, with the other 35%, remaining non-modified as Tyr. For clarity, we here denote the modified DOPA containing mfp1 protein, “mfp1DOPA” to distinguish it from the nonmodified version mfp1Tyr. The mfp1DOPA version showed a slight smear on the SDS-PAGE (Figure S1, Supporting Information) compared to mfp1Tyr. A similar smear for DOPA modified proteins has been reported earlier.
We made another protein—S-ADF3-S—which had a central part consisting of the repetitive region of the ADF3 spider silk protein and two flanking SpyCatcher002 (a variant of SpyCatcher) domains at each terminus (Figure 1). Production of S-ADF3-S resulted in a soluble protein with a yield of ≈ 130 mg l−1 of culture medium. The S-ADF3-S protein was purified from the periplasm of E. coli by heating cell lysate to precipitate endogenous proteins and performing a buffer exchange.
2.2 Formation of Coacervates
The SpyCatcher002-SpyTag ligation of both mfp1Tyr and mfp1DOPA to S-ADF3-S proceeded readily giving linked proteins here termed “S-ADF3-S:mfp1Tyr” and “S-ADF3-S:mfp1DOPA”. We mapped a range of different ratios of mfp1DOPA and mfp1Tyr to different amounts of S-ADF3-S and observed the effect on coacervation and linkage (Figure 2). In these experiments, 100 mm sodium acetate buffer at pH 5.0 was used. With molar excess or equimolar amounts of SpyTag to SpyCatcher002—taking into account that S-ADF3-S contains two SpyCatcher002 domains—coacervation was observed at a wide range of concentrations. With lower than equimolar amounts of SpyTag to SpyCatcher002, we observed the formation of aggregates in combination with some coacervate droplets for both DOPA and Tyr versions. Plotting the results (Figure 2a,b) these combinations formed a region above the diagonal for excess mfp1DOPA or mfp1Tyr and below diagonal for excess S-ADF3-S. Coacervation was observed for both versions of the combined proteins at already 25 µm concentration of S-ADF3-S. This is a marked difference compared to the S-ADF3-S silk part alone, as it by itself did coacervate only at concentrations of 700 µM. Using dextran as a crowding agent, S-ADF3-S can form coacervates at much lower concentrations (Figure 2c). 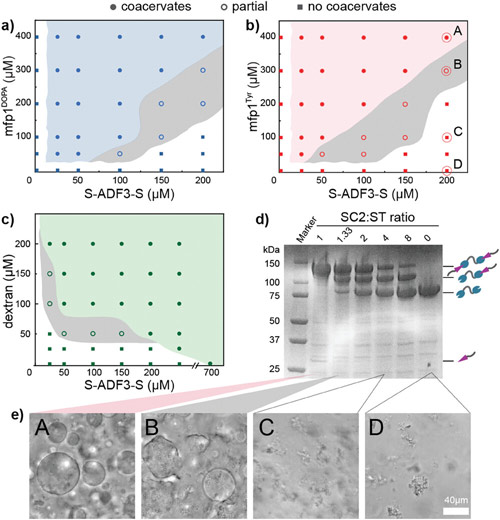
Figure 2
a) Phase diagram of S-ADF3-S with mfp1DOPA. b) Phase diagram of S-ADF3-S with mfp1Tyr. c) Phase diagram of S-ADF3-S with dextran 500. d) SDS-PAGE analysis of SpyCatcher002-SpyTag ligation with different SpyCatcher002:SpyTag (SC2:ST) ratios indicated in (b). The S-ADF3-S concentration was 200 µM, while the concentration of mfp1Tyr varied from 0 to 400 µm. The proteins in each band are indicated on the side, and are from the bottom: mfp1Tyr, S-ADF3-S, S-ADF3-S linked to one mfp1 Tyr, and S-ADF3-S linked to two mfp1 Tyr. e) Representative light microscopy images for A) coacervates, B) partial coacervates (coacervates mix with aggregates), C) no coacervates and D) S-ADF3-S protein alone. Scale bar: 40 µm.
2.3 General Properties of the Coacervates
We proceeded with a detailed characterization of the properties of coacervates formed by the both S-ADF3-S:mfp1DOPA and S-ADF3-S:mfp1Tyr proteins. A molar ratio of SpyCatcher002/SpyTag of 0.6 (80 µm S-ADF3-S and 267 µm mfp1Tyr/ mfp1DOPA) was chosen for the characterization experiments, as this combination showed clear coacervation behavior in the experiments above. The characterization of physical properties was done at pH 5 in 100 mm sodium acetate buffer. Using buffers with lower pH resulted in precipitation. Molecular diffusion within coacervates was studied using fluorescence recovery after photobleaching (FRAP) (Figure 3a). For FRAP, the S-ADF3-S molecule was labeled with a fluorophore (Oregon green) prior to the linking to mfp1DOPA or mfp1Tyr, allowing identical labeling of both variants. Using freshly prepared (1 h) samples, a diffusion coefficient (D) of 0.029 µm2 s−1 was obtained for both variants, that is, no difference in D was observed. The mobile fraction was slightly larger for the Tyr than for the DOPA version (82±0.9% vs 76±1.8%). Over time, the nature of the coacervates changed—therefore measurements were also done 16 h after sample preparation. For samples at 16 h the mobile fraction for S-ADF3-S:mfp1Tyr dropped only a little (to 68%), while for S-ADF3-S:mfp1DOPA it was reduced markedly (to 32%) while D dropped for both versions (0.021 µm2 s−1 for S-ADF3-S:mfp1DOPA and 0.019 µm2 s−1 for S-ADF3-S:mfp1Tyr) (Figure S2, Supporting Information). The change in mobile fraction for the DOPA-version are in line with the expectation that at pH 5 a slow DOPA-mediated bridging and crosslinking in the structure occurred due to a slow oxidation of DOPA to dopaquinone. A slow oxidation of DOPA was also indicated by a slight brownish color developing due to dopaquinone formation. The drop in D for both versions show that molecular interactions develop in the mfp1Tyr version as well. A slow viscosity increase is generally observed in ADF3-containing proteins over time.
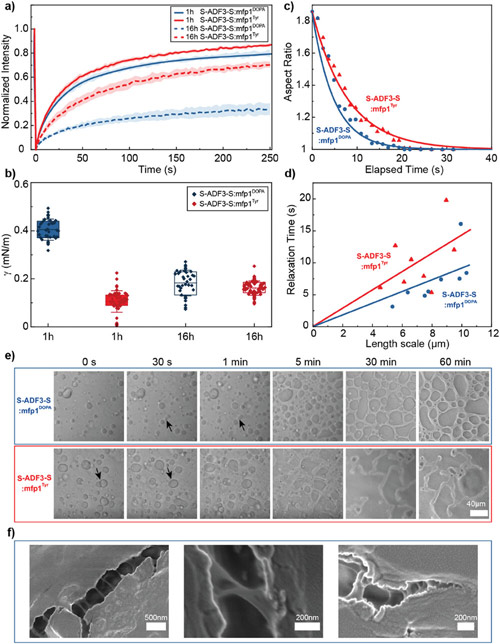
Figure 3
a) FRAP curves for the 1 and 16 h samples of S-ADF3-S:mfp1DOPA and S-ADF3-S:mfp1Tyrwith coacervate diameters of 15–25 µm, N = 5. b) Interfacial tension of 1 and 16 h S-ADF3-S:mfp1DOPA and S-ADF3-S:mfp1Tyr coacervates estimated by glass colloidal probe AFM measurements. c) Analysis of fusion dynamics. The blue dots show the dynamics of an example fusion event of two 1 h S-ADF3-S:mfp1DOPA coacervates and the blue line is the fitting curve. The red triangles show the slightly slower fusion dynamics of two 1 h S-ADF3-S:mfp1Tyr coacervates with a red fitting curve. d) Plot of the relaxation time versus length from 1 h S-ADF3-S:mfp1DOPA sample (blue dots) and 1 h S-ADF3-S:mfp1Tyr sample (red triangles), N = 8. The blue and red lines are linear fits to the 1 h S-ADF3-S:mfp1DOPA and 1 h S-ADF3-S:mfp1Tyr data. e) Light microscopy images of coacervates morphologically change on a glass surface in response to the different time for 1 h S-ADF3-S:mfp1DOPA and S-ADF3-S:mfp1Tyr coacervates, separately. Arrows indicate the coalescence of two coacervates, scale bar 40 µm. f) Different magnifications of SEM images of cracks formed in 1 h S-ADF3-S:mfp1DOPA coacervates when they were dried and teared. When teared, bridging ligaments are formed in the cracks.
We next studied the surface tension of the coacervates (Figure 3b) by colloidal probe-atomic force microscopy (AFM) capillary bridging. A marked difference between coacervates was found with S-ADF3-S:mfp1Tyr showing significantly lower surface tension (γ) (≈ 0.1 mN m−1) than S-ADF3-S:mfp1DOPA (0.4 mN m−1) for 1 h samples. Over 16 h the surface tension of S-ADF3-S:mfp1DOPA dropped to the same level of S-ADF3-S:mfp1Tyr which did not change. For further exploring this finding, we recorded the time dependance of droplet coalescence for 1 h samples. From video recordings of droplet fusion events, the reduction of aspect ratio of the coalescing droplets was plotted against time, giving the relaxation time (τ) (Figure 3c). By combining data from droplets of different size and calculating the slope of a line fitted to the data gives the inverse capillary velocity (η/γ), that is, the viscosity η normalized by γ. This slope was lower—coalescence proceeded faster—for S-ADF3-S:mfp1DOPA than for S-ADF3-S:mfp1Tyr. Since viscosity and D are inversely proportional and since D was measured to be the same for both variants, it follows that γ is higher for S-ADF3-S:mfp1DOPA, thereby confirming that the DOPA-modification does lead to an increase in surface tension. The surface tension difference could also be seen in how droplets adsorbed and spread on a glass surface (Figure 3e). S-ADF3-S:mfp1Tyr showed a more spreading, that is, better surface wetting than S-ADF3-S:mfp1DOPA.
As a means to study the internal structure of coacervate droplets, solutions were dried down on a parafilm support and then slightly stretched (Figure 3f). The stretching resulted in cracks in the protein films. In the cracks, there were clearly visible tear-out of ligaments which often formed bridges over the cracks. No qualitative differences ligament tear-out were observed between S-ADF3-S:mfp1DOPA and S-ADF3-S:mfp1Tyr (Figure 3f; Figure S3, Supporting Information).
2.4 Adhesive Properties by AFM
AFM was used initially for characterizing adhesive properties of the coacervates (molar ratio of SpyCatcher002/SpyTag of 0.6). Two different probes were used, a pyramidal silicon nitride probe and a spherical glass colloidal probe. We established an experimental setup where coacervates lay over muscovite mica having a polylysine (PLL) coating. The PLL coating resulted in a weak adherence of the coacervate droplets to the support material, enough to allow probing the coacervates with the AFM tip, but weak enough not to distort the droplets. To help understand PLL adherence we measured zeta potentials (Table S3, Supporting Information). Coacervates have a slightly negative charge at pH 5, with values ≈ −0.41±0.06 and −0.48±0.4 mV for S-ADF3-S:mfp1DOPA and S-ADF3-S:mfp1Tyr, respectively. Some attractive electrostatic force between the PLL is expected. As above, experiments were done in sodium acetate buffer at pH 5.0 and with the same composition.
Probing S-ADF3-S:mfp1DOPA and S-ADF3-S:mfp1Tyr coacervates with the pyramidal tip gave force–distance curves with a sawtooth appearance (Figure 4a). Adhesive forces were higher—and showed a larger number of peaks which were at higher forces—for S-ADF3-S:mfp1DOPA than for S-ADF3-S:mfp1Tyr. The number of peaks were quantified as step-counts (Figure 4b), and show that the S-ADF3-S:mfp1DOPA coacervates resulted in a higher number of adhesive contacts than S-ADF3-S:mfp1Tyr. This stickiness may be due to more interactions between the tip and protein, or because S-ADF3-S:mfp1DOPA condensates contain more numerous intramolecular crosslinks. The contact time had a marked effect on adhesive forces. Increasing contact time from 1 to 10 s (Figure 4a,b) resulted in roughly a doubling of adhesion force. As a reference measurement PLL-coated mica which gave adhesion forces of ≈ 1 nN and single minima at 10 s and 0.2 nN at instantaneous (0s adhesion). 
Figure 4
a) Typical force curves obtained in buffer only and after absorbing S-ADF3-S:mfp1DOPA and S-ADF3-S:mfp1Tyr. Dashed and solid lines indicate data obtained during surface approach and retraction, respectively. All the curves correspond to random spots of the coated mica surface and coacervates. b) Average step counts corresponding to the multiple adhesives minima created during contact for absorbing S-ADF3-S:mfp1DOPA and S-ADF3-S:mfp1Tyr coacervates, and PLL.
Using the pyramidal silicon nitride tip, and probing the coacervate droplets, we found that S-ADF3-S:mfp1DOPA coacervates did show higher adhesion forces than S-ADF3-S:mfp1Tyr (Figure 5a). The adhesion force decreased with time, being almost equal between the samples after 16 h. Measuring the adhesion forces of regions surrounding the coacervate droplets we found similar adhesion forces to those of the coacervates (Figure 5b). A control sample of the PLL coated mica without proteins gave a force of 1.2 ± 0.22 nN, which was in the range observed for all protein samples except the freshly prepared S-ADF3-S:mfp1DOPA samples. However, looking instead at the energy of adhesion—corresponding to the area under the force–distance curve—we do find that protein samples gave higher values (Figure 5c,d). The reason for this is that the multiple interactions due to the sawtooth retraction profile gives a larger integrated surface area. Protein samples measured in the regions surrounding the coacervates show higher adhesion energy than the PPL control indicating that protein was adsorbed to these regions. Aging of the sample did in all cases lead to a gradual lowering of adhesion (Figure 5a–d). The stiffness—Young's modulus—of the S-ADF3-S:mfp1DOPA coacervates was higher and increased over time more than it did for S-ADF3-S:mfp1Tyr coacervates (Figure S4, Supporting Information). 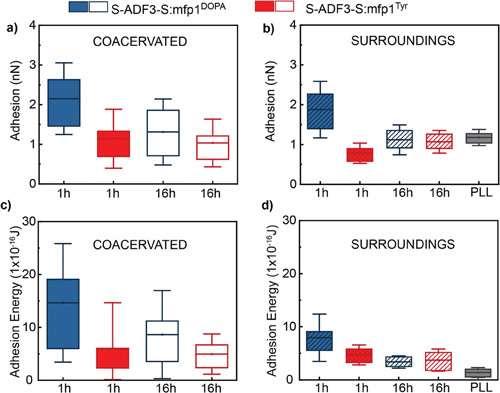
Figure 5
Adhesion force and adhesion energy of S-ADF3-S:mfp1DOPA and S-ADF3-S:mfp1Tyr. a) Comparison of the adhesion forces between the pyramidal tip and coacervates of S-ADF3-S:mfp1DOPA and S-ADF3-S:mfp1Tyr at 10s of contact time for 1 and 16 h samples. Nine coacervate droplets were measured and for each, 16 random spots were chosen, and at every spot with five repetitions were made. b) Adhesion forces between pyramidal tip of the area surrounding coacervates at 1 and 16 h samples and 10 s of contact time. The plain PLL surface was also measured. The data represents the mean ± SD of 9 areas surrounding the coacervates. In each area, 6 random points were chosen, and the forces curves were measured with five repetitions. c) As (a) but calculating the adhesion energy. d) As (b) but calculating the adhesion energy.
We further investigated how the PLL-coating affects the system. Measurements were performed in a system with mica that was not coated and when both the silicon nitride tip and mica were coated with PLL. In the first case, the coacervates did not adhered sufficiently to the substrate making measurements practical. When PLL-coating the tip in addition to the support layer (Figure S5, Supporting Information), the adhesion values were below those obtained without coating on the tip. To probe the effect of an excess of mfp1 we used a mixture of 80 µm S-ADF3-S and 895 µm mfp1Tyr/mfp1DOPA (ratio 0.18). The adhesive properties of coacervates were not affected by the change in ratio (Figure S6, Supporting Information). An excess of S-ADF3-S did not result in analyzable coacervates.
Using AFM cantilevers with colloidal glass probes having a diameter of 5 µm at their ends allowed measuring normalized adhesion energies. Typical force curves for S-ADF3-S:mfp1DOPA and S-ADF3-S:mfp1Tyr coacervates (molar ratio of SpyCatcher002/SpyTag of 0.6) at 10s contact times are shown in Figure 6a. As with the pyramidal AFM-tips above, the contact time affected adhesion values strongly, and contact times of 1 s gave only ≈ 40% of the adhesion compared to 10s. The normalized adhesion energy ( Ead = Fad/1.5πR) for the coacervates of the DOPA variant (1.74 ± 0.48 mJ m−2) was clearly higher than for coacervates of the Tyr variant (0.46 ± 0.42 mJ m−2) at 10s contact time. Probing the regions around the coacervates gave much lower values. 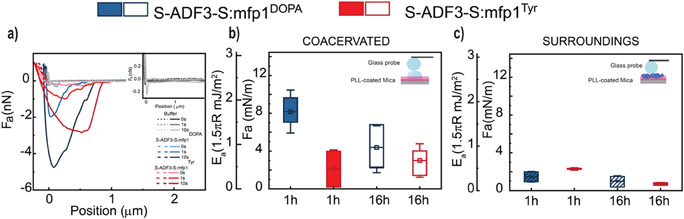
Figure 6
a) Typical force curves of S-ADF3-S:mfp1DOPA and S-ADF3-S:mfp1Tyr coacervates using colloidal glass probes (D ≈ 5 µm). The dash and solid lines indicate data obtained during surface approach and retraction. The inset shows the force curves obtained with the buffer before absorbing the coacervates. b) A comparison at 10 s of contact time of the normalized adhesion force and normalized adhesion energy between the glass probe and S-ADF3-S:mfp1DOPA and S-ADF3-S:mfp1Tyr, obtained for 1 and 16 h samples, respectively. The data represent the mean ± SD of 10 coacervates. For each coacervate, 30 force curves were taken. c) A comparison of the normalized adhesion force and normalized adhesion energy between glass probe and S-ADF3-S:mfp1DOPA and S-ADF3-S:mfp1Tyr on areas surrounding coacervates for 1 and 16 h sample at 10 s contact time. The data represent the mean ± SD of 10 areas. For each area, force curves were measured at 16 random points and five repetitions at every spot.
Comparing the adhesion energy of S-ADF3-S:mfp1DOPA and S-ADF3-S:mfp1Tyr is affected by their differences in deformability, that is, stiffness, interfacial viscoelasticity, and surface energy. These factors differ between the two types of coacervates, and also change over time. In fresh samples both the surface energy and stiffness were higher for S-ADF3-S:mfp1DOPA (Figure 3; Figure S4, Supporting Information). Since these factors lead to lower deformability, we can conclude that S-ADF3-S:mfp1DOPA showed an enhanced adhesion compared S-ADF3-S:mfp1Tyr (Figure S8, Supporting Information). For 16 h old samples the adhesion energy dropped for both S-ADF3-S:mfp1DOPA and S-ADF3-S:mfp1Tyr to a similar level. The oxidation of DOPA, increase in stiffness and viscosity together contributed to the decreased values, while the decrease in surface energy would be expected to counter the effect.
2.5 Adhesive Properties by Lap Shear Testing
We further studied the adhesive properties in lap shear tests. In order to understand the role of coacervation we prepared samples with both the assembled S-ADF3-S:mfp1DOPA and S-ADF3-S:mfp1Tyr as well as their components mfp1DOPA and mfp1Tyr and S-ADF3-S in separate experiments. We found that S-ADF3-S:mfp1DOPA and S-ADF3-S:mfp1Tyr both showed much higher lap shear strengths compared to the other samples but compared to each other they were largely similar (Figure 7). The free silk protein S-ADF3-S was close to mfp1DOPA, and mfp1Tyr had the lowest strength. Looking at the full load-displacement curves together with inspection of fracture areas gave further insight. The area under the load/displacement curve is a measure of work with the units of force times distance, and termed work of fracture. The displacement before fracture was clearly largest for S-ADF3-S:mfp1DOPA and S-ADF3-S:mfp1Tyr. The silk part S-ADF3-S by itself showed a higher work of fracture that mfp1DOPA and especially mfp1Tyr. Analyzing the fracture surfaces by microscopy we found that in all of the samples of S-ADF3-S:mfp1DOPA and S-ADF3-S:mfp1Tyr the adhesive was left on both surfaces, that is, they showed cohesive failure. Some also showed adherend failure—the glass substrate failed before the adhesive. For the three other samples the failure modes were mixed adhesive and cohesive. 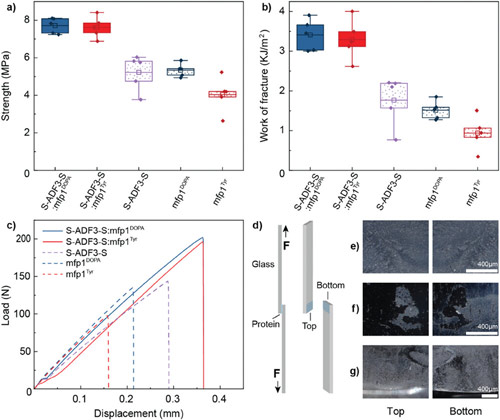
Figure 7
Comparison of the bulk adhesive strengths a) and work of fracture b) of the coacervated S-ADF3-S:mfp1DOPA and S-ADF3-S:mfp1Tyr individual proteins S-ADF3-S, mfp1DOPA and mfp1Tyr, N = 5. c) Representative load-displacement curves of each protein sample. d) Scheme of the lap shear test and the faces of the fracture surface. The digital microscopy images of the top and bottom fracture surfaces as the representative major failure mode: e) cohesive failure of adhesive, f) adhesion failure of adhesive/adherend interface and g) adherend failure. Scale bar = 400 µm.
3. Discussion
Our protein molecular engineering approach allowed to understand how two key concepts withing biological adhesives—coacervation and the presence of DOPA—can be used in a biomimetic way. Both DOPA and coacervation show contributions to adhesion, but depending on how the adhesive system was set up, the contributions showed up differently. Forming the hybrid S-ADF3-S:mfp1 protein by the covalent SpyCatcher-SpyTag linkage triggers strong coacervation. On a general level, coacervate formation is favored by multiple weak interactions between interacting protein chains. The detailed reasons for the high tendency for coacervation were not studied, but it is known that increased electrostatic interactions between chains and the length of these chains are expected contribute to the tendency for coacervation to occur. The calculated isoelectric points (pI) for S-ADF3-S and mfp1Tyr are 4.77 and 9.19, respectively. At pH 5, S-ADF3-S is slightly negatively charged, and mfp1Tyr is positively charged as also was confirmed by zeta potential experiments (Table S3, Supporting Information).
A key result here was that the hybrid S-ADF3-S:mfp1 adhesive coacervate performed very well in the lap shear test-setup with glass as the adherend. In this test the DOPA-version (S-ADF3-S:mfp1DOPA) and the Tyr-version (S-ADF3-S:mfp1Tyr) performed equally well. Both the strength of S-ADF3-S:mfp1 and the work of fracture—a measure of toughness—were clearly higher than for the constituent protein parts tested separately. The combination of high strength and toughness is a parameter that is often encountered in biological composite materials—and a key target of biomimetic materials research. It has been identified that factors that contribute to the combination of toughness and strength are the breaking of multiple weak bonds, stretching of entanglements in molecules, breaking of sacrificial bonds, and exposure of hidden lengths.
In coacervates, the protein molecules formed interactions between them as seen for example in that bridging ligaments formed in cracks when dried droplets were teared apart (Figure 3f; Figure S3, Supporting Information). Our observation is surprisingly similar to that shown for nacre and which has been suggested to form the basis of its toughness. In the AFM experiments with the pyramidal tip, the coacervated samples gave characteristic retraction patterns with multiple sawtooth interactions, indicating a connectivity that can come polymer interactions or multivalency. In AFM experiments the tip contact time was an important parameter. The effect of increase in adhesion with the length of contact time was expected and has been described for in several cases using natural mussel proteins, for example, mfp5 and affect absolute values for adhesion. S-ADF3-S:mfp1DOPA gave higher adhesive forces even in the regions surrounding the coacervates (Figure 5b). We interpret this adhesion coming from non-coacervated protein from the dilute phase bound to the surface. That DOPA increases molecular adhesion in this fashion is a verification of previously published results. As the DOPA oxidized, the effect on adhesion decreased to baseline. The oxidation rate is dependent on pH. Here we used pH 5 which is the same as has been found for the plaque protein secretion in M. edulis. A lower pH has often been used to limit oxidation of mfps, but this was not practical in our study as it caused precipitation of S-ADF3-S:mfp1 proteins.
The effect of DOPA on coacervates is more debated, since even contradicting results have been obtained. Our findings agree with most other studies concluding that DOPA does not affect the phase separation in mfps. Individual reports suggests that DOPA does contribute to regulating phase separation in mfps. Looking at the effect of physical properties of DOPA on coacervates we found a pronounced effect on surface tension. A generality of this effect is possible as it was previously reported using SFA to study mfp-1 and hyaluronic acid (HA) that DOPA-containing coacervates had higher interfacial energy (0.72 ± 0.17 mJ m−2) than coacervates lacking DOPA (0.34 ± 0.17 mJ m−2). The increase in surface tension leads to a lower tendency to wet surfaces it would be expected that in a natural system this would be a disadvantage (Figure 3e). This possible problem may have been overcome in some organisms by evolving special priming systems. However, in another study it was reported that complex coacervates formed by the recombinant adhesive protein (fp-151) and HA, the presence of DOPA did not change interfacial or other properties. DOPA has two hydroxyl groups and is more hydrophilic than Tyr. It is possible that a hydrophobic environment in coacervates forces molecular conformations at the droplet interface that result in the increased surface tension. DOPA also resulted in stiffer coacervates due to crosslinking. The stiffness increased over time.
Combining the understanding above we can present a model that explains the lap shear tests and suggests a further route for better engineered biosynthetic adhesives. By themselves in the lap shear tests both mfp1DOPA and mfp1Tyr showed brittle behavior and failed mostly at the interfaces. The mfp1DOPA version performed better as its adhesion was stronger. However, it showed only little extension and failed in a brittle way at the interface. The strongly coacervating S-ADF3-S:mfp1DOPA and S-ADF3-S:mfp1Tyr showed a more extension before failure—they could sustain a larger deformation under tensile stress. The failure was cohesive or then the adherend failed before the adhesive. We also found that the silk unit S-ADF3-S by itself showed more extension than either mfp1DOPA and mfp1Tyr and showed also more mixed cohesive/interfacial failure. This is consistent with its ability to coacervate to some extent even by itself at high concentrations (Figure 2c).
Extension of the bound layer helps distribute stress which explains why the interface is stable for the coacervating S-ADF3-S:mfp1DOPA and S-ADF3-S:mfp1Tyr. A distribution of stress decreases the risk of brittle failure at the interface. As the results show, adhesion to the surface was not the limiting factor for S-ADF3-S:mfpDOPA and S-ADF3-S:mfpTyr. During coacervation of proteins, contact points—stickers—form between molecules. This results in a molecular network where protein molecules are associated with each other. Networks can be observed at the micro-scale as an internal network structure within coacervates. As studied more generally for proteins, coacervation as a step toward materials, therefore, affect both the formation process—as seen especially in fiber formation—and mechanical properties. We therefore propose that the ligament formation seen when stretching coacervates is an underlying property leading to extension of the protein in the lap shear tests, and thus higher toughness and strength. DOOPA did not markedly affect this critical property of the adhesive in our system. In natural mfps this balance can be different, and therefore, DOPA can have a role of crosslinking and fine tuning of coacervate properties in addition to its interfacial binding function.
We demonstrated here that protein adhesives are a highly promising route toward designer biological materials combining performance and sustainable production methods. Based on our results we propose that the relation between molecular structure and coacervation and how the resulting molecular architecture affects the cohesion and extension mechanisms form crucial insights toward these new materials. For further developments of biological adhesives, it seems that a focus on the mechanisms of coacervation could hold more potential for improvements than what could be achieved by using DOPA-chemistry alone. Once we thoroughly understand how coacervation should be tuned for adhesion, we may find ways by which DOPA can further add to functionality.
Influence of Wettability and Geometry on Contact Electrification between Nonionic Insulators
Ignaas S. M. Jimidar, Wojciech Kwiecinski, Gijs Roozendaal, E. Stefan Kooij, Han J. G. E. Gardeniers, Gert Desmet, and Kai Sotthewes
ACS Applied Materials Interfaces 2023, 15, 35, 42004–42014
doi: https://doi.org/10.1021/acsami.3c05729
Abstract
Contact electrification is an interfacial process in which two surfaces exchange electrical charges when they are in contact with one another. Consequently, the surfaces may gain opposite polarity, inducing an electrostatic attraction. Therefore, this principle can be exploited to generate electricity, which has been precisely done in triboelectric nanogenerators (TENGs) over the last decades. The details of the underlying mechanisms are still ill-understood, especially the influence of relative humidity (RH). Using the colloidal probe technique, we convincingly show that water plays an important role in the charge exchange process when two distinct insulators with different wettability are contacted and separated in <1 s at ambient conditions. The charging process is faster, and more charge is acquired with increasing relative humidity, also beyond RH = 40% (at which TENGs have their maximum power generation), due to the geometrical asymmetry (curved colloid surface vs planar substrate) introduced in the system. In addition, the charging time constant is determined, which is found to decrease with increasing relative humidity. Altogether, the current study adds to our understanding of how humidity levels affect the charging process between two solid surfaces, which is even enhanced up to RH = 90% as long as the curved surface is hydrophilic, paving the way for designing novel and more efficient TENGs, eco-energy harvesting devices which utilize water and solid charge interaction mechanism, self-powered sensors, and tribotronics.
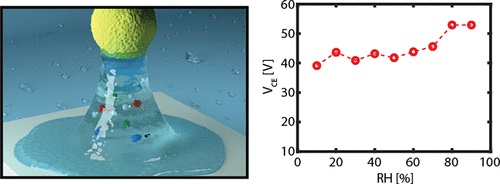
1. Introduction
Contact electrification (CE) or triboelectric charging is the process of exchanging electrostatic charges when two surfaces are in contact. However, the exact mechanism at the heart of this phenomenon is still under debate. For insulators, even the nature of the charge carrier associated with contact charging has not been settled. Basically, three kinds of charge transfer mechanisms are proposed: (i) electron transfer, (ii) ion transfer, and (iii) transfer of material. The reason that a unifying mechanism explaining the tribocharging is missing can be ascribed to the fact that the electrostatic interactions between surfaces are highly complex as they hinge on material, size, electrical properties, surface properties, and relative humidity (RH) as well. Understanding the contact electrification mechanism at the micro- and nanoscale is pivotal, as it is currently leveraged in many energy applications, e.g., in triboelectric nanogenerators (TENGs), introduced by the Wang group in 2012, which received great attention as a new energy harvesting application, such as mechanical energy harvesting, self-powered sensing, and tribotronics. Since TENG-based portable and wearable electronic devices will usually operate in varying environmental conditions across the globe, relative humidity is one of the most studied factors that affect tribocharging. The power output is enhanced with increasing RH until reaching a material-dependent optimum that typically lies around 40% RH. Above this optimum, the electric output decreases with increasing RH, which can be ascribed to water present at the interface. As the RH changes, water molecules adsorb on the surface, transforming the contact configuration from a single solid–solid interface to a double solid–liquid interface. Consequently, the charge transfer mechanism also changes; from electron transfer (at solid–solid interactions) to a combination of both electron and ion transfer (at solid–liquid interfaces). Given that water has the ability to charge solid surfaces upon contact, it is thriving as a promising strategy for the massive development of solid–liquid TENGs, droplet-based TENGs, moisture-enabled electric nanogenerators, and generation of hydrogen peroxide, to harvest green and renewable electricity from the abundantly present water on Earth. A key obstacle when studying solid–liquid–solid interacting configurations is that surfaces tend to stick to one another when only hydrophilic surfaces are involved at high humidity levels. Consequently, surfaces can not be released, and the electrostatic charging process at high humidity levels is challenging, if not impossible. To overcome this limitation, we utilize the colloidal probe technique for the first time to investigate the electrostatic interaction induced by CE by immediately measuring less than 1 s the contact electrification voltage between a hydrophilic silica or hydrophobic polystyrene colloidal probe and various hydrophilic uncoated or hydrophobic fluorocarbon-coated substrates as a function of the relative humidity up to 90%. In most material combinations, a clear increasing dependence is observed between the contact electrification voltage and increasing RH. In contrast to previous studies also above the typical optimum of 40–50% RH, an increase in contact charge is observed in this study when the spherical probe is hydrophilic as opposed to when a flat surface in the form of a plateau tip is used. From a fundamental perspective, this is a valuable result as it is indicative of a mechanism in which patches on surfaces contribute to contact electrification, as plausibly wet and dry patches are present on the curved colloidal probe leading to an enhancement of the electrostatic interaction between hydrophilic colloidal probes and flat substrates. On the application side, our results are obtained in a similar fashion as contact-separation (CS) operating TENG devices, CS-TENGs, are in agreement with other studies that show that the performance of TENG devices can be enhanced in high humid conditions (RH = 90%) when hydrophobic sliding friction layers in DC TENGs are used, or cellulose-based surfaces. In addition, the influence of the contact time on the charging behavior between the two materials is investigated, showing that not only the charge relaxation time constant is dropping with RH but also the time constant of charging. In contrast to room-temperature experiments, measurements performed at elevated temperatures close to the water’s boiling point showed that the charging is constant and lower than that at room temperature. The work presented here explores the contact electrification of a dynamically changing solid–liquid–solid interface and addresses the pressing matter of the influence of surface water on the charging process of DC TENGs, very recently posed by Lyu and Ciampi and other energy harvesting applications exploiting the water–solid electrification mechanism.
2. Experimental Section
Force spectroscopy (FS) was performed with a dimension icon atomic force microscopy (AFM, Bruker) to obtain force–distance curves (F(D)). In this mode, the colloidal probe performs an approach and a retraction cycle at each point on a user-defined grid (see Figure 1a, in most cases 12 × 12). It enables precise control over the applied loading force (FL), the approach velocity (va, which is equal to retraction velocity and cannot be varied independently), and the dwell time (td), where the latter two determine the total contact time (tc) between the colloidal probe and the surface. The measurements were performed with silica and polystyrene colloids with a diameter of 10 μm (NCH-silicon-SPM-sensor with colloidal particle, type: CP-NCH-SiO-D, NanoAndMore). For the parallel plate geometry, a plateau tip with a diameter of 1.8 μm is used (PL2-NCLR, Nanosensors). The substrates used in this study are hydrophilic SiO2 and glass (borosilicate glass or Mempax) and hydrophobic CFx (2 ≤ x ≤ 3, fluorocarbon) coating of 50–75 nm. (3) The relative humidity was tuned by an in-house-built control setup (Figure S2). The temperature and humidity were measured using a humidity sensor (SENSIRION EK-H4 SHTXX, Humidity Sensors, Eval Kit, SENSIRION, Switzerland), with an accuracy of 1.8% between 10 and 90% RH. Prior to every measurement cycle, the sample was heated at 100 °C in a N2 environment to ensure that all water is removed from the surface. Subsequently, the RH was adjusted in the chamber, and we waited for 2–3 h before the experiments were performed. If not indicated within the text, the measurements were performed at room temperature (20 ± 1 °C). The acquired data was processed using a Matlab script, with extracted values for the adhesion force (Fa), snap-out distance (Dso), distance to zero-force (Dzf), indentation (δ), and the contact electrification voltage (VCE). Two modes were used to measure the tribocharging process with the colloidal probe: the aforementioned force spectroscopy and single-contact charging. In the latter mode, the tip is repeatedly brought into contact at the same location. 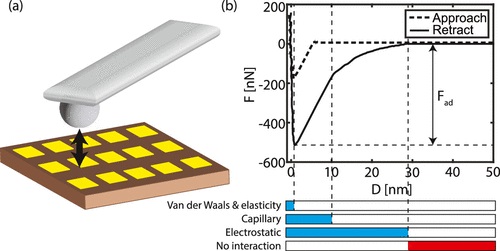
Figure 1. (a) Schematic representation of the colloidal probe method. An AFM cantilever with a colloidal probe is approached and retracted from the substrate resulting in a force–distance (F(D)) curve. (b) Typical force–distance (F(D)) curve between a silica colloidal probe and a glass substrate. The blue bars represent the relevant type of interaction force when the colloidal probe has been released at a distance D from the flat substrate, while the red bar signifies the range where all interactions vanish.
3. Relevant Interaction Forces
Figure 1b depicts a representative force–distance (F(D)) curve recorded during the approach and retraction phase of an experiment performed with a silica colloidal probe and a glass substrate. When approaching, the probe jumps into contact with the substrate because the force gradient (mostly the van der Waals force) is larger than the effective elastic constant of the cantilever. During the retraction phase, when the colloidal probe is released from the substrate, the colloid particle experiences different adhesion-type forces, as indicated by the blue bars in Figure 1b. The total adhesion force Fad consists mainly of (i) the van der Waals force (FvdW), (ii) the contact mechanics force (Fcontact), (iii) the capillary force (Fcap), and (iv) the electrostatic force (Fe). An animated video is available for a more elaborate explanation of the Supporting Information. The Hamaker model is used to calculate the van der Waals force through
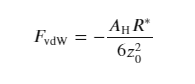
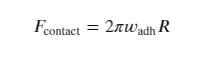
where wadh is the energy change when separating two bodies in contact.
When two hydrophilic surfaces are in close contact, the inevitable water layer at the interface forms a meniscus between the two bodies, even at a low relative humidity. Consequently, the adhesion force is enhanced and can be described as a capillary force (Fcap),
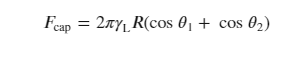
where γL is the surface tension of water, and θ1 and θ2 are the contact angles of the liquid bridge on the two bodies.
All of the distinct forces between two bodies in air are attractive in nature, except the Coulomb force (Fe or electrostatic force), which can lead to either attractive or repulsive interactions. For the specific contact geometry used in this experiment (cantilever and colloid on a flat surface), the electrostatic force is given by.
4. RH Dependence on the Adhesion and Electrostatic Interaction
Figure 2a shows two typical F(D) curves for a hydrophilic silica colloid on a hydrophilic glass and hydrophobic CFx surface. It can be noticed that the two approach curves obtained on the two different substrates are similar. In both cases, the probe jumps onto the surface. FvdW is approximately equal for both surfaces, and therefore the approach curves are almost identical (see Table S2). Clear differences are observed between the retraction curves obtained on the two distinct surfaces. First of all, the capillary bridge formed between the hydrophilic silica colloid and the glass surface accounts for the higher adhesion measured on the hydrophilic surface. The thin layer of water vapor adsorbed on both surfaces induces the formation of a liquid meniscus that hinders tip detachment from the surface due to the high surface energy. The linear regime (D < 10 nm) marks the rupture of the capillary bridge in the retraction curve. This regime is missing in the measurement on the hydrophobic CFx surface as a capillary bridge is absent between the hydrophobic surface and the hydrophilic colloidal probe, reducing the adhesion force. Second, a long-range, noncontact interaction is present, which decreases for larger D, independent of the surface property. This behavior signifies the presence of a Coulomb force acting between the two surfaces that is induced by the contact electrification mechanism (eq 4). However, as discussed later, the magnitude of the electrostatic interaction is different for glass and CFx.
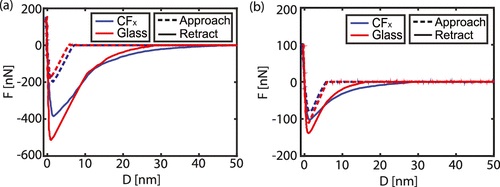
Figure 2. (a) Force–distance (F(D)) spectroscopy curves of a silica (SiO2) colloidal probe on the CFx-coated (blue) and uncoated glass (red) substrate, respectively. The spectra are acquired at room temperature and 30 % RH. (b) Similar to (a) but here performed with a polystyrene colloidal probe. The dashed (solid) line is the approach (retraction) curve.
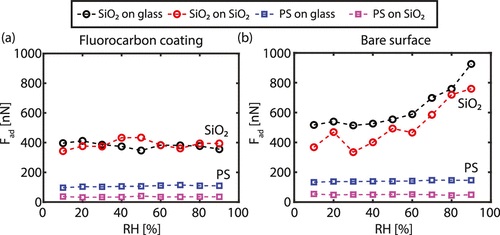
Figure 3. Dependence of the adhesion force (Fad) on the relative humidity (RH) for a silica (SiO2) and polystyrene (PS) colloidal probe on (a) a CFx-coated SiO2 or glass substrate and on (b) a pristine SiO2 or glass substrate. The dashed lines connect the data points for clarity. The data including error bars is represented in Figure S9.
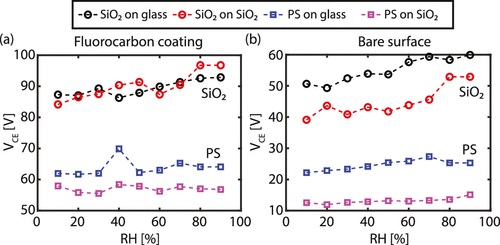
Figure 4. (a) Contact electrification voltage (VCE) vs the RH between the CFx-coated SiO2 and glass surface and a silica and polystyrene probe, respectively. (b) VCE vs the RH between the pristine surface (SiO2 or glass) and a silica and polystyrene probe, respectively. The data including error bars are presented in Figure S10.
5. Charging Mechanism of Hydrophilic and Hydrophobic Surfaces When Water Is Present
5.1. Influence of Temperature and Geometry
To corroborate that the presence of water indeed influences the triboelectric charging process, the experiment performed using a silica colloid on a CFx surface is repeated at elevated temperatures. In Figure 5a, the dependence between the contact electrification voltage as a function of RH is shown for different temperatures. In this particular case, it is previously shown that the VCE value increases when the humidity level in the chamber rises (cf. Figure 4a) at room temperature. However, when the temperature of the substrate is raised to 100 °C, VCE, and thus the electrostatic interaction remain constant while the RH is varied. Thus, this confirms that the presence of a water layer has a strong effect on the triboelectric charging process. At 100 °C, the majority of the absorbed water is removed from the substrate and therefore cannot contribute any longer to the ion exchange process.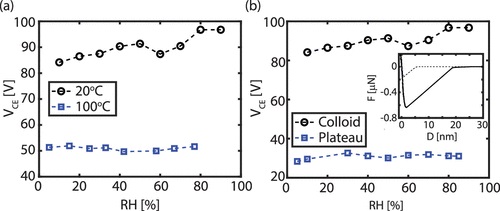
Figure 5. (a) Contact electrification voltage (VCE) vs the RH between the CFx-coated SiO2 surface and a silica colloidal probe when the surface is kept at a temperature of 20 and 100 °C. The black line is the same data set as depicted in Figure 4. A clear difference is observed when the temperature is raised near the boiling point of water, removing the water component from the system. (b) VCE vs RH between the CFx-coated SiO2 surface and a silica probe with a spherical (10 μm colloidal probe) and a flat (1.8 μm plateau tip) geometry. No dependence is observed between the contact electrification voltage and RH when a plateau tip is used. Inset: Characteristic F(D) curve for a plateau tip on CFx surface.
5.2. Single-Contact Charging
The absence of charge effects in the approach curves indicates that triboelectric charging and discharging occur on a shorter time scale. In order to investigate the time scale with which charging and discharging occurs, additional measurements have been performed with different approach and retraction velocities (va) as well as varying dwell times (td) (see Section S3 in the Supporting Information for more information). Both parameters influence the contact time (tc), which is the total time the colloidal probe and the surface can exchange charge across their interface in contact. Therefore, the contact time mainly depends on td and is only influenced by va at low velocities. Note that in the employed experimental strategy, the contact electrification voltage is measured only after a certain separation (D ≈ 20 nm) between the silica probe and substrate is reached, implying that the probe has already discharged some of its gained charge to the surroundings, particularly at low retraction velocities.
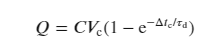
with Q the contact charge, C the electrical capacity, tc the contact time, τd the time constant of charging, and Vc the potential when in contact. As VCE ∝ Q/C, hence, eq 5 can be applied to the experimental data depicted in Figure 6a. An excellent agreement is obtained between the data and the model described in eq 5.
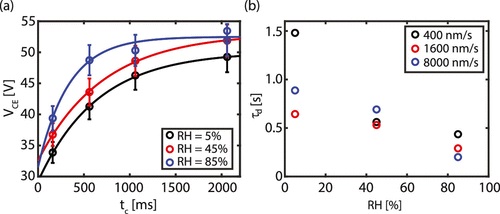
Figure 6. (a) Contact electrification voltage (VCE) vs contact time (tc) for different relative humidities at a retraction velocity of va = 1600 nm/s for a silica colloid in contact with the CFx layer. The solid line is the model described by eq 5. Standard deviations are based on the averages of at least five independent experiments. (b) Extracted charging time constant (τd) for different retraction velocities as a function of relative humidity.
6. Conclusions
Autonomous nanorobots with powerful thrust under dry solid-contact conditions by photothermal shock
Zhaoqi Gu, Runlin Zhu, Tianci Shen, Lin Dou, Hongjiang Liu, Yifei Liu, Xu Liu, Jia Liu, Songlin Zhuang & Fuxing Gu
Nature Communications volume 14, Article number: 7663 (2023)
doi: https://doi.org/10.1038/s41467-023-43433-6
Abstract
Nanorobotic motion on solid substrates is greatly hindered by strong nanofriction, and powerful nanomotors‒the core components for nanorobotic motion‒are still lacking. Optical actuation addresses power and motion control issues simultaneously, while conventional technologies with small thrust usually apply to fluid environments. Here, we demonstrate micronewton-thrust nanomotors that enable the autonomous nanorobots working like conventional robots with precise motion control on dry surfaces by a photothermal-shock technique. We build a pulsed laser-based actuation and trapping platform, termed photothermal-shock tweezers, for general motion control of metallic nanomaterials and assembled nanorobots with nanoscale precision. The thrust-to-weight ratios up to 107 enable nanomotors output forces to interact with external micro/nano-objects. Leveraging machine vision and deep learning technologies, we assemble the nanomotors into autonomous nanorobots with complex structures, and demonstrate multi-degree-of-freedom motion and sophisticated functions. Our photothermal shock-actuation concept fundamentally addresses the nanotribology challenges and expands the nanorobotic horizon from fluids to dry solid surfaces.
Introduction
Robots, the machines that sense, think and act, bring lots of convenience to humanity, while nanorobots represent revolutionary technologies in the future1. Powerful nanomotors is essential for nanorobots to propel themselves, move components or manipulate external objects. At nanoscale, the interaction between two objects in contact is governed by interfacial adsorption and friction, which are induced by van der Waals forces and much stronger than gravity and inertial forces. Conventional nanomotor technologies utilize thrusts from the momentum of particles in the ambient medium, such as photophoretic force, thermophoretic force, optothermal trapping force and chemical fuel (catalysis) propulsion force, and convection-induced force, and they usually produce small thrust (~10−12 N). Overcoming nanofriction (~10−6 N) on dry substrates or component contact is a critical challenge, which cannot be directly realized by these technologies, and thus previous researches mainly investigate nanomotors or nanorobots in fluid environments. Meanwhile, the thrust generated by widely used optical tweezers, originating from momentum transfer of photons, is also too small (~10−12 N) to overcome the interface friction15 (Supplementary Note 1), so their applications are also limited to the fluid environments. The lack of powerful thrust from nanomotors‒the core components of nanorobots for locomotion, is inhibiting various potential applications of nanorobots on dry solid-contact conditions where space or mass is limited, such as endoscopies, space operations, and microdrone missions. Despite advances in reducing nanofriction through surface lubrication (e.g., solid-liquid phase transition) and contact minimization (e.g., curved surfaces), the applicable actuation conditions are relatively limited due to the requirement of specific conditions and complex structures, and none further demonstrate motion control and outputting forces against external loading, which are essential capabilities for robots. Fundamentally, a general actuation technology endowing nanomotors with sufficient thrust can solve the nanofriction barriers, which is urgently needed for practical applications but remains unsolved.
According to Newton’s second law of motion and impulse-momentum theorem, large forces (F, Fig. 1a) or accelerations (a) can be induced by short excitations (Δt), such as collisions, shocks or explosions. In particular, under excitation by high-intensity pulsed lasers, transient thermal expansion will exert an impulsive load inside objects, i.e., photothermal shock. Objects are often driven by exciting their inherent vibration modes. In contrast, due to the transient and high-energy nature of laser pulses, the initial impulsive excitation of the shock load deposits sufficient energy inside the object to produce forces or accelerations that are considerably greater than those generated by the later-established stable vibration modes, similar to the large acceleration of snakes when striking relative to their slow crawling locomotion (Fig. 1a, inset). Furthermore, through local or nonuniform excitation of nano-objects, asymmetric spatiotemporal distributions of forces or accelerations may break the symmetry in frictional contacts and generate net displacements. 
a Schematic comparison between the forces produced by shock-induced transient vibrations and later-established stable elastic vibration modes, which can be roughly described by the two motion types (inset) of a snake quickly striking (top) and slowly crawling (bottom). b Schematic depicting a tilted nanowire rotating on a substrate. c Sequential superimposed motion track of a 3.7-μm-length nanowire leaving from the spot center and rotating, confirming a trapping behavior. d Time-dependent simulation results of temperature, horizontal velocity, and interfacial force. Two typical positions denoted PContact and PTilted are located 7 nm and 2.5 μm away from the contact end on the nanowire axis, respectively. The thermal shock duration is divided into two stages, prepeak and postpeak, which are bounded by the laser peak (red line at 15 ns). e–h Schematic depicting the motion mechanism. The initial transient thermal expansion (e) pushes the contact end slightly towards the lower left, but pushes the tilted end towards the higher right, which freely expands with a large acceleration and produces a strong Fint (f). Simultaneously, the nanowire axis is adjusted by FNgrd (g). Under the synergistic action of Fint and FNgrd, the nanowire rotates along the iso-intensity line (h). The unlabeled arrows on either side of Fint (f) and FNgrd (g) represent their respective components. Source data are provided as a Source data file.
In this work, we demonstrate a simple and general actuation technique that endows nanomotors with powerful thrust, based on this photothermal-shock concept. We use conventional metallic nanomaterials including nanowires and nanoplates as nanomotor prototypes, due to the high photothermal conversion capabilities. We build a pulsed laser-based actuation platform, termed photothermal-shock tweezers (“Methods” and Supplementary Fig. 1), which can trap micro/nano-objects in light spots that like conventional optical tweezers, and thus are capable of precise motion control of micro/nano-objects. Previous reports have only completed actuation but lacked higher-dimensional motion control, or completed the motion guidance of collective particles but lacked the precise motion control of individual particles. Our technique features unique trapping behavior, and simultaneously addresses the challenging issues of actuation and motion control, enabling nanomotors locomoting with the guidance of light spots and thus free two-dimensional motion control on dry solid surfaces. Furthermore, our nanomotors can output forces against external loading and be combined with artificial intelligent motion control for autonomous nanorobot applications, such as carrying cargo, moving onboard components, in situ sensing, assembling artificial molecules, and cleaning up nanodroplets.
Results
Actuation and motion control
To investigate the motion mechanism under various contact conditions, metallic nanomaterials were randomly dispersed on silica substrates (Supplementary Fig. 2). We first investigated the simplest point-contact condition with a gold nanowire tilted on a silica substrate (Fig. 1b). The dihedral angle at the end34,35 allowed the nanowire to adhere stably to the substrate with a tilted angle (Supplementary Fig. 3). Under 532-nm-wavelength irradiation with a spot diameter (Dspot) of 10 μm, a repetition frequency (Rrep) of 100 Hz and an average power (Pave) of 0.5 μW, a 3.7-μm-length nanowire quickly left the light spot center and then moved clockwise in a quasi-circular motion (~6.5 μm in diameter) after reaching an equilibrium position (Fig. 1c and Supplementary Movie), confirming a trapping-like behavior. The average velocity of the quasi-circular motion was ~0.5 μm s−1, corresponding to a step resolution of ~5 nm per pulse.
The tilted nanowire operated as a rotational nanomotor confined around the spot, but such a trapping-like motion property cannot be explained by the theory of elastic waves21,25 or light momenta15,30,32. Simulations (“Methods” and Supplementary Fig. 3) show that upon initiation of thermal shock (prepeak), the highest temperature occurs at the nanowire contact end (Fig. 1d), rising ~150 K near the pulse peak. The induced thermal expansion towards the lower left is hindered by friction (Fig. 1e), while the expansion pushes the semi-suspended upper part towards the upper right at high accelerations (107 m s−2, Fig. 1d) and strain rates (105 s−1). During the second half of the laser pulse duration (postpeak), the upper part maintains the initiated motion due to inertia (Fig. 1f). Even if the nanowire mass is very small (~10−12 g), such a large acceleration produces a strong thermal inertia force (Fint) that pulls the contact end, similar to thermal inertia motors36. The horizontal component of Fint can overcome the maximum stiction and pulls the contact end to slide towards the tilted end, with the vertical component decreasing the contact force and thus maximum stiction (Fig. 1f). After the thermal shock, the tilted end continues vibrating (Fig. 1d and Supplementary Movie), but the forces induced by established elastic vibration modes are too weak to overcome the friction. The calculated forward net displacement of the nanowire is ~1.2 nm per pulse, which roughly agrees with the experimental result.
Under the action of Fint, the nanowire will only step straightly in its tilted end direction. There should be another force causing tilted nanowire to rotate around the light spot. Due to the presence of light intensity gradient, the nanosecond pulsed light spot induces the nanowire to generate a transient temperature gradient, which produces an additional thermal gradient force (Fgrd, Fig. 1g), given by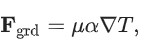
where μ is Lamé’s second coefficient, α is thermal expansion coefficient, and ∇T is the temperature gradient. We can regard Fgrd as an impulsive excitation in transient forced vibration, governed by a modified dynamical equation of thermoelasticity![]()
where ρ is the density, u is the displacement vector and ü denotes the second time derivative of u. When a tilted nanowire is in the light spot center, the thermal inertia force is large, but the thermal gradient force is small, so the nanowires move almost in a straight line and the direction change is small. Fgrd is actually the force density (per unit volume), and the total force is represented by FNgrd, which is derived from volumetric integration of Fgrd on the specific region of the nanowire. As shown in Fig. 1g, FNgrd contains a component towards the more heated contact end and another component towards the light spot center. Therefore, by the principle that Fint provides the stepping force and Fgrd provides the direction control force, the nanowire can adjust its axis perpendicular to the light intensity gradient to make the step and direction adjusting angle of the nanowire under a single pulse meet the conditions of circular motion as it moves (i.e., along the iso-intensity line, Fig. 1h), resulting in a stable quasi-circular motion. Using an orbit-by-orbit method or moving the laser spots directly, the tilted nanowire can locomote anywhere on the substrate (Supplementary Fig. 4 and Supplementary Movie).
We then investigated the line-contact condition of nanowires lying on a substrate (Fig. 2a). Upon irradiation (Pave = 0.9 μW, Dspot = 8.6 μm) at one end, a 10.1-μm-length gold nanowire moved into the light spot until their centers roughly coincided (Fig. 2b and Supplementary Movie). The average velocity exhibited a slow-fast-slow pattern (Fig. 2c, ~1.3 nm per pulse in the linear range), which is consistent with the gradient distribution of the spot intensity. Under the excitation of higher Rrep, this process will be significantly accelerated. Unlike the tilted nanowire that always moves towards the cooler end (tilted end direction), the lying nanowire always moves toward the hotter end, indicating that the lying nanowires are not pulled by Fint. For the lying nanowire, the thermal shock near the hotter end (Fig. 2d and Supplementary Fig. 5) does not have time to affect the colder end via thermal or mechanical conduction. FNgrd is not counteracted in time by the propagation effect (described by FNpro, the volumetric integration of –μ∇2u) in the nanowire (Supplementary Movie). The remaining part (colder end) of the nanowire is governed by static friction and thus remains relatively stationary with the substrate. As a result, the nanowire centroid accelerates (108 m s−2) towards the hotter end due to the net force with a strain rate up to 105 s−1. After the thermal shock, the nanowire gradually tends to thermal equilibrium, and in this process the nanowire centroid displacement slightly decreases, but it can be ignored compared with the huge advancing displacement during the thermal shock (Supplementary Fig. 5). Therefore, the net centroid displacement of the nanowire is realized under a single pulse. It is worthy to point out that we can describe the shock driving mechanism either by the volumetric forces (FNpro and FNgrd), or by the boundary condition (friction), so friction indeed plays a crucial auxiliary role in the driving process. The calculated displacement forward is ~3 nm per pulse, which roughly agrees with the experimental result.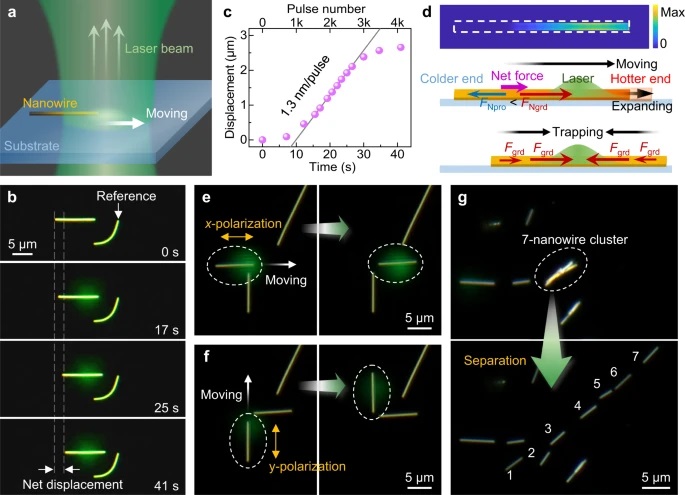
a Schematic describing the trap-like behavior of a nanowire lying on a substrate in the light spot. b Trap-like process of a 10.1-μm-length nanowire into the spot center. c Time-dependent experimental displacements in (b), with a linear range of 0.13 μm s−1, corresponding to 1.3 nm per pulse. d Schematic describing the basic control mechanism. Top: normalized heat absorption distribution (Max: 5.0 × 10¹⁷ m–3) on the nanowire bottom surface. Middle: the nanowire moves towards the hotter end when subjected to one-side thermal shock, with a net force induced by FNgrd exceeding FNpro. Bottom: under repeated pulses, the nanowire is finally trapped in the spot center, with the Fgrd values of each part balanced. The green shaded areas represent the Gaussian-like light spot. e, f Selective control of two orthogonal nanowires (marked in dashed ellipse) by using e x- and f y-axis polarized lasers (labeled by the yellow bidirectional arrows), respectively. The white arrows represent the moving direction of the nanowire under the guidance of the laser beam. g Separation of a 7-nanowire cluster (top) into individual nanowires (bottom), by moving the light spot forward and back along the axis of nanowires. Source data are provided as a Source data file.
The nanowire is covered by two spot regions with opposite light gradients, so it is subject to opposite thermal gradient forces simultaneously. As the nanowire is penetrating into the light spot, the thermal gradient forces opposite the advancing direction is increasing. Therefore, under repeated laser pulses, the nanowire continues locomoting into the light spot until their centers roughly coincide, when the distributions of Fgrd on the nanowire are balanced (Fig. 2d). As the substrate is slightly moved in the axial direction, the nanowire remains trapped in the light spot center, and thus slide to the center of the light spot, which realizes motion control of the nanowire by guardian of the spot. The lying nanowire acts as a linear nanomotor. In addition, benefiting from polarization-dependent absorption37, gold nanowires can move more easily by light polarized parallel to their axis rather than the perpendicular polarized, which is helpful for selectively controlling nanowires with different orientations (Fig. 2e, f). For nanowires that are stuck together, such as a 7-nanowire cluster depicted in Fig. 2g, each nanowire can easily be separated by simple pulsed lasers irradiation and moving the light spot forward and back along the axis of nanowires (Supplementary Movie). Furthermore, the nanowires were observed to bounce off the substrate at relative high intensity of the pulsed laser (Supplementary Movie).
As Pave was increased to 1.2 μW, we observed that the nanowire trapped in the spot center bent along the iso-intensity line (Fig. 3a, b and and Supplementary Movie), which cannot be explained by elastic waves as well. The thermal gradient forces still exist, and they squeeze the nanowire towards the center at both ends respectively. The nanowire is stable in the axis direction, but unstable in the lateral direction. If the nanowire and the spot are not strictly coincident, or the nanowire itself has certain initial lateral bending, the nanowire will deviate from the equilibrium and rapidly bend, allowing the nanowire to overcome friction laterally and bend along an iso-intensity line (Fig. 3c). As the substrate is slightly moved towards the opposite bending direction, the nanowire remains bending along the iso-intensity line and laterally slides, which realizes the lateral motion control of the nanowire under repeated pulses (Fig. 3d). We found that the minimum Pave required for actuating nanowire was ~0.3 μW (corresponding to a pulse energy of 3 nJ, Supplementary Fig. 6), which is at least 4 orders of magnitude lower than that used in conventional optical tweezers. Thus, we have realized the basic motion control of nanowires, by which more complex motion can be accomplished such as steering of nanowire axis. For example, we used multiple gold nanowires to assemble the English word SHOCK and its corresponding Chinese character CHONG (Fig. 3e, f), suggesting the possibility of realizing group motion control of multi-nanowires by multiple laser beams simultaneously.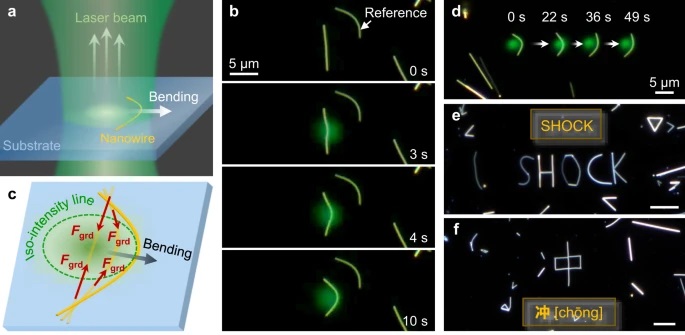
a Schematic describing lateral bending of a nanowire in the spot center. b Bending process of the nanowire (same as in Fig. 2b) as Pave increased. c Schematic describing the lateral motion mechanism. d Superimposed photographs of a nanowire at four sequential moments, with the nanowire moving laterally for a long-distance and the background remaining unchanged. e, f Photographs showing the English word SHOCK (e) and its corresponding Chinese character CHONG (f) assembled with multiple nanowires. Scale bar, 5 μm.
Our technique based on photothermal shock is general and versatile by changing some configurations, such as target geometries, target materials, actuation wavelengths, spot shapes, and substrate materials. For surface-contact conditions, such as nanoplates on the substrate, although nanofriction is much higher, nanoplates can be trapped and controlled by increasing Dspot or increasing Pave. Except for gold, we achieved driving for palladium (Pd, Supplementary Fig. 7 and the next section) and silver (Supplementary Movie). We also utilized spatial light modulation to realize the manipulation by annular light spots (Supplementary Movie). In addition, we used different substrates to drive nanowires, such as magnesium fluoride, the silica substrate covered by monolayer MoS2 and the polystyrene substrate (Supplementary Fig. 9).
Practical intelligent nanorobots
The ability of nanomotors to output external forces is the key to the practical application of various motion types. The output force of nanowire nanomotors was measured by using one gold nanowire to laterally push another gold nanowire (Fig. 4a and Supplementary Movie), where the force was determined to be ~5 μN (Supplementary Fig. 2). Considering of the effective absorption area (~5%), and photothermal (30%) and thermal-mechanical (0.01%) energy conversion efficiency (Supplementary Fig. 8), the transient output power of this nanomotor was ~5 μW. The corresponding thrust-to-weight ratio was as high as 107, far exceeding those of any artificial machine or natural organism. In addition, the measured output force is ~0.1 μN for tilted nanowires, which is very suitable for working in tight spaces.
a Measurement of thrust output by using one gold nanowire to laterally push another gold nanowire. b AFM images showing a gold nanowire pushing two separated CdSe/CdS core–shell quantum dots (from the left white box region to the right one) and combining them. Insets: close-ups of the quantum dots. c Autonomous cleaning nanorobot using a gold nanoplate, which could maintain the target area (top, solid box) at a satisfactory cleanliness (bottom) through machine vision, deep learning, feedback control and path planning. d Scanning electron microscope image of the HOUbot nanorobot, assembled by a body (Pd nanoplate), a tail (Pd nanowire), and a sensor (CdSe nanowire). The cargo (ZnO micropillar) was immobilized on the nanoplate by UV adhesives. Inset, top view schematic of a Chinese horseshoe crab. e Basic vehicular motion. Inset: schematic describing motion control by radiating specific body regions. Intricate motion includes head pushing (f), tail stabbing (g) and tail wagging (h), two superimposed photographs). i In situ humidity sensing by using the CdSe nanowire lasing signals. As the humidity of the local environment changed periodically, the laser peak intensity (left inset) and spectra (right inset) changed accordingly. Source data are provided as a Source data file.
In some simple application scenarios, a single nanomaterial itself not only acts as a nanomotor, but also works independently as a complete nanorobot (Supplementary Fig. 7). For example, Fig. 4b shows the assembly of an artificial molecule by controlling a gold nanowire to push two quantum dots (~10 nm in diameter) together, achieving the same precision as that obtained in atomic force microscopy (AFM) operations.
Leverage existing machine vision technology, we can further endow our nanorobots with artificial intelligence. Here, by mimicking the operation mechanisms of cleaning robots that are widely used in the macro world, we demonstrated an autonomous cleaning nanorobot working in the microscopic world (Fig. 4c, Supplementary Fig. 10, and Supplementary Movie). Combining technologies such as machine vision, deep learning, feedback control and path planning, this nanoplate-based nanorobot could automatically clean up nanodroplets in a target area and keep this area clean. Such cleaning nanorobots may find future applications in non-invasive cleaning of microscopic areas, such as contaminated surfaces of photosensitive microchips or optical fiber end faces.
As mentioned in the previous section, the photothermal shock mechanism is universal as changing the actuation wavelengths and target materials. Here we can drive Pd nanomaterial using a 1064-nm-wavelength pulsed laser. Due to their relatively large surfaces, nanoplate-based nanorobots have a larger payload capacity, which allows them to be equipped with more onboard components or cargos by taking existing macro-mechanical designs and thus work like the macrorobots. To demonstrate this, through a bottom-up assembly approach, we utilized various components, including Pd nanoplates (body) and Pd nanowires (tail), and cadmium selenide (CdSe) nanowires (sensor), to assemble a nanorobot with complex structures (0.6 ng in mass, Fig. 4d and Supplementary Movie). Because the nanorobot resembles a Chinese horseshoe crab, we name it HOUbot. Theoretically, its payload can be on the order of milligrams (million times its mass, equivalent to an ant). Here we attached a ZnO micropillar (cargo, 2.3 ng in mass) with ultraviolet (UV) adhesives. By irradiating specific body parts, basic vehicular motion could be realized (Fig. 4e). The HOUbot could be used to manipulate other nano-objects through head pushing (Fig. 4f), tail wagging (Fig. 4g) and tail stabbing (Fig. 4h). Thus, the nanorobot could realize higher degrees of freedom and perform delicate tasks. Through optical pumping, the CdSe nanowire lasers40 could be used for in situ humidity sensing (Fig. 4i). Furthermore, our HOUbot was tested for over 10 million actuation pulse cycles with no noticeable signs of wear or performance degradation.
Discussion
We have succeeded in developing a general actuation technique to solve nanofriction obstacle by using photothermal shock, and by using the powerful nanomotors, we further realized autonomous nanorobots working like conventional robots with precise motion control. Our nanomotors exhibit the highest thrust-to-weight ratios thus far, while achieving nanoscale step accuracy, ultralow actuation power (~μW), and nanosecond-scale response time. Just like ignition (controllable explosions) in gasoline engines, our technique utilizes a shock-induced local expansion to convert thermal energy into mechanical energy, while nanofriction and heat dissipation play auxiliary roles in restoring the nanomotors for repeated work. This simple shock-actuation mechanism can be applied to almost any light-absorbing nanomaterials, and thus we revealed a field of transient thermoelastic dynamics at the nanoscale that can be utilized to design future nanomechanical structure.
By using the core component‒nanomotors with powerful thrust to address nanotribology challenges, our work paves the way to build practical nanorobots working on dry solid surfaces. The strong thrust allows nanorobots to be equipped with complex onboard structures, such as movable end-effectors, microelectronic chips, and sensors. At the same time, with optically actuating and motion controlling, we can directly leverage existing machine vision technology, by incorporating artificial intelligence, to develop advanced autonomous nanorobots in both hardware and software. Furthermore, through spatial light modulation and multi-robot collaboration, autonomous nanorobot swarms can be realized to perform more challenging tasks and unearth unprecedented application scenarios in various fields such as nanomanufacturing, biomedicine, and aerospace in the future.
Age-related matrix stiffening epigenetically regulates α-Klotho expression and compromises chondrocyte integrity
Hirotaka Iijima, Gabrielle Gilmer, Kai Wang, Allison C. Bean, Yuchen He, Hang Lin, Wan-Yee Tang, Daniel Lamont, Chia Tai, Akira Ito, Jeffrey J. Jones, Christopher Evans & Fabrisia Ambrosio
Nature Communications volume 14, Article number: 18 (2023)
Published: 10 January 2023
doi: https://doi.org/10.1038/s41467-022-35359-2
Abstract
Extracellular matrix stiffening is a quintessential feature of cartilage aging, a leading cause of knee osteoarthritis. Yet, the downstream molecular and cellular consequences of age-related biophysical alterations are poorly understood. Here, we show that epigenetic regulation of α-Klotho represents a novel mechanosensitive mechanism by which the aged extracellular matrix influences chondrocyte physiology. Using mass spectrometry proteomics followed by a series of genetic and pharmacological manipulations, we discovered that increased matrix stiffness drove Klotho promoter methylation, downregulated Klotho gene expression, and accelerated chondrocyte senescence in vitro. In contrast, exposing aged chondrocytes to a soft matrix restored a more youthful phenotype in vitro and enhanced cartilage integrity in vivo. Our findings demonstrate that age-related alterations in extracellular matrix biophysical properties initiate pathogenic mechanotransductive signaling that promotes Klotho promoter methylation and compromises cellular health. These findings are likely to have broad implications even beyond cartilage for the field of aging research.
Introduction
All cells in the human body are subject to mechanical influences. This is particularly true of articular cartilage, given that its primary role is to transmit forces to the underlying bone and decrease friction in the joint. However, these important functions are disrupted by the progressive cartilage deterioration that occurs with aging. In 1742, British anatomist William Hunter wrote that cartilage, “when destroyed, it is never recovered.”1. In most cases, cartilage damage eventually progresses to osteoarthritis (OA), which affects ~32.5 million Americans2. Although we have known of the poor healing capacity of cartilage for over 250 years, this limited capacity is both poorly understood and inadequately treated in the clinic.
The lack of successful non-surgical treatments for OA is attributed, in part, to: (1) gaps in our current understanding of whether pre-clinical OA models recapitulate human disease and (2) an incomplete knowledge of the molecular mechanisms driving disease development. This is particularly true for knee OA (KOA) since, in most cases, there is no clear inciting event, and the single greatest predictive factor for developing KOA is age3. To date, the majority of animal studies have utilized a post-traumatic model of OA (PTOA) in young male mice4. However, this post-traumatic model displays a distinct molecular signature when compared to age-associated KOA5. Thus, it is not surprising that the majority of pre-clinical findings in KOA have failed to translate to effective treatment for a population consisting largely of aged individuals with no joint trauma.
In this study, we first thoroughly characterized the trajectory of structural and proteomic changes associated with KOA in mice across the lifespan and according to sex. We directly compared these findings to our current understanding of KOA in humans. We next examined mechanistic drivers of KOA via a series of genetic and pharmacologic manipulations. Our findings identified the longevity protein, α-Klotho, as a regulator of chondrocyte health in both murine and human cartilage. Further interrogation using in vitro engineered models revealed that an age-related increase in matrix stiffness compromises chondrocyte integrity and declines α-Klotho expression. Notably, this inhibition of α-Klotho was attributed to Klotho promoter methylation that was concomitant with increased binding of DNA methyltransferase 1 (DNMT1). Finally, pharmacological reduction of cartilage stiffness in aged mice increased α-Klotho levels and restored cartilage integrity. Taken together, these findings suggest that age-related alterations in matrix stiffness initiate pathogenic mechanotransductive signaling cascades, leading to epigenetic repression of the Klotho promoter and compromised chondrocyte health.
Results
Aging-induced cartilage degeneration is accompanied by disruption of PI3K/Akt signaling in male, but not female, mice
We first thoroughly evaluated cartilage integrity in three age groups of male and female C57/BL6 mice: young (4–6 months), middle-aged (10–14 months), and aged (18–24 months). These age groups correspond to 20–30, 38–47, and 56–69 years of age in humans, respectively6. We focused on the medial tibial cartilage given this is the region most commonly affected by KOA in humans7.
Histological observations confirmed progressive cartilage degeneration beginning at middle age (Fig. 1A). This is in line with clinical reports of structural abnormalities that manifest in the cartilage of 45–60-year-old individuals8,9. To further examine cartilage degeneration over time, we quantified cartilage surface roughness by assessing the deviation of the cartilage surface from a fitted curve (Fig. S1A). As expected, surface roughness significantly increased with aging (Fig. S1B, C). Interestingly, the magnitude of cartilage degeneration and surface roughness was greater in male mice than in female mice (Fig. 1A, Fig. S1B, C). It is unclear why female mice appear to display relative protection against KOA. However, it is worth noting that serum estrogen levels were unchanged across the three female age groups, indicating that aged female mice do not experience the same menopausal phenotype seen in humans (Fig. S1D). Previous studies have demonstrated that ~65% of aged female mice spontaneously transition to a polyfollicular anovulatory state, ultimately displaying pre-menopausal estrogen and progesterone profiles10. Given that post-menopausal women typically present with more severe KOA than men11, our findings suggest that utilizing female mice without induction of menopause may not be reliable for modeling age-related KOA in human females.
Fig. 1: Male, but not female, mice display age-related cartilage degeneration and disruption of the PI3K-Akt signaling pathway.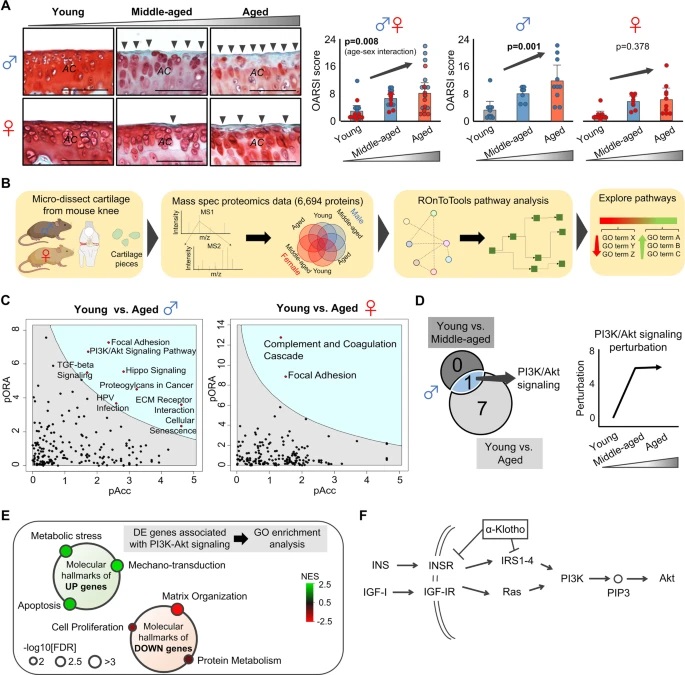
A Aging induced progressive cartilage degeneration in murine medial tibial plateaus in a sex-dependent manner. Representative histological sections stained with Safranin O/Fast Green are provided for each group. Black arrow heads indicate loss of cartilage matrix. The Osteoarthritis Research Society International (OARSI) score is provided (0–24 points; higher value indicates more severe cartilage degeneration), as assessed by a blinded assessor (male, n = 10 for young and aged, n = 7 for middle-aged; female, n = 10 for young and aged, n = 9 for middle-aged). Statistical analyses were performed using linear regression. Data are presented as means ± 95% confidence intervals. Scale bar: 50 μm. B Schematic showing the experimental protocol for mass spectrometry. Knee cartilage was microdissected from young, middle-aged, and aged male and female mice (n = 5/sex/age). Individual proteins were identified and used for KEGG pathways analysis. Proteins from PI3K/Akt signaling were then grouped based on GO terms. C Pathway analysis for young vs. aged in male and female mice. pAcc: the Boolean value of total bootstrap permutations accumulation; pORA: the Boolean value of over-representation p value. D Comparison between young vs. aged and young vs. middle-aged pathway analyses in male mice, and display of perturbation calculations. E Molecular hallmarks of upregulated and downregulated genes associated with PI3K/Akt signaling. F Schematic pathway of PI3K/Akt signaling and linking to α-Klotho. Portions of the figures were created with biorender.com. Source data are provided as a Source Data file.
We next performed mass spectrometry proteomics to identify potential signaling pathways associated with age- and sex-dependent cartilage degeneration. Articular cartilage was collected from young, middle-aged, and aged male and female mice (n = 5/age/sex; Fig. 1B). From these samples, we identified 44,689 peptides associated with 6694 unique proteins. Data are available via CalTechʼs Proteomics Repository (https://doi.org/10.22002/ee2yc-fg857; see Methods for details).
To gain a holistic understanding of the protein network-level changes in knee cartilage with aging and according to sex12, we performed Kyoto Encyclopedia of Genes and Genomes (KEGG) enrichment analyses13. Similar to histological observations, male mice displayed more changes in individual protein expression over time when compared to female counterparts. Whereas only two pathways were significantly enriched between young and aged cartilage samples in female mice, eight pathways were significantly enriched between young and aged cartilage samples in male mice (Fig. 1C). Of these, PI3K/Akt signaling was the only pathway that significantly changed over time starting at middle age (Fig. 1D). Further, total normalized perturbation (P), a measure of how much a pathway deviates from physiologic conditions (young mice served as our standard of physiological condition; Pyoung = 0)14, was elevated at middle-age (Fig. 1D). Taken together, these findings support previous reports highlighting disruption of PI3K/Akt signaling in human OA15.
Examination of individual proteins associated with PI3K/Akt signaling enrichment demonstrated distinctly upregulated and downregulated clusters of biological processes associated with aging. Specifically, gene ontology (GO) enrichment analysis revealed that upregulated proteins were associated with Metabolic Stress, Mechanotransduction, and Apoptosis, whereas downregulated proteins were associated with Matrix Organization, Cell Proliferation, and Protein Metabolism (Fig. 1E).
To expand our systems biology approach to include transcript level changes, we accessed archived RNA-seq data from young (3 months old) and aged (24 months old) C57BL6 mice16 and compared changes to those observed from mass spectrometry data. To do this, we first identified differentially expressed proteins between young and aged cartilage (yielding 1,057 proteins) and converted the identified proteins to their corresponding genes. When we compared the genes identified through mass spectrometry analysis with differentially expressed genes from young and aged transcriptomic data (yielding 3506 genes), we identified 125 overlapping genes (Fig. S2). KEGG enrichment analysis for the overlapping genes revealed that the PI3K/Akt signaling pathway was among the top five differential pathways.
Global knockdown of α-Klotho drives cartilage degeneration in male mice
We next probed for candidate proteins that may regulate the observed proteomic changes.
Ingenuity pathway analysis17 using mass spectrometry data predicted activated INS/INSR signaling as a significant regulator for age-related changes in proteins in male mice cartilage (Fig. S3). INS/INSR is upstream of PI3K/Akt signaling13. Therefore, we next sought to identify factors that inhibit the INS/INSR/PI3K axis. One key regulator of this pathway is the longevity protein, α-Klotho (Fig. 1F)18. A recent systematic review identified elevated inflammation, increased senescence, and impaired autophagy as common denominators associated with aging-induced KOA in mice19, all of which are downstream of α-Klotho20,21,22,23,24. When we accessed archived microarray data (GSE80285)25, we found that inhibition of α-Klotho protein significantly activated PI3K/Akt signaling in human primary chondrocytes in vitro (Fig. S4). While α-Klotho overexpression has been shown to delay cartilage degeneration in a PTOA model25, whether α-Klotho plays a role in age-related KOA model has not been definitively established.
In both mouse and human cartilage, we found that α-Klotho was both decreased with increasing age and associated with more severe cartilage degeneration in males (Fig. 2A, B; Fig. S5A, B). To establish a more direct role of α-Klotho on cartilage health, we evaluated cartilage integrity in mice heterozygous for the Klotho gene (Klotho+/−). Young and middle-aged Klotho+/− male mice displayed significantly accelerated cartilage degradation (Fig. 2C), consistent with an aged phenotype. However, accelerated cartilage degradation was not observed in female young and middle-aged Klotho+/− mice (Fig. 2C). Sex differences in cartilage degeneration in Klotho+/− mice were further supported by computational histological image analysis demonstrating that male Klotho+/− mice displayed higher cartilage surface roughness (Fig. S6A, B), mimicking the phenotype of aged wild-type male mice. Female Klotho+/− mice did not display any change in cartilage integrity compared to sex- and age-matched counterparts (Fig. S6A, B). These findings suggest that loss of α-Klotho may be a driver of age-related KOA in a sex-dependent manner. Given the limited KOA phenotype seen in aged female mice, only male mice were used for the subsequent experiments.
Fig. 2: Age-related declines in α-Klotho are associated with cartilage degeneration in male mice.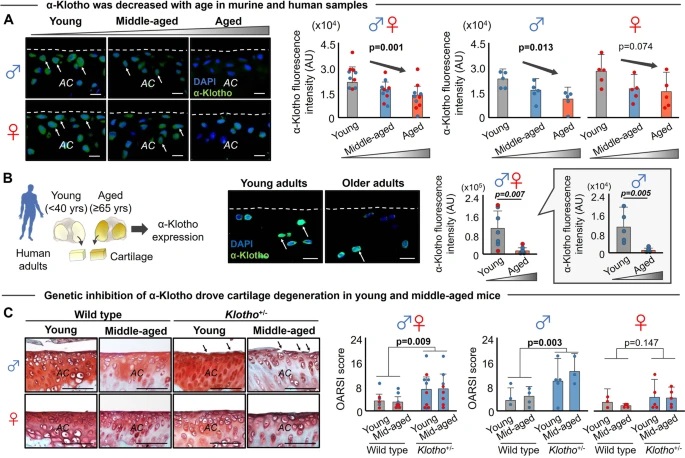
A Aging induced a progressive decline of α-Klotho in the murine medial tibia (n = 5/sex/age). White arrows indicate α-Klotho-positive chondrocytes. White dashed lines indicate cartilage surface. AC articular cartilage. Scale bar: 10 μm. α-Klotho expression per cell was quantified by immunofluorescence (50–100 cells per mouse). B Cartilage in older adults (≥65 years old; 71.9 ± 2.91 years; n = 7 [1 female]) displayed reduced α-Klotho expression compared to young adults (<40 years old; 27.6 ± 6.85 years; n = 7 [2 females]). Scale bar: 20 μm. α-Klotho expression per cell was quantified by immunofluorescence (30–70 cells per cartilage sample). C Loss-of function in Klotho (Klotho+/−) triggered murine cartilage degeneration in a sex-dependent manner (young, n = 7 for wild-type [3 females], n = 10 for Klotho+/− [5 females]; middle-aged, n = 10 for wild-type [5 females], n = 8 for Klotho+/− [5 females]). Black arrows indicate cartilage surface disruption. AC articular cartilage. Scale bar: 50 μm. Statistical analyses were performed using linear regression (A), two-way ANOVA (C), and a two-tailed Student t test (B). Age-sex interaction was not significant for α-Klotho expression in mice (A, p = 0.468). Data are presented as means ± 95% confidence intervals. Source data are provided as a Source Data file.
Age-related declines in α-Klotho are associated with alterations in nuclear mechanics of mouse and human chondrocytes
What drives a decline in chondrocyte α-Klotho expression over time? Our proteomic data revealed that mechanotransductive signaling was significantly disrupted in aged murine cartilage (Fig. 1C). This led us to question whether age-related declines in α-Klotho are a consequence of altered mechanical signals from the microenvironment. Aging is correlated with progressive alterations in nuclear mechanics and nuclear envelope dysfunction, driving chromatin remodeling and gene expression changes26,27. The nuclear envelope is primarily composed of a nuclear lamina (e.g., lamin A/C and lamin B) and a bilayer membrane through the linker of the nucleoskeleton and cytoskeleton complex. In particular, lamin A/C is a well-known regulator of nuclear integrity28,29. With this in mind, we revisited the mass spectrometry data to characterize age-related changes in nuclear envelope elements (Fig. 3A). We found that protein abundance of lamin A/C and lamin B2 was significantly increased in aged mice compared to young counterparts (Fig. 3B).
Fig. 3: Age-related α-Klotho decline is accompanied with nuclear morphological alterations.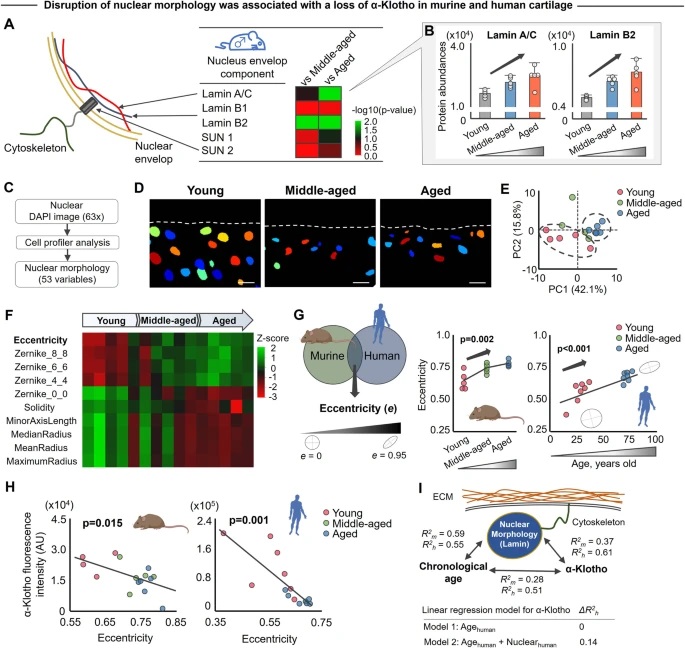
A Age-related changes in nuclear envelope proteins in male mice quantified by mass spectrometry-based proteomics. The heat map represents log10 (p value) of each protein, with >1.3 considered significant. B Aging increased lamin A/C and lamin B2 protein expression (n = 5/age). C Analytical flow of the nuclear morphological analysis (53 variables) using CellProfiler software. D Representative nuclear images in murine medial tibia generated by CellProfiler, which was reproducible in another set of images. Dashed white lines indicate the cartilage surface. Scale bar: 10 μm. E Principal component analysis (PCA) of nuclear morphology characteristics showing separation of clusters between young and aged animals (n = 5/age; 30–60 nuclei per individual mice). F Heat map of the top 10 nuclear morphological variables contributing principal component 1. G Murine (n = 5/age) and human cartilage (n = 7/age) share changes in nuclear eccentricity, with higher age associated with increased nuclear eccentricity (i.e., less roundness). H Age-related increased nuclear eccentricity is associated with decreased α-Klotho expression in murine (n = 5/age) and human cartilage (n = 7/age). I Schematic showing the relationship between chronological age, α-Klotho expression, and nuclear morphology. Linear regression model shows the substantial and independent contribution of nuclear morphology (Nuclearhuman) in the prediction of α-Klotho expression level in human cartilage beyond the effect of chronological age (Agehuman). Coefficient of determinations are provided for mouse (R2m) and human cartilage (R2h). Statistical analysis was performed using linear regression (B, G, H, I). Data are presented as means ±95% confidence intervals. Portions of the figure were created with biorender.com. Source data are provided as a Source Data file.
To further characterize age-associated alterations in the nuclear envelope, we quantified chondrocyte nuclear morphology in cartilage tissue using CellProfiler software30 (Fig. 3C, D). CellProfiler measures the size, shape, intensity, and texture of a variety of nuclear/cell types in a high throughput manner. Our study focused on 53 morphological variables representing nuclear shape and geometry. Principal component analysis (PCA) for 53 morphological variables revealed clear segregation of nuclei from young and aged chondrocytes in mice (Fig. 3E). Of the top 10 variables contributing to the first principal component (Fig. 3F), nuclear eccentricity (or sphericity) was found to be a highly sensitive nuclear morphological marker associated with aging in both murine and human samples (Fig. 3G). A detailed description for the top 10 variables is shown in Table S1. Notably, increased nuclear eccentricity (i.e., a less spherical nucleus) was also significantly associated with decreased α-Klotho protein levels (Fig. 3H). Further supporting the relationship between nuclear morphology and α-Klotho, the age-related increase in protein abundance of lamin A/C was not only associated with nuclear eccentricity (Fig. S7A) but was also inversely correlated with fluorescence intensity of α-Klotho (Fig. S7B). These results suggest that a decline in α-Klotho levels may be attributed to altered nuclear mechanics (Fig. 3I).
Increased matrix stiffness induces a decline in α-Klotho and an aged phenotype in young chondrocytes
The nucleus is mechanically coupled to the microenvironment where cytoskeletal elements regulate nuclear shape according to extrinsic ECM stiffness cues31,32. Similar to other tissues throughout the body33, cartilage stiffness in aged mice and humans is ~2–3 times higher than young counterparts34. Therefore, to evaluate the direct effect of increased ECM stiffness on chondrocyte phenotype, we seeded primary mouse chondrocytes onto polyacrylamide (pAAm) gels of different stiffnesses (5 kPa, 21 kPa, and 100 kPa; Fig. 4A)35. This stiffness range was selected to mimic physiologically-relevant ECM stiffnesses of young (1–30 kPa) and aged (50–100 kPa) murine and human knee cartilage34.
Fig. 4: Matrix stiffness regulates chondrocyte health via α-Klotho.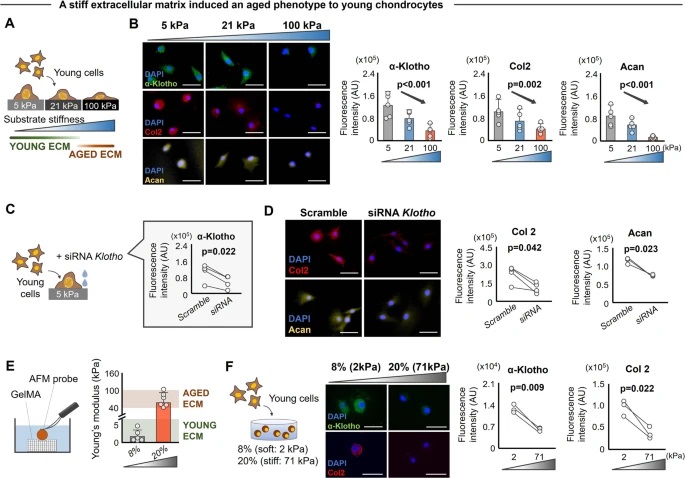
A Schematic showing the experimental protocol. Primary chondrocytes isolated from young murine cartilage were seeded onto polyacrylamide gels engineered to mimic a physiological range of cartilage matrix stiffness (5 kPa, 21 kPa, and 100 kPa). B. Stiff substrates reduced α-Klotho, type II collagen (Col2), and aggrecan (Acan) in young chondrocytes, as quantified by immunofluorescence (n = 5/group; 30–70 cells per individual sample). Scale bar: 50 μm. C, D siRNA Klotho treatment inhibited the beneficial effect of soft substrates on type II collagen and aggrecan expression, as quantified by immunofluorescence (n = 3/group; 20–40 cells per individual sample). Scale bar: 50 μm. E Measurement of matrix stiffness (Young’s modulus) for 8% and 20% GelMA (n = 6/group) using atomic force microscopy (AFM). Young’s modulus for young and aged articular cartilage was provided as reference values34. F A stiff 3D environment reduced α-Klotho, type II collagen, and aggrecan in chondrocytes quantified by immunofluorescence (n = 3/group; 30–60 cells per individual sample). Scale bar: 20 μm. Statistical analyses were performed using linear mixed effect model (B) or two-tailed paired t test (C, D, F). Data are presented as means ±95% confidence intervals. Source data are provided as a Source Data file.
Young chondrocytes cultured on stiff substrates developed an aged phenotype when compared to cells cultured on soft substrates, as evidenced by reduced type II collagen and aggrecan (Fig. 4A, B). These changes were accompanied by decreased α-Klotho protein levels (Fig. 4A, B). Conversely, aged chondrocytes cultured on soft substrates displayed increased type II collagen and α-Klotho compared to those cultured on stiff substrates (Fig. S8A, B). In these analyses, we confirmed that lamin A/C, but not lamin B2, was both highly sensitive to substrate stiffness (Fig. S9A, B) and positively associated with nuclear deformation (Fig. S9C, D); these results are consistent with previous reports31,32,36,37. Aged-like (stiff) substrates also increased stress fiber formation and altered chondrocyte cellular morphology (Fig. S10), thereby further implicating mechanotransductive signaling in the stiffness-dependent regulation of cellular phenotype. To directly test whether matrix stiffness regulates chondrogenicity via α-Klotho, siRNA to Klotho was added to young chondrocytes cultured on soft substrates (Fig. 4C). We found that siRNA inhibition of α-Klotho overrode the pro-chondrogenic effect of a soft matrix, as evidenced by a decrease in type II collagen and aggrecan expression (Fig. 4D).
Several studies have shown that ascorbic acid, an essential cofactor for lysyl hydroxylase and prolyl hydroxylase, is required for collagen biosynthesis in vitro38. Therefore, we performed a sensitivity analysis to determine whether the stiffness-dependent regulation of chondrogenicity markers (type II collagen and aggrecan expression) was influenced by the addition of ascorbic acid to the culture medium. We found that the expression of chondrogenic markers was not significantly influenced by the presence of ascorbic acid (Fig. S11A, B). When we assessed the secretion of type II collagen by chondrocytes under each of the experimental conditions (+/− ascorbic acid on soft, medium, or stiff substrates) using an enzyme-linked immunosorbent assay (ELISA), we found that chondrocytes cultured on stiff substrates secreted less type II collagen compared to those cultured on soft substrates, an effect that was independent from ascorbic acid supplementation (Fig. S11C). We note that the number of chondrocytes was similar across the groups, confirming that the reduced secretion of type II collagen on stiff substrates was not a function of differences in chondrocyte confluence (Fig. S11D).
To determine whether similar changes occur in a three-dimensional (3D) microenvironment, which more closely recapitulates the native microenvironment, we fabricated gelatin-based hydrogels (GelMA). Atomic force microscopy (AFM) was used to confirm that the stiffness of the engineered soft (2 kPa) and stiff (71 kPa) hydrogels approximated the stiffness of native young and aged cartilage, respectively (Fig. 4E). Consistent with our findings using a two-dimensional (2D) culture, young chondrocytes cultured in a stiff three-dimensional environment displayed reduced α-Klotho and type II collagen levels (Fig. 4F). Taken together, our 2D and 3D models suggest that soft substrates promote a more youthful phenotype in aged chondrocytes but that stiff substrates accelerate the effects of time in young chondrocytes.
Matrix stiffness epigenetically regulates α-Klotho expression in chondrocytes
It is well known that mechanical forces induce modulation of nuclear chromatin structures and epigenetic landscapes to impact gene transcription37,39,40,41. We, therefore, examined whether a loss of α-Klotho in response to stiff substrates is driven by epigenetic modifications. To do this, we measured methylation levels of the Klotho promoter in young or aged chondrocytes cultured on substrates with varying stiffnesses. Stiff substrates triggered methylation of the Klotho promoter and decreased Klotho gene expression in young chondrocytes (Fig. 5A). Conversely, soft substrates significantly reduced methylation and increased Klotho gene expression in aged chondrocytes (Fig. S12A). Culturing young and aged chondrocytes on stiff substrates also promoted global DNA methylation, though the magnitude of effect was considerably lower than the effect observed on the Klotho promoter (Fig. 5A and Fig. S12A). Stiffness-dependent methylation of the Klotho promoter was further supported by a corresponding increase in DNMT1 protein levels (Fig. 5B and Fig. S12B). DNMT1 is an enzyme that catalyzes the transfer of methyl groups to CpG dinucleotides, usually repressing gene transcription by altering chromatin structure and blocking the access of transcription factors at the gene regulatory region42. Further inspection by chromatin immunoprecipitation (ChIP) analysis revealed that increased ECM stiffness was associated with increased binding of DNMT1 at the Klotho promoter (Fig. 5C), suggesting that increased Klotho promoter methylation under conditions of a stiff microenvironment may be attributed, at least in part, to the increased binding of DNMT1. Of note, increasing ECM stiffness also showed a decreased binding of RNA Polymerase II (Pol ll) at the Klotho promoter, which was accompanied by decreased active chromatin mark (H3K4M2) and increased repressive chromatin mark (H3K9M2), (Fig. S13). These ChIP analyses support our general understanding that DNMT transcriptional changes are coupled with chromatin remodeling and an imbalance of activating and repressive histone modifications43.
Fig. 5: Epigenetic regulation of α-Klotho by stiff matrix disrupts chondrocytes health.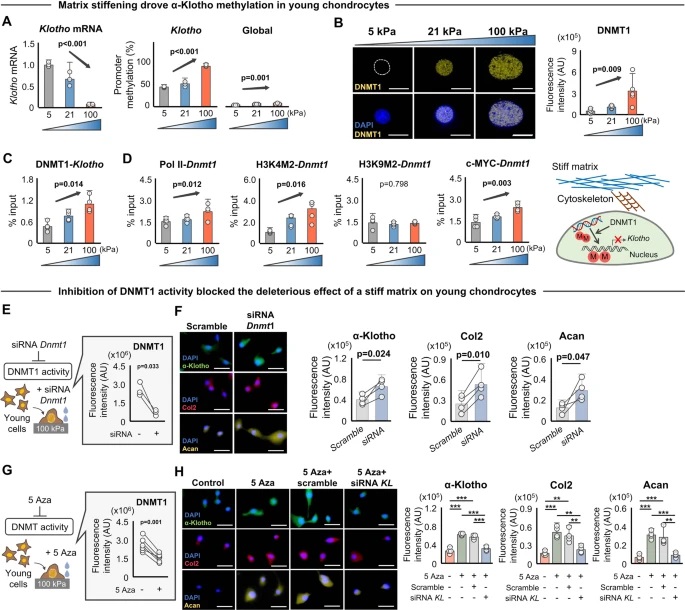
A Stiff substrates downregulated Klotho expression and increased Klotho promoter methylation as well as global DNA methylation in young chondrocytes (n = 3/group). B Stiff substrates increased DNMT1 expression in young chondrocytes as quantified by immunofluorescence (n = 5/group; 30–50 cells per individual sample). Scale bar: 20 μm. C Stiff substrates increased binding of DNMT1 at Klotho promoter in young chondrocytes quantified by chromatin immunoprecipitation (ChIP) analyses (n = 4/group). D Stiff substrates increased binding of RNA Polymerase II (Pol II), active chromatin mark H3K4M2, and c-MYC, but not the repressive chromatin mark, H3K9M2, at the Dnmt1 promoter in young chondrocytes, as quantified by ChIP analyses (n = 4/group). E, F siRNA Dnmt1 treatment inhibited the deleterious effect of a stiff microenvironment on α-Klotho, type II collagen (Col2), and aggrecan (Acan) expression, as quantified by immunofluorescence (n = 4/group; 40–50 cells per individual sample). Scale bar: 50 μm. G, H 5-Aza-2’-deoxycytidine (5 Aza) treatment inhibits the deleterious effect of a stiff microenvironment on α-Klotho, Col2, and Acan expression. The effects of 5 Aza treatment were blocked when combined with siRNA Klotho (siRNA KL) treatment. Data were quantified by immunofluorescence (n = 4/group; 30–45 cells per individual sample). Scale bar: 50 μm. Statistical analyses were performed using a linear mixed effect model (A–D), two-tailed paired t test (E–G) or analysis of variance with post-hoc Tukey–Kramer test (H). **p < 0.01, ***p < 0.001. Data are presented as means ±95% confidence intervals. Source data are provided as a Source Data file.
An additional series of ChIP analyses revealed that stiff substrates induced recruitment of Pol II, H3K4M2, but not H3K9M2 at the Dnmt1 promoter (Fig. 5D), contributing to the increased DNMT1 expression. We also observed a significant increase in binding of c-MYC at the Dnmt1 promoter in response to increased ECM stiffness (Fig. 5D). c-MYC is a transcription factor known to be stimulated and/or regulated by kinase signaling44. These findings indicate that Dnmt1 is directly associated with substrate stiffness-mediated signaling. Notably, inhibition of Dnmt1 by siRNA rescued the deleterious effect of a stiff matrix on both chondrocyte α-Klotho levels and chondrogenicity (Fig. 5E, F).
Given our observation that a stiff matrix-induced global DNA methylation changes, we cannot exclude the possibility that the effect of DNMT1 on chondrocyte health is independent of α-Klotho. To more definitively implicate DNMT1 as a regulator of α-Klotho and, ultimately, chondrocyte health, we performed simultaneous inhibition of α-Klotho by siRNA Klotho and DNMT by 5-Aza-2’-deoxycytidine (5 Aza). Results revealed that intercepting upregulation of Klotho expression following pharmacological inhibition of DNMT abrogated the beneficial effect of the DNMT inhibition alone (Fig. 5G, H). These results suggest that an aged-like stiff substrate mediates decreased chondrogenicity through inhibition of Klotho. Of note, treating chondrocytes with siRNA for Dnmt1 did not significantly alter nuclear eccentricity (Fig. S14A–C), suggesting that age-related nuclear deformation is either independent or upstream of DNMT1.
Since extrinsic mechanical signals from the microenvironment are transmitted to the nucleus via the actin cytoskeleton45, we next tested whether disruption of the cytoskeleton inhibits the impact of a stiff matrix on downstream chondrocyte responses. For this, aged cells cultured on stiff substrates were treated with Latrunculin A (lat A), an inhibitor of actin polymerization. We confirmed that lat A treatment abolished stress fiber formation, decreased nuclear eccentricity (i.e., increased roundness), and decreased lamin A/C expression without influencing chondrocyte viability (Fig. S15A–C). Indeed, we found that reduced actin polymerization in aged chondrocytes cultured on stiff substrates decreased DNMT1 expression and increased α-Klotho levels, ultimately restoring type II collagen and aggrecan levels (Fig. 6A). Increased α-Klotho levels following lat A treatment were also accompanied by a decrease in methylation level of the Klotho promoter, while global DNA methylation was not drastically altered (Fig. 6B). Interestingly, the increased Pol II and c-MYC bindings at Dnmt1 promoter induced by stiff substrates (shown in Fig. 5D) were abolished under lat A treatment conditions (Fig. 6C). We interpret these data to mean that the transcriptional machinery of Klotho/Dnmt1 may be epigenetically regulated by mechanical signals. Treatment with lat A also abolished the change in binding of Pol II, H3K4M2, and DNMT1 at the Klotho promoter when cells were cultured on a stiff substrate (Fig. 6D and Fig. S15D). Treatments with Y-27632, an inhibitor of actin fiber formation, and PF-562271, an inhibitor of focal adhesion kinase, similarly abolished the observed increase in DNMT1 and decrease in α-Klotho when chondrocytes were seeded on a stiff substrate (Fig. S16A, B).
Fig. 6: Mechanotransductive signals delivered by stiff substrates drive epigenetic repression of α-Klotho.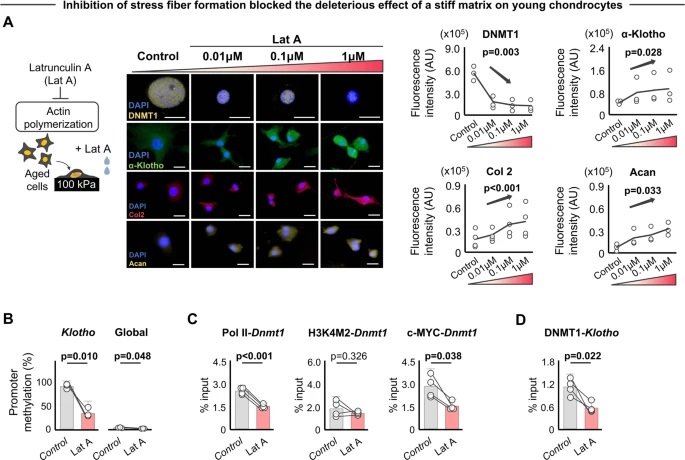
A Latrunculin A, an inhibitor of actin polymerization, rescued stiff matrix-induced increases in DNMT1 and reduction of α-Klotho, type II collagen (Col2), and aggrecan (Acan) in aged chondrocytes, as quantified by immunofluorescence (n = 3/group except for Col2 [n = 4/group]; 30–60 cells per individual sample). Scale bar: 20 μm. B Inhibition of actin polymerization blocked the stiff substrate-driven increased Klotho promoter and global DNA methylation in aged chondrocytes (n = 3/group). C Inhibition of actin polymerization blocked the stiff substrate-driven increased binding of RNA Polymerase II (Pol II), c-MYC, but not H3K4M2, at Dnmt1 promoter in aged chondrocytes as quantified by chromatin immunoprecipitation (ChIP) analyses (n = 4/group). D Inhibition of actin polymerization blocked the stiff substrate-driven increased binding of DNMT1 at Klotho promoter in aged chondrocytes as quantified by ChIP analyses (n = 4/group). Statistical analyses were performed using a linear mixed effect model (A) or two-tailed paired t test (B–D). Data are presented as means ± 95% confidence intervals. Source data are provided as a Source Data file.
Reduction of ECM stiffness increases α-Klotho expression and improves cartilage health in aged mice
Our in vitro findings raise the possibility that targeting ECM mechanics by preventing or reversing matrix stiffening may be a potential therapeutic approach for age-related KOA. As described above, pathway analysis from mass spectrometry data revealed that aged cartilage displayed enrichment of ECM-related pathways, including Focal Adhesion, ECM Receptor Interaction, and Hippo signaling (Fig. 1C). Therefore, to identify potential target ECM proteins driving age-related ECM stiffening in vivo, we revisited the mass spectrometry data in search of ECM proteins associated with increased lamin A/C. PCA revealed that aged cartilage displayed an altered expression profile in 155 ECM-related proteins (Fig. 7A). Lysyl oxidase (LOX) emerged in the top 20 proteins contributing to PC2 and was positively correlated with lamin A/C (Fig. 7B, C). This finding is of particular interest given that LOX is one of the major enzymes involved in collagen cross-linking46 and has been shown to contribute to PTOA pathogenesis by increasing ECM stiffness47.
Fig. 7: BAPN injection improves α-Klotho expression and cartilage integrity in aged mice.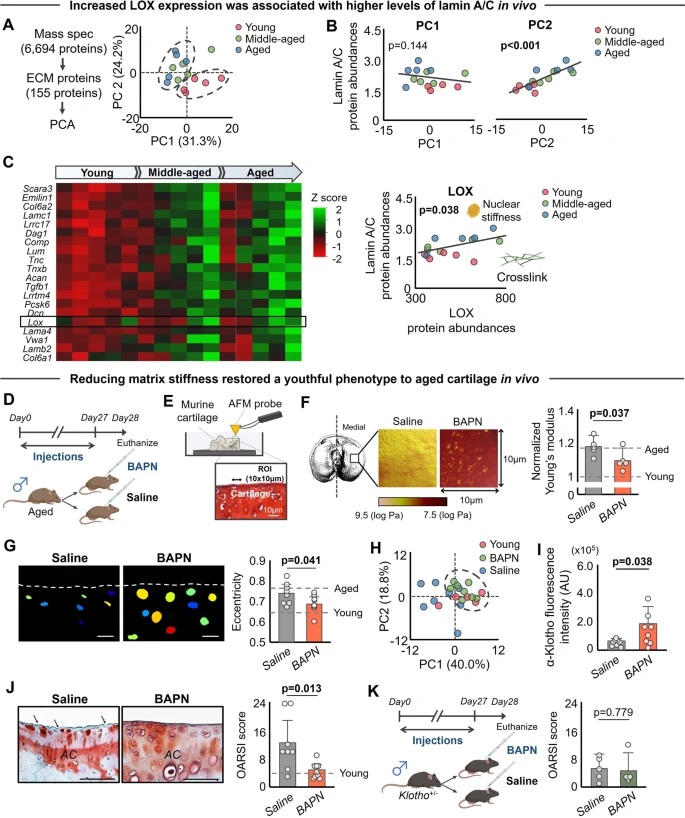
A Principal component analysis (PCA) showing the separate clusters in ECM proteins from young and aged cartilage (n = 5/group). B Principal component 2 (PC2) in ECM protein expression is positively correlated with lamin A/C expression. C Heat map of the top 20 ECM proteins contributing to PC2, showing age-related ECM remodeling. Color indicates z score for each variable. Lox, an enzyme that induces collagen cross-linking, was in the top 20 proteins contributing to PC2 and was positively correlated with lamin A/C, supporting a connection between LOX-mediated increased collagen cross-linking and nuclear stiffness. D Schematic showing the experimental protocol for 4 weeks of daily BAPN injections in aged mice (n = 8 for saline, n = 9 for BAPN). E Schematic showing the atomic force microscopy measurement of murine medial tibial cartilage with 10 × 10 µm region of interest. F BAPN treatment significantly reduced Young’s modulus of medial tibial cartilage (n = 5/group). Young’s modulus data were transformed into Log MPa and normalized by Young’s modulus value in naive young group. G. Representative CellProfiler-generated nuclear images in murine medial tibial plateaus after 4-week injection of saline or BAPN. Nuclei were pseudocolored. White dashed lines indicate cartilage surface. Scale bar: 10 μm. BAPN injection in aged mice decreases nuclear eccentricity towards young level (n = 8 for saline, n = 9 for BAPN; 30–40 nuclei per individual mouse). H PCA showing the same cluster of young and aged+BAPN injection. I. BAPN injection in aged mice improves α-Klotho expression in articular cartilage quantified by immunofluorescence (n = 8 for saline, n = 9 for BAPN; 30–65 cells per individual sample). J BAPN injection in aged mice improves cartilage integrity (n = 8 for saline, n = 9 for BAPN). Representative histological sections stained with Safranin O/Fast Green are provided. Black arrows indicate loss of cartilage matrix. OARSI score (0–24 points; higher value indicates more severe cartilage degeneration) assessed by blinded assessor is provided. OARSI score in young cartilage is provided as a reference. K Beneficial effect of BAPN injection was blocked in Klotho+/− mice (n = 5 each for saline and BAPN). Statistical analyses were performed using linear regression analysis (B, C) or two-tailed Student t test (F, G, I–K). Data are presented as means ±95% confidence intervals. Portions of the figures were created with biorender.com. Source data are provided as a Source Data file.
Cartilage stiffness increases by 2–3 fold with aging34. We, therefore, tested whether reducing the cartilage stiffness in aged mice improves α-Klotho levels and cartilage integrity. For this purpose, we administered β-aminopropionitrile (BAPN), a known inhibitor of LOX48, as a physiological means to reduce cartilage stiffness in aged mice (Fig. 7D). We confirmed by AFM that four weeks of daily administration of BAPN significantly reduced stiffness of cartilage in the medial tibia (Fig. 7E, F). Histological analysis demonstrated that chondrocytes in aged mice treated with BAPN displayed a more spherical nuclear morphology, similar to young mice (Fig. 7G). PCA analysis further confirmed that chondrocytes from aged mice treated with BAPN exhibited a more youthful phenotype (Fig. 7H). Further, consistent with our in vitro findings, reducing matrix stiffness of aged cartilage in vivo significantly increased α-Klotho levels and improved cartilage integrity (Fig. 7I, J). However, the beneficial effect of BAPN on cartilage integrity was not observed in Klotho+/− mice (Fig. 7K), suggesting that improved cartilage integrity after BAPN injection was driven, at least in part, by increased α-Klotho levels. We note that BAPN supplementation in vitro did not influence α-Klotho levels in aged chondrocytes cultured on aged-like stiff substrates (Fig. S17), indicating that the increased α-Klotho levels after BAPN administration in vivo is not likely to be explained by a direct effect of BAPN on α-Klotho. These findings are consistent with a previous study showing that the effects of BAPN on chondrocyte function are primarily mediated by mechanotransductive mechanisms.
Discussion
The objective of this work was to provide novel and translational insights into pathogenic mechanisms underlying age-related KOA. A graphical abstract summarizing our findings is shown in Fig. 8. Mass spectrometry proteomic analyses of murine cartilage with a subsequent genetic loss-of-function approach revealed that α-Klotho induces cartilage degeneration in mice in a sex-dependent manner. This age-related decrease in α-Klotho expression was also confirmed in human cartilage. In search of drivers of the decline in chondrocyte α-Klotho levels over time, we found that α-Klotho is highly responsive to biophysical signals from the surrounding ECM. Whereas increased matrix stiffness decreased α-Klotho expression, reducing matrix stiffness increased α-Klotho expression and improved chondrocyte health in vitro. The stiffness-dependent modulation of α-Klotho was attributed to the recruitment of epigenetic modifiers, including DNMT1, at the Klotho promoter. As a demonstration of the physiological relevance of these in vitro findings, we presented evidence of enhanced cartilage integrity in vivo following pharmacological reduction of cartilage matrix stiffness in aged mice. Together, these findings suggest that preventing or reversing age-related matrix stiffening and the resulting pathogenic mechanotransductive signaling may serve as a promising therapeutic target to attenuate or even reverse the development of age-related KOA.
Fig. 8: Graphical abstract.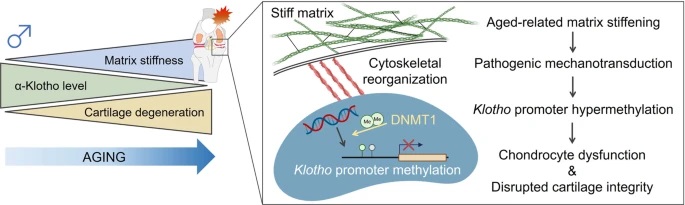
Age-related matrix stiffening in articular cartilage initiates pathogenic mechanotransductive signaling, driving chondrocyte dysfunction as well as disrupted cartilage integrity through Klotho promoter hypermethylation. Portions of the figure were created with biorender.com.
Although there are many studies characterizing tissue-level changes in cartilage with aging, there is a paucity of pre-clinical work examining cartilage integrity according to sex. This is a critical shortcoming, especially given that post-menopausal women present with more severe KOA compared to men11. To address this gap, we thoroughly described the trajectory of cartilage degeneration over time and according to sex. Inconsistent with clinical evidence of increased prevalence of KOA in women11, we found that cartilage integrity was relatively preserved in aged female mice. This disconnect may be due to the fact that the aged female mice used in our study were likely non-menopausal, as suggested by maintained serum estrogen levels over time. Estrogen affects key signaling molecules in several distinct canonical and non-canonical estrogen signaling pathways, such as PI3K/Akt and PKC/MAPK signaling49. Whereas the beneficial role of systemic estrogen administration in OA development has been investigated in animal models, the underlying mechanism remains unknown49. Our data highlight the need for mechanistic studies into the effects of menopause on KOA in females. Investigating the link between estrogen and matrix-mediated epigenetic regulation is of particular interest given that estrogen modulates mechanotransductive pathways, such as Hippo signaling50, which we found to be associated with cartilage aging (Fig. 1C).
In search of novel upstream candidates that regulate PI3K/Akt signaling, which we found to be significantly changed over time in male mice, a series of genetic and pharmacologic manipulations revealed declines in α-Klotho as a possible driver of cartilage degeneration. Future studies would benefit from chondrocyte-specific genetic manipulation of α-Klotho in vivo to further evaluate the specificity of this effect. Our results are consistent with previous in vitro and in vivo studies showing that α-Klotho overexpression counteracts chondrocyte dysfunction and cartilage degeneration in a PTOA model25,51. Another study also demonstrated that overexpression of α-Klotho, combined with soluble TGF-β supplementation, enhanced chondrocyte health and cartilage integrity in a chemically-induced model of KOA52. α-Klotho inhibits insulin growth factor receptor-mediated PI3K/Akt signaling and subsequently enhances FoxO21,53. FoxO, which protects chondrocytes from oxidative stress and prevents spontaneous cartilage degeneration54,55, is markedly reduced with aging in both murine and human cartilage56. Our results suggest that the interaction of α-Klotho and FoxO expression to mitigate oxidative stress is an area worthy of future studies.
While age-related declines in α-Klotho have been linked to the onset of an aged tissue phenotype in many organ systems, our understanding of the molecular mechanisms driving these declines is lacking. The ECM plays a dynamic role in regulating cartilage homeostasis and undergoes extensive remodeling with increasing age34,57. It is well established that increased matrix stiffness disrupts chondrocyte functionality via mechanotransductive pathways47,58,59, ultimately leading to cellular senescence. Additionally, biophysical cues influence gene expression through recruitment of epigenetic modifiers or by inducing reorganization of lamin-associated chromatin37,40,60,61,62,63,64. Here, we identified matrix stiffness as a potent epigenetic regulator of α-Klotho. Specifically, increased matrix stiffness increased Klotho promoter methylation, downregulated Klotho gene expression, and drove young chondrocytes towards an aged phenotype in vitro. Conversely, decreased matrix stiffness abrogated Klotho promoter methylation and promoted a youthful phenotype in aged chondrocytes. In these findings, epigenetic regulation of α-Klotho was partially controlled by DNMT1 recruitment at the Klotho promoter. These results are in line with previous reports showing that pharmacological inhibition of DNMTs improves cartilage integrity in a PTOA model47,65. Here, we showed that inhibition of actin polymerization rescued the stiff matrix-induced increases in binding of DNMT1 at the Klotho promoter, suggesting that an age-related increase in matrix stiffness increases DNMT1 recruitment at the Klotho promoter, which is attributed, at least in part, to cytoskeleton-mediated mechanotransduction. Nevertheless, whether mechanotransductive force directly drives the recruitment of DNMT1/transcription factors to the α-Klotho gene promoter region was not directly evaluated in this work and remains an interesting area for future investigation.
The beneficial effect of decreasing matrix stiffness on chondrocyte health is further supported by our in vivo findings demonstrating that BAPN administration improves α-Klotho expression and cartilage integrity in aged mice. These findings are consistent with previous work demonstrating the chondroprotective effects of BAPN intra-articular injection in a PTOA model56. While we confirmed that BAPN administration reduced cartilage stiffness, it is possible that LOX inhibition may have exerted direct biological effects, such as epigenetic modifications, on chondrocytes66. To test this possibility, we showed that BAPN administration did not alter α-Klotho levels in aged chondrocytes in vitro, suggesting that the chondroprotective effects of BAPN administration in vivo is not likely to be attributed to direct effects of BAPN on α-Klotho. Rather, our data suggest that the beneficial effect of BAPN on α-Klotho expression in vivo is likely attributed to modification of matrix biophysical properties.
Along a similar vein, it is also worth noting that the improved α-Klotho resulting from reduced ECM stiffness may, in turn, propagate a cascade of matrix remodeling and subsequent improvement in the matrix stiffness67. This possibility is supported by growing evidence that α-Klotho exerts anti-fibrotic effects in several tissues68. Accordingly, α-Klotho overexpression or supplementation protects against fibrosis in renal and cardiac diseases68. These anti-fibrotic effects of Klotho are mediated by the direct inhibitory effects on TGF-β1, Wnt, and FGF2 signaling68. This bidirectional interaction between α-Klotho in chondrocytes and their surrounding ECM, a phenomenon known as dynamic reciprocity69, is an area of interest for future studies.
While this study focused on cartilage as a model, a major conceptual innovation of our work is the demonstration of the novel mechanistic link between age-related increases in ECM stiffness and epigenetic repression of α-Klotho. It is widely recognized that α-Klotho plays a role in the attenuation of an aging phenotype in tissues throughout the body70, including, for example, skeletal muscle71,72 and kidney73, both of which display age-related increases in matrix stiffness33,74,75,76. Yet, the mechanisms provoking these declines over time remain unknown. As such, we anticipate that these studies may have broader implications in the field of aging research, even beyond cartilage.
Methods
Steps to ensure methodological rigor
This study was conducted according to the ARRIVE essential 1077. Where possible, power analysis from pilot data was done to select the number of animals needed for the study using Power and Sample Size Program (version 3.1.2; Vanderbilt University Medical Center, Nashville, TN)78. For example, a sample size calculation estimated that 10 mice were required to achieve statistical power of 0.8 based on the histology score for the aging cohort (n = 5 in male young and male aged mice). In addition, a priori power analyses for mass spectrometry estimated that five mice in each group would provide statistical power of 0.9 for detection of a two-fold change, assuming 20% variation79. For in vivo experiments utilizing BAPN injection, animals were randomly allocated to treatment or control groups using computer-generated randomization using the random command in Microsoft Excel. The treatments of BAPN were conducted under the same conditions as the control group, and the order of the treatments was performed randomly. We additionally randomly altered the cage location to prevent any bias from the environment. All histological outcome assessments were conducted in a blinded manner.
Animal and human cartilage samples
Experiments were performed using young (4–6 months), middle-aged (10–14 months), and aged (18–24 months) male and female C57/BL6 mice, as well as young (4–6 months) and middle-aged (10–14 months) male and female Klotho heterozygote mice (Klotho+/−; B6; 129S5-Kltm1-Lex, UC Davis). C57/BL6 mice were obtained from the NIA Rodent Colony and Jackson Laboratories. Prior to inclusion in experiments, animals with visible health abnormalities were excluded. Mice were housed in cages holding an average of 3–4 mice per cage with a temperature-controlled environment and 12-h light/dark cycles. The animals had access to food and water ad libitum. All animal experiments were approved by the University of Pittsburgh’s Institutional Animal Care and Use Committee.
Healthy human articular cartilage tissue in knee joints from young (<40 years old; 27.6 ± 6.85 years; n = 7 [2 females]) and older (≥65 years old; 71.9 ± 2.91 years; n = 7 [1 female]) donors were obtained through the National Disease Research Interchange (Philadelphia, PA) with approval from the University of Pittsburgh Committee for Oversight of Research and Clinical Training Involving Decedents (CORID #878). There was no patients’ consent or compensation involved.
BAPN injection of mice
Aged male C57/BL6 mice were randomized into one of two groups, receiving daily subcutaneous injections of either saline as a vehicle control, or BAPN (290 µg/µl in saline) for 4 weeks (aged + saline, n = 8, baseline body mass, 33.0 ± 2.29 g, aged+BAPN, n = 10, baseline body mass, 35.3 ± 3.03 g). Middle-aged male Klotho+/− mice were also randomized into one of two groups, receiving either saline or BAPN injections for 4 weeks (Klotho+/−+saline, n = 5, baseline body mass, 36.3 ± 4.50 g, Klotho+/−+BAPN, n = 5, baseline body mass, 40.6 ± 1.98 g). The volume of the injection (40–80 µl) was determined according to the mouse’s body mass (m) with following protocol: 40 µl (18.45 g ≤ m < 23.73 g), 50 µl (23.73 g ≤ m < 29.00 g), 60 µl (29.00 g ≤ m < 34.27 g), 70 µl (34.27 g ≤ m < 39.55 g), 80 µl (39.55 g ≤ m < 44.82 g). Mice were weighed every other day beginning on day 0 and ending on day 28 to ensure proper dosing of BAPN. All injections were performed at the same time during the light period (8–9 am). One animal in the aged+BAPN group was excluded from the analysis because of severe inflammation of the knee joint.
Serum collection
We collected serum from animals under anesthesia by isoflurane in accordance with an established protocol71. After collection, the animals were euthanized via cervical dislocation. The collected blood was allowed to clot in a 2 mL tube at room temperature for one hour. Then, the blood was centrifuged for 30 minutes at 13,000 rpm at 4 °C in a microcentrifuge. The serum was collected and aliquoted into 50 µl tubes and stored at −20 °C until used. Any samples displaying hemolysis (as evidenced by pink/red coloration) were not included in the analysis.
Estrogen ELISA
Circulating estrogen levels were quantified according to the manufacturer’s protocol using the 17 beta Estradiol ELISA Kit (cat no. ab108667, Abcam). This kit was validated by Marino FE et al.80. Briefly, 25 µl of blood serum samples, prepared standards, or controls were added in duplicate to a 96 well plate. 200 µl of the 17 beta Estradiol-HRP Conjugate were added to each well followed by incubation at 37 °C for two hours. Samples, standards, and controls were aspirated, and wells were washed three times with 300 µl of diluted washing solution (soak time >5 seconds) using an automated plate washer (BioTek 50TS). After washing, 100 µl tetramethylbenzidine (TMB) Substrate Solution was added to each well, and the plate was incubated for 30 minutes in the dark at room temperature. After incubation, 100 µl of Stop Solution was added into all wells in the same order and at the same rate as the substrate solution. Absorbance was measured at 450 nm with Spectramax M3 plate reader (Molecular Devices) within 30 minutes of adding the Stop Solution. Construction of standard curve and subsequent analyses were performed in Microsoft Excel.
Histological preparation and semi-quantitative histological score for cartilage degeneration
Mouse knee joints were fixed in 4% paraformaldehyde overnight at 4 °C and decalcified in 20% ethylene diamine tetra acetic acid solution for 10 days. Decalcified paraffin sections (5 µm thickness) were prepared from the central region of the mouse knee joints in the frontal plane in accordance with Osteoarthritis Research Society International (OARSI) recommendations81. Paraffin sections from human cartilage specimen (6 µm thickness) were also prepared following fixation in 10% buffered formalin phosphate solution overnight at 4 °C.
The paraffin sections were stained with Safranin O/Fast Green/Hematoxylin to evaluate the severity of cartilage lesions. This study focused on medial tibial cartilage, given this is the region most typically affected in humans7 and its severity is typically equal to or higher than those for the femoral condyle in the majority of aged mice82. The OARSI scoring system, consisting of six grades and four stages on a scale from 0 (normal) to 24 (severe cartilage lesion), was used for semi-quantitative evaluation of cartilage lesion severity83. The most severe score for each joint was selected as the maximum OARSI score. We did not add the summed scores generated from different sections, as discriminative ability for age-related cartilage degeneration is comparable to the maximum score82. A trained examiner (ACB) performed grading in each histological section in a blinded manner with excellent inter-rater reliability (intraclass correlation coefficient [2,1], 95% confidence interval: 0.885, 0.814–0.925) with another trained examiner (HI).
Computational histological image analysis for cartilage surface roughness
Histologic sections stained with Safranin O/Fast Green/Hematoxylin were imaged at ×10 magnification. We detected the contour line of the cartilage surface on medial tibia and converted it into an X-Y coordinate pixel data using Image J software. We then calculated error, a deviation between the 4th order fitted curve and actual surface shape, using MATLAB version R2020a (MathWorks Inc., Apple Hill Drive, Natick, MA, USA). The computed error thus was an index of the mean discrepancy between the cartilage surface and the expected curve. Since the error value is a function of medial tibia size, the cartilage surface roughness was calculated as the error value divided by length of cartilage in medial tibia (i.e., distance between the edges of medial tibia).
Chondrocyte isolation
Primary mouse chondrocytes were isolated in accordance with an established protocol84. Briefly, cartilage tissue was harvested from the femoral head, femoral condyle, and tibia using small scissors and tweezers while ensuring that minimal synovium, fat, muscle, ligament, and tendons were included in the tissue harvest. After brief wash with PBS two times, cartilage pieces were digested with 0.1% (w/w) type II collagenase (cat no. 4176, Worthington Biochemical corp., NJ) in low-glucose DMEM (cat no. 11965-092, Gibco) with 10% (vol/vol) FBS (cat no. SH30070.03, Hyclone) and 1% (vol/vol) Pen/Strep at 37 °C for overnight at 5% CO2 in a petri dish. Following digestion, the filtrate was passed through a 50-μm strainer and cells were cultured in growth media containing DMEM supplemented with 10% FBS and 1% Pen/Strep until the cells reached confluence. First-passage cells were used for all experiments. The isolated cells were characterized by type II collagen immunofluorescence, with over 95% cells positive for type II collagen expression.
Preparation of fibronectin-coated pAAm substrates
We prepared pAAm gels with different stiffnesses (5 kPa, 21 kPa, and 100 kPa) in accordance with a previous study35. The pAAm gels were made on glass coverslips pre-treated with 0.1 N sodium hydroxide (cat. SS255-1, Fisher Scientific, IL), 0.5% 3-aminopropyltrimethoxysilane (cat no. AC313251000, Acros Organics, Belgium) and 0.5% glutaraldehyde (cat no. BP25481, Fisher Scientific, IL) to improve gel adhesion. Detailed gel composition is provided in Table S2. To facilitate cell adhesion, the surfaces of prepared hydrogels were further conjugated with fibronectin (100 μg/mL, from bovine plasma, Sigma) using sulfo-SANPAH (cat no. NC1314883, Proteochem Inc., UT) as a crosslinker. Prior to seeding cells, gels were UV-sterilized in a cell culture hood for 30 minutes. Gels were kept hydrated in HEPES or PBS during all preparation steps.
Evaluation of the impact of matrix stiffness on cell fate
Isolated primary chondrocytes from young and aged mice were plated (5000 cells per cm2) on 5 kPa, 21 kPa, and 100 kPa pAAm gels and cultured in low-glucose DMEM supplemented with 10% FBS and 1% Pen/Strep with or without 50 µg/mL ascorbic acid-2-phosphate (cat no. A8960, Sigma) at 37 °C at 5% CO2. We selected the concentration of ascorbic acid based on previous literature demonstrating enhanced chondrogenic gene expression in murine chondrocytes with the ascorbic acid supplementation85. On day 5, the culture medium was removed, and seeded pAAm gels were fixed in 2% PFA for 10 minutes. After a triple wash by PBS, cells were kept in PBS at 4 °C until used.
To further evaluate the impact of matrix stiffness on the ability of chondrocytes to secrete matrix proteins, soluble type II collagen and α-Klotho were quantified from conditioned medium collected at day 5 of culture on pAAm gels after concentration (Amicon® Ultra-4 Centrifugal Filter Devices). ELISA was used to quantify type II collagen (cat no. SEA572Mu, Cloud Cone Corp, TX, USA). Multiple freeze-thaw cycles were avoided before the experiment.
Treatments with Latrunculin A, Y-27632, PF-562271, and BAPN
Isolated primary chondrocytes from aged mice were plated (5000 cells per cm2) on 100 kPa pAAm gels and cultured in low-glucose DMEM supplemented with 10% FBS and 1% Pen/Strep at 37 °C at 5% CO2. On day 3, chondrocytes were treated with latrunculin A (0.01, 0.1, and 1.0 µM) for 1 hour, Y-27632 (50 µM) for 48 hours, PF-562271 (1 µM) for 48 hours, or BAPN (200 µM) for 48 hours. The chondrocytes were washed with media two times and cultured for additional two days. The culture medium was removed, and constructs were fixed with 2% PFA for 10 minutes. After a triple wash by PBS, cells were kept in PBS at 4 °C until analysis.
In a separate analysis, the cytotoxic effect of latrunculin A was determined using the live/dead reduced biohazard viability/cytotoxicity kit (cat no. L7013, Molecular probes, Inc., OR) in accordance with manufacturer’s protocol. Briefly, isolated primary chondrocytes from aged mice were plated (1000 cells per cm2) on chamber slides after which they were cultured and treated by latrunculin A (0.01, 0.1, and 1.0 µM) with the same protocol as above. After washing with HEPES-buffered saline solution, chondrocytes were incubated in live/dead viability/cytotoxicity solution for 15 min after which they were fixed with 4% glutaraldehyde for 1 hour. A positive control for dead cells was generated by fixing the chondrocytes by 4% PFA for 15 minutes prior to incubation with the live/dead viability/cytotoxicity solution. Cells were imaged using a Zeiss Observer Z1 semi-confocal microscope with ZEN 2.3 software (Zeiss, Jena, Germany). Positive control slide was used to set the threshold for the signal intensity and the exposure time for individual channels.
In vitro inhibition of Klotho and Dnmt1
Isolated primary chondrocytes from young mice were plated (5000 cells per cm2) on 5 kPa pAAM gel and cultured in low-glucose DMEM supplemented with 10% FBS and 1% Pen/Strep at 37 °C at 5% CO2. On day 3, the chondrocytes were treated with 25nmol of siRNA to Klotho, or a non-targeting scramble control (GE healthcare Dharmacon) in antibiotic-free chondrocyte growth media for 6 hours. The chondrocytes were then washed twice with media and cultured for an additional 48 hours. The culture medium was removed, and cells were fixed with 2% PFA for 10 minutes. After a triple wash by PBS, cells were kept in PBS at 4 °C until further analysis. For the genetic inhibition of Dnmt1, the same protocol described above (25 nmol of siRNA to Dnmt1) was used.
To pharmacologically inhibit DNMT activity, the DNMT inhibitor, 5-Aza-2’-deoxycytidine (10 µM; 5 Aza, MCE-MedChemExpress, NJ, US) was used in a separate experimental cohort. After 3 days chondrocytes culture on 5 kPa pAAM gel in low-glucose DMEM supplemented with 10% FBS and 1% Pen/Strep at 37 °C at 5% CO2 (5000 cells per cm2), 5-Aza-2’-deoxycytidine was supplemented in the growth medium and cultured for additional 48 hours. The culture medium was removed, and cells were fixed with 2% PFA for 10 minutes. After a triple wash by PBS, cells were kept in PBS at 4 °C until further analysis. To inhibit DNMT1 activity and Klotho expression simultaneously, chondrocytes were treated by 5-Aza-2’-deoxycytidine (10 µM) and siRNA Klotho (25nmol) together on day 3, and the protocol described above to analyze 5 Aza was repeated.
Fabrication of gelatin-based hydrogels and chondrocytes encapsulation
Gelatin-based hydrogels (GelMA) were fabricated by photo-cross-linking86. Briefly, GelMA (20% stock solution, Cellink, Boston, MA) was diluted to 8% by adding reconstitution buffer (Agent P, Cellink) and equal proportion of photoinitiator (LAP, Cellink) in accordance with manufacturer’s protocol. Subsequently, male mouse chondrocytes were suspended in the GelMA solution at a concentration of 2.0 × 10⁷ cells/ml. The suspension was pipetted into cylindrical silicon molds 2 mm in height and 5 mm in diameter. The GelMA was then crosslinked with 395 nm UV light for 2 minutes. Constructs were cultured for 5 days in growth media containing DMEM supplemented with 10% FBS and 1% Pen/Strep.
Evaluation of mechanical properties of GelMA using AFM
GelMA (8% and 20% w/v) was added into glass bottom dishes (D110300, Matsunami, Osaka, Japan) and maintained at 4 °C for 10 minutes. Subsequently, distilled water was added to the gel. We use these procedures to keep surface structure stable and ensure reliable AFM measurement. GelMA was then crosslinked with 395 nm UV light for 2 minutes and maintained overnight at room temperature before further measurement. The elasticity of GelMA hydrogel were evaluated using atomic force microscopy (NanoWizard® 3 NanoOptics, JPK Instruments, Berlin, Germany). Briefly, a cantilever with 5 μm diameter spherical beads attached to the tip (CP-CONT-BSG-A, NanoAndMoreGmbH, Watsonville, CA) and Hertzian contact model were used to obtain force and displacement values, and Young’s modulus was calculated using JPK DP Data Processing Software (JPK Instruments). At least three specimens were used for each testing condition.
Evaluation of the effect of BAPN on mechanical properties of murine cartilage using AFM
Freshly dissected medial tibia cartilage in mice knee joints were maintained in PBS with protease inhibitors at 4 °C for <24 h prior to mechanical testing87. Excised knee joints were mounted onto steel sample disks using Loctite 454 instant adhesive gel. Samples were immersed in PBS buffer and fluid mode AFM measurements were collected. Peak Force Tapping Quantitative Nanomechanical maps were generated using a Bruker Dimension Icon Atomic Force Microscope and NanoScope 6 Controller. MikroMasch HQ:NSC18 AFM probes with nominal cantilever spring constants of 2.8 N/m for the aged, aged+saline, and aged+BAPN treated group. Bruker MLCT-BIO AFM probes with nominal 0.6 N/m spring constants were used for the young group. Cantilever spring constants were determined using the thermal tunning method. Cantilever deflection sensitivities, QNM synchronization distances, and Peak Force Tapping amplitude sensitivities were determined by analysis of force curves collected on a sapphire surface submerged in PBS buffer. Probe radii and tip shapes were estimated by tip qualification analyses of titanium roughness standard micrographs, Bruker RS-12M. During sample QNM measurements, the force setpoint was adjusted to maintain between 10–20 nm of nominal sample indentation. In each cartilage sample, a 10 × 10 µm field (512 scan lines by 512 points) was scanned. To avoid high-frequency noise in the Young’s modulus data, a median filter was applied. All data analyses were performed using NanoScope Analysis 2.0 (Bruker Co., MA, USA).
Immunofluorescence and imaging
Immunofluorescence analysis for tissue sections, cell-seeded pAAm gels, and cell-encapsuled GelMA were performed to determine the signal intensity of type II collagen, α-Klotho, aggrecan, lamin A/C, lamin B2, DNMT1, and FAK in accordance with established protocols71. Briefly, after a triple wash by PBS, cells were permeabilized with 0.1% triton-X (Fluka 93420) for 15 minutes, followed by blocking for 1 hour in 0.1% triton-X and 3% bovine serum albumin (BSA, Sigma A7906) in PBS. For the decalcified paraffin-embedded tissue sections, antigen-retrieval was performed by incubating sections in sodium citrate buffer for 2 hours at 60 °C prior to blocking. After blocking, the tissue or cells were incubated overnight at 4 °C with primary antibodies in antibody solution (0.1% Triton-X + 3% BSA + 5% Goat Serum), at the dilutions provided in Table S3. One negative control slide per staining set was generated by omitting the primary antibody in the antibody solution.
After a triple wash by PBS, the samples were incubated with host-specific secondary antibodies conjugated with Alexa Fluor 488 (Fisher Scientific) in antibody solution for one hour at room temperature at a 1:500 dilution. Following a triple wash with PBS, the samples were stained with DAPI for 2 minutes and then washed with PBS again. Samples were mounted with coverslips using Gelvatol mounting medium (Source: Center of Biologic Imaging, University of Pittsburgh). The α-Klotho antibody (R&D systems, MAB1819, Lot# KGN0315101) was validated for skeletal muscle histological sections in a previous study71. We also validated the same α-Klotho antibody using the decalcified paraffin section from a wild-type and a KL−/− mouse knee joint. We observed minimal staining in the Kl−/− compared to the wild-type counterparts. Slides were imaged using a Zeiss Observer Z1 semi-confocal microscope with ZEN 2.3 software (Zeiss, Jena, Germany). All images were collected at ×20 or ×63 magnification. Negative control slides were used to the threshold for the signal intensity and to set the exposure time for individual channels. All images for quantitative analysis in a given experiment were taken under the same imaging conditions with the same threshold for the signal intensity and the same exposure time. Fluorescence intensity was quantified using Image J. More specifically, integrated density for each channel was divided by number of cells in each image (i.e., fluorescence intensity per cell). In each immunofluorescence-based quantification, we used 5 or 10 randomly selected images for ×20 and ×63 images, respectively, per individual sample. Data for the random images were then averaged in each independent sample and used for statistical analysis (e.g., if we analyzed five independent samples in total, data was shown as n = 5 wells/group).
Real-time-PCR
One µg of total RNA from chondrocytes cultured on pAAm gels was reverse transcribed using iScript™ Advanced cDNA Synthesis Kit (BIO-RAD, Hercules, CA). The mRNA levels of the Klotho gene were quantified by SYBR Green-based real-time PCR (qPCR) using SsoAdvanced™ Universal SYBR® Green Supermix (BIO-RAD, Hercules, CA). Klotho gene expression levels were normalized to the expression level of Rpl44, and the fold change of Klotho relative to universal mouse reference RNA was calculated using 2−ΔΔCt method.
Methylation-specific PCR
200 ng of genomic DNA was subjected to bisulfite conversion with an EZ DNA Methylation Kit (Zymo Research, Irvine, CA) followed by methylation-specific PCR (MSPCR) using primers specific for methylated DNA of Klotho promoter. Primer sequences were previously reported for MSPCR of muscle DNA88. Fully methylated control DNA (Zymo Research, Irvine, CA) was used as a reference to calculate the percentage methylation of DNA samples.
Global DNA methylation assay
Levels of 5 methylcytosine (5mC) in DNA were measured using the 5mC DNA ELISA Kit (Zymo Research, Irvine, CA). A total of 200 ng of DNA was used and the percent of 5mC in the samples was quantified, normalized to total DNA, and compared to the standard curve provided in the kit.
ChIP analysis
We performed ChIP analysis as described previously71,89. Briefly, cells were fixed with 1% formaldehyde followed by quenching with glycine solution. Crosslinked cells were pelleted and subject for chromatin isolation and immunoprecipitation using ChIP-IT High Sensitivity kit (Active Motif, Carlsbad, CA), following the manufacturer’s instructions. One to two μg of ChIP-validated antibodies against RNA Polymerase II (A2032, Epigentek, Farmingdale, NY), DNMT1 (A1001, Epigentek, Farmingdale, NY), H3K9M2 (ab1220, Abcam, Cambridge, MA), H3K4M2 (39913, Active Motif, Carlsbad, CA), c-MYC (sc-40, Santa Cruz Biotechnology, Dallas, TX) or nonspecific negative control IgG (Active Motif, Carlsbad, CA) were used for immunoprecipitation of each sample. Non-immunoprecipitated chromatin was used as input. Following reverse cross-linking and elution of chromatin, DNA from each sample was purified with QIAquick PCR purification kit (Qiagen, Germantown, MD). Purified DNA sample concentrations were quantified by Qubit DNA HS assay kit (Thermo Fisher Scientific, Waltham, MA). Ten ng of purified DNA was used for PCR of Dnmt1 or Klotho promoters. The percent enrichment of immunoprecipitated DNA relative to the input was calculated.
Quantification of cellular and nuclear morphology
DAPI and F-actin images were obtained at ×63 and ×20 magnification using a Zeiss Observer Z1 semi-confocal microscope with ZEN 2.3 software (Zeiss, Jena, Germany), respectively. Image processing and morpheme feature extraction were performed using CellProfiler software (v4.0, The Broad Institute)30. Fifty-three shape features of cells and nuclei were determined using the “identify primary objects” followed by the “measure object size shape” and “export to spreadsheet” modules.
LC/MS-MS mass spectrometry-based proteomics
Knee cartilage from male and female young, middle-aged, and aged C57/BL6 mice (n = 5/age/sex) were microdissected as detailed previously90. Samples were lyophilized overnight and stored at −80 °C until shipment to the Proteome Exploratory Laboratory at Cal Tech.
Cartilage samples from each knee were lysed in 8 M urea/100 mM TEAB by grinding for 1 min with size tissue grinder pestles (cat. 12141363, Fisher Scientific), tip sonication with a Fisher Scientific 550 Sonic Dismembrator on ice at 20% power using cycles of 20 sec on/20 sec off for 4 minutes total, followed by another grinding step for 1 min. Samples were then clarified by centrifugation at 16,000 × g for 5 minutes at room temperature. Each lysate was then reduced with 500 mM TCEP for 20 min at 37 °C and alkylated with 500 mM 2-Chloroacetamide for 15 min at 37 °C in the dark. Samples were then digested with a 1:200 ratio of LysC to lysate for 4 hr at 37 °C, followed by dilution with 100 mM TEAB, addition of 100 mM CaCl2, and digestion overnight with 1:30 Trypsin at 37 °C. Digestions were stopped by acidifying with 20% TFA, desalted on C18 spin columns (cat. 89870, Fisher Scientific) according to manufacturer instructions, and lyophilized to dryness. Peptides were then resuspended in 0.1% formic acid and peptide amounts measured with the Pierce Quantitative Colorimetric Peptide Assay.
15 µg peptides from each sample were lyophilized, resuspended in 100 mM TEAB, labeled with TMTpro reagents dissolved in anhydrous acetonitrile for 1 hr at room temperature, and quenched with 5% hydroxylamine for 15 min at room temperature. All 15 male samples were then combined into one sample and all 15 female samples were combined into a second sample 100 μg of each sample was then fractionated with the Pierce High pH Reversed-Phase Peptide Fractionation Kit (Thermo #84868) according to manufacturer instructions and the resulting 8 fractions were lyophilized. Each fraction was resuspended in 20 µl 0.2% formic acid and peptide quantitation was performed with the Pierce Quantitative Colorimetric Peptide Assay. Fractions 7 and 8 from both samples had very low peptide amounts and were thus combined with that sample’s fraction #6 for a total of 6 fractions per sample.
Liquid chromatography-mass spectrometry (LC-MS) analysis of peptide fractions was carried out on an EASY-nLC 1000 coupled to an Orbitrap Eclipse Tribrid mass spectrometer (Thermo Fisher Scientific). Each fraction was loaded onto an Aurora 25 cm × 75 µm ID, 1.6 µm C18 reversed-phase column (Ion Opticks, Parkville, Victoria, Australia) and separated over 136 min at a flow rate of 350 nL/min with the following gradient: 2–6% Solvent B (7.5 min), 6–25% B (82.5 min), 25–40% B (30 min), 40–98% B (1 min), and 98% B (15 min). MS1 spectra were acquired in the Orbitrap at 120 K resolution with a scan range from 350–1800 m/z, an AGC target of 1e6, and a maximum injection time of 50 ms in Profile mode. MS2 scans were then acquired in the Orbitrap at 50 K resolution in Centroid mode with the first mass fixed at 110. Cycle time was set at 3 seconds.
Analysis of LC-MS proteomic data was performed in Proteome Discoverer 2.5 (Thermo Scientific) utilizing the Sequest HT search algorithm with the mouse proteome (UniProt UP000000589; 55,485 proteins covering 21,989 genes with a BUSCO assessment of 99.8% genetic coverage). Search parameters were as follows: fully tryptic protease rules with 2 allowed missed cleavages, precursor mass tolerance set to 20 ppm, fragment mass tolerance set to 0.05 Da with only b and y ions accounted for. Percolator was used as the validation method, based on q-value, with a maximum FDR set to 0.05. GO Biological Process terms were generated via Proteome Discoverer Sequest HT algorithm and were used for sorting proteins associated with PI3K/Akt signaling.
Quantitative analysis is based on TMT MS2 reporter ions generated from HCD fragmentation, with an average reporter S/N threshold of 10, used a co-isolation threshold of 50 with SPS mass matches set at 65%. Normalization was performed at the peptide level, and protein ratios were calculated from the grouped ion abundances, with protein FDR set to a maximum of 0.05.
The mass spectrometry proteomics data have been deposited to the CalTech Proteomics repository91 (https://doi.org/10.22002/ee2yc-fg857).
Bioinformatic analysis
To assess enriched pathways associated with aging in cartilage, KEGG enrichment analyses were performed using ROnToTools R Code92 with mass spectrometry data stratified by sex. The code was used as written, with the exception of changing ‘hsa’ to ‘mmu’ such that mouse pathways were referenced. Our dataset matrices were generated in Excel following the format provided in the sample dataset92. To consider transcript level changes relative to significantly changing pathways identified by mass spectrometry, we accessed archived RNA-seq data assessing global transcriptomic changes between young (3 months old) and aged (24 months old) C57BL6 mice16. Differentially expressed genes/proteins across the protein and transcripts data were integrated and were used for KEGG enrichment analyses by Enrichr software (https://amp.pharm.mssm.edu/Enrichr/). In this analysis, the protein name from mass spectroscopy data was translated into its gene symbol as in the RNA-seq data.
To identify possible regulators of aging process in cartilage, upstream regulator analysis was performed using Ingenuity Pathways Analysis software (QIAGEN, Hilden, Germany)17 with mass spectrometry data. As an input variable, we used fold change value of protein abundance and p-values of young versus aged male mice. This study included following molecule types as upstream regulators: cytokines, growth factor, kinases, and group. Activation z-scores were calculated, where a higher score indicates activation of the identified upstream regulators.
To determine whether treatment of siRNA to Klotho changes PI3K/Akt signaling, single sample gene set enrichment analysis (ssGSEA) was performed by Gene Set Enrichment Analysis software (http://software.broadinstitute.org/gsea/index.jsp)93. As an input variable, we used gene scores defined by value of log2 fold change of gene expression profiles after treatment of siRNA compared to no treatment control group provided by previous study (GSE80285)25. We used the PI3K/Akt signaling involved in KEGG pathways (KEGG_2019_Mouse) as a gene set downloaded from Enrichr.
Unsupervised machine learning
PCA was performed for data reduction to identify the principal components that represent differences in the cellular and nuclear morphology. To determine variables of cellular and nuclear shape contributing to PCs, the loading matrix, a correlation between the original variables and principal components, was extracted. In addition, PCA was used to visualize the separation of (1) nuclear morphology in young, middle-aged, and aged cartilage, (2) young and aged ECM protein abundance assessed by mass spectrometry-based proteomics, (3) the OARSI score in BAPN-injected and saline-injected knees, and (4) nuclear morphology in chondrocytes cultured on stiff pAAm gel with and without siRNA to Dnmt1.
Statistical analysis
All statistical analyses were performed using JMP Pro 14 software (SAS Institute, Cary, NC) or SPSS Statistics for Windows, Version 28.0 (IBM Corp., NY, USA). Except where indicated, data are displayed as means, with uncertainty expressed as 95% confidence intervals (mean ± 95% CI). For unpaired experiments, two-tailed Student t test, linear regression analysis, or two-way ANOVA was performed. For paired experiments, two-tailed paired t-test or linear mixed effect models were utilized. We checked the features of the regression model by comparing the residuals vs. fitted values (i.e., the residuals had to be normally distributed around zero) and independence between observations. No correction was applied for multiple comparison because outcomes were determined a priori and were highly correlated. No statistical analyses included confounders (e.g., body mass in each animal) due to the small sample size. We conducted a complete-case analysis in the case of missing data. In all experiments, p values <0.05 were considered statistically significant. Throughout this text, “n” represents the number of independent observations of knees or cells from different animals. Specific data representation details and statistical procedures are also indicated in the figure legends.
20S proteasomes secreted by the malaria parasite promote its growth
Elya Dekel, Dana Yaffe, Irit Rosenhek-Goldian, Gili Ben-Nissan, Yifat Ofir-Birin, Mattia I. Morandi, Tamar Ziv, Xavier Sisquella, Matthew A. Pimentel, Thomas Nebl, Eugene Kapp, Yael Ohana Daniel, Paula Abou Karam, Daniel Alfandari, Ron Rotkopf, Shimrit Malihi, Tal Block Temin, Debakshi Mullick, Or-Yam Revach, Ariel Rudik, Nir S. Gov, Ido Azuri, Ziv Porat, Giulia Bergamaschi, Raya Sorkin, Gijs J. L. Wuite, Ori Avinoam, Teresa G. Carvalho, Sidney R. Cohen, Michal Sharon and Neta Regev-Rudzki
Nature Communications volume 12, Article number: 1172 (2021)
Published: 19 February 2021
doi: https://doi.org/10.1038/s41467-021-21344-8
Abstract
Mature red blood cells (RBCs) lack internal organelles and canonical defense mechanisms, making them both a fascinating host cell, in general, and an intriguing choice for the deadly malaria parasite Plasmodium falciparum (Pf), in particular. Pf, while growing inside its natural host, the human RBC, secretes multipurpose extracellular vesicles (EVs), yet their influence on this essential host cell remains unknown. Here we demonstrate that Pf parasites, cultured in fresh human donor blood, secrete within such EVs assembled and functional 20S proteasome complexes (EV-20S). The EV-20S proteasomes modulate the mechanical properties of naïve human RBCs by remodeling their cytoskeletal network. Furthermore, we identify four degradation targets of the secreted 20S proteasome, the phosphorylated cytoskeletal proteins β-adducin, ankyrin-1, dematin and Epb4.1. Overall, our findings reveal a previously unknown 20S proteasome secretion mechanism employed by the human malaria parasite, which primes RBCs for parasite invasion by altering membrane stiffness, to facilitate malaria parasite growth.
Introduction
Red blood cells (RBCs) are endowed with exceptional features. During their ~120-day lifespan, they travel in circulation a total distance of 500 km1, but they have already lost their internal organelles2,3. Throughout their maturation process, RBCs undergo drastic remodeling as they extrude their nucleus, mitochondria, Golgi apparatus, endoplasmic reticulum, and 20–30% of their cell-surface and protein-synthesis machinery2,3. This means that the survival of these fundamental cells relies exclusively on their internal pool of proteins4.
The primary function of RBCs is to provide oxygen to all the body’s tissues. This is enabled by their enhanced ability to alter their shape (deformability), allowing them to pass through the smallest capillaries of the human body5. The shear elastic properties of the RBCs are predominantly determined by the cytoskeleton’s network of integral membrane proteins. The dynamic remodeling ability of the cytoskeleton network allows the repeated large deformation of RBCs, which facilitates movement6. Thus, their unconventional cell composition (predominantly proteins) and remarkable mechanical properties make them unique host cells for pathogens7,8.
A case in point is the malaria parasite Plasmodium falciparum (Pf), one of the most virulent malaria species, which only infects humans and is responsible for the greatest number of fatalities worldwide, mainly among children and pregnant women9. The Pf parasites in the merozoite stage of their blood cycle (asexual replication) must invade naïve RBCs every 48 h to sustain a blood-stage infection: Once an extracellular merozoite invades the RBC, it progresses to the ring stage, grows into a metabolically active trophozoite, and, following nuclear divisions, matures into a multi-nucleated schizont4,9. Subsequently, new merozoites egress from each schizont and invade naïve RBCs to repeat the blood cycle. Thus, malaria pathogenesis highly depends on the extensive remodeling of host RBCs10. In particular, these parasites modulate RBC’s membrane stiffness6,7 and activate a phosphorylation cascade that includes RBC cytoskeletal proteins6.
It is well known that pathogens remodel the host membrane to mediate their invasion by activating communication mechanisms that target the host cell11,12. However, it is still unknown whether malaria parasites, while growing inside their RBC host, remodel naïve surrounding RBCs in preparation for invasion. One known communication mechanism that pathogens employ to persist within their host is the release of multipurpose extracellular vesicles (EVs)13,14. These secreted vesicles are heterogeneous not only in size (ranging between 30 and 500 nm in diameter), but also in content, cell of origin and target destination (reviewed in refs. 15,16). Their diverse cargo includes proteins, lipids, glycans, RNA, and DNA, which facilitate changes in target host cells upon internalization of the pathogenic EVs (reviewed in refs. 16,17). We and others have previously shown that malaria parasites release EVs during their blood-stage to deliver cargo between them and to their host18,19,20,21,22,23. Specifically, the parasites deliver cargo to immune and endothelial host cells to promote their growth6,19,20. Yet, so far, it remains elusive whether the secreted vesicles are designed to modify their direct and most essential host cells, the RBCs.
To uncover the physiological role of Pf-derived EVs in RBC hosts, we purified vesicles from malaria infected (i) RBCs and introduced them to naïve RBCs. Remarkably, we found that the EV treatment significantly improves parasite growth. Since these host cells lost their capacity to synthesize proteins, we focused on the EV protein cargo and showed that the Pf-derived EVs are enriched with parasitic and host kinases as well as proteasome subunits. Strikingly, we demonstrated, using biochemical methods, that intact and functional 20S proteasome complexes are encapsulated within the vesicles (EV-20S) and it is their function that promotes parasite invasion in the treated naïve RBCs. Further systematic mechanical analysis of the recipient RBCs revealed that EV-20S proteasome activity increases cell membrane deformability and disturbs the structural integrity of the host cytoskeleton. Moreover, treatment with Pf-derived EVs prompted distinct phosphorylation events within unstructured regions of four cytoskeletal proteins, all of which belong to the same network machinery of the RBC cell cortex: β-adducin, ankyrin-1, dematin, and erythrocyte membrane protein band 4.1 (Epb4.1). Finally, we show that these phosphorylated proteins serve as a direct target for degradation by the delivered EV-20S proteasome. Taken together, our data indicate that assembled and functional 20S proteasome complexes secreted from malaria-infected RBCs are able to prime naïve host RBCs for impending parasite invasion. Overall, this study reveals a mechanism in which intracellular parasites utilize EVs in order to reshape their essential host cells.
Results
EVs derived from Pf-iRBCs promote parasite growth in human RBCs
To examine whether Pf-derived EVs affect naïve RBCs, we purified EVs from RBCs infected (i) with Pf NF54 strain19 (Supplementary Fig. S1A–C). The Pf parasite is constantly cultured in human RBCs pooled from healthy donors from which Pf-derived EVs are isolated. As control, we extracted vesicles harvested from uninfected (u) RBCs. Naïve RBCs were pre-incubated with equal amounts of EVs derived from uRBCs or ones derived from Pf-iRBCs (EV levels were counted by NTA measurement, Supplementary Fig. S1C). Magnet-purified Pf parasites were then fed by the two groups of pre-treated RBCs and parasitemia levels were monitored for two blood cycles (four days) by both counting Giemsa smears of ring-stage parasites and by a FACS-based assay24 (Fig. 1A, B and Supplementary Fig. S2). Our results indicate that in the naïve RBC group that received the Pf-derived EV pre-treatment, parasitemia levels increased by ~29% in comparison to those pre-treated with the control EVs (Fig. 1A). This finding suggests that EVs secreted from parasitic-infected RBCs alter naïve host RBCs to favor parasite growth.
Fig. 1: Pf-derived EV treatment influences growth dynamics and morphology of naïve RBCs.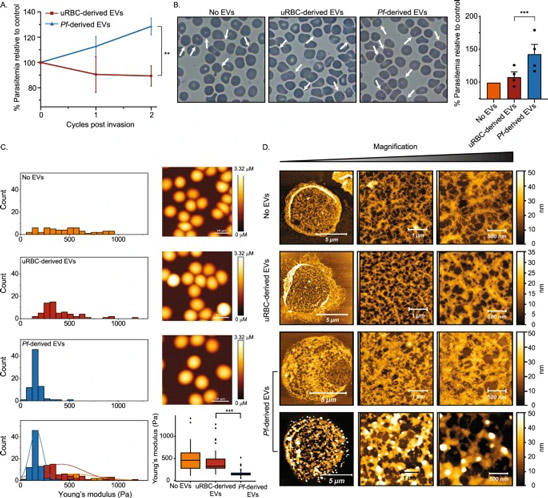
A, B Pf-derived EVs were incubated for 18 hr with naïve RBCs. Magnet-purified Pf were then introduced to the treated cells and the parasitemia level was monitored (estimated comparing to the untreated control) using flow cytometry (A) and Giemsa smears (B). Treatment with uRBC-derived EVs or the absence of EVs were used as controls. A Averages and statistical significance for at least three independent experiments were calculated by comparing percentages (relative to control) between treatments with a 2-way ANOVA, accounting for treatment and batch (uRBC-derived EVs 1st cycle n = 3, Pf-derived EVs 1st cycle n = 9, uRBC-derived EVs 2nd cycle n = 4, Pf-derived EVs 2nd cycle n = 12, **p = 0.00416). Error bars represent SEM (standard error of the mean). B The arrows indicate Pf-iRBCs. Scale bars represent 10 μm. Averages and statistical analysis of four independent experiments, in which counts were compared between treatments using a mixed GLM, assuming a binomial distribution, with a random intercept for batch (***p = 0.0008). Error bars represent SEM. C Mechanical changes of the recipient naïve RBCs following the Pf-derived EV treatment. Distributions of Young’s modulus values were obtained from AFM measurements (left panel), each count in the histogram represents the average value calculated from 25 indentations near the center of each cell. AFM images of the EV-treated and -untreated RBCs are shown on the right panel (scale bar 10 µm). Differences between groups shown in the box plot were tested with a one-way ANOVA, followed by Tukey’s post-hoc test. Boxes represent the 25-75 percentiles of the sample distribution, with black vertical lines representing the 1.5×IQR (interquartile range). The black dots represent outliers. Black horizontal line represents the median. Log-transformed data was used due to the mean-variance correlation. Three independent experiments, each comparing naïve RBCs, uRBC-derived EV and Pf-derived EV exposure, were performed with total of 15 full images acquired for each of the cell exposure conditions. Number of cells measured were for No EVs n = 57, uRBC-derived EVs n = 63, Pf-derived EVs n = 77, ***p < 0.001). D Representative AFM images of cytoskeletal structures of naïve RBCs, naïve RBCs incubated with either uRBC-derived or Pf-derived EVs. The sharp fibrilar network assigned to spectrin filaments seen in the upper frames breaks down and becomes blurred and disconnected in the lower frames. Three independent experiments were performed, with a total of 50 AFM scans for each type of cell treatment. A–D Results are representative of at least three independent biological replicates. Source data for A and B are provided in Supplementary Fig. S2.
Pf-derived EVs alter human RBC stiffness by disrupting the cytoskeleton network
It was previously shown that increased deformability of the naïve RBC membrane is required for parasite invasion and successful growth6. Therefore, we applied an Atomic Force Microscopy (AFM)-based approach to examine whether Pf-derived EVs alter the mechanical properties of naïve RBCs. In evaluating this test we treat the composite thin shell consisting of membrane bilayer and the adsorbed cortical cytoskeleton as a single unit which presumably bears responsibility for the mechanical response of the cell, as opposed to the bulk of the cell volume comprising cargo and fluids. EVs harvested from iRBC or uRBC cultures were incubated with human RBCs that were pooled from a total of six healthy donors. The RBCs treated with Pf-derived EVs expressed significantly lower effective Young’s modulus values (Fig. 1C, blue bars), while control EVs did not significantly alter the host cell membrane’s properties (Fig. 1C, red bars). Specifically, Young’s modulus was reduced from a median value of 461 Pa within a broad distribution for the untreated control to a much tighter distribution with median of 148 Pa for the Pf-derived EV-treated RBCs. A Tukey multiple comparison of the means yielded a non-significant difference (p = 0.074) between cells exposed to uRBC-derived EVs and those unexposed to EVs but very significant difference (p < 0.0001) between both of those two controls and the Pf-derived EV-treated cells. To further validate the mechanical effect of Pf-derived EVs on RBC mechanics, we have performed cell-pulling measurements using acoustic force spectroscopy (AFS)25, using an experimental approach as described in detail in Sorkin et al.26. In our approach, an acoustic pressure field is used to apply well-controlled forces up to 500 pN to cells confined between a microsphere and a surface. The microspheres which are attached on top of cells are pushed towards the nodes of the acoustic pressure field, thereby pulling on the cells. We track the position of the beads in three dimensions using a standard optical microscope, and thus can monitor the elongation of cells under applied force. Using this approach, we found that RBCs treated by Pf-derived EVs elongated significantly more than non-treated RBCs (Supplementary Fig. S3). Following calibration of the applied forces, the spring constants are calculated for each cell (that is, force divided by elongation), as shown in Supplementary Fig. S3. Lower spring constants are obtained for the EV-treated RBCs, in line with lower Young’s modulus measured by AFM.
The mechanical properties of the RBCs are strongly influenced by the underlying cytoskeleton network7,8,27. We therefore used high-resolution AFM imaging to assess whether the morphology of the RBC cytoskeleton network was affected by the presence of Pf-derived EVs7. As seen by the representative phenotypes in Fig. 1D, for the healthy RBC, the cytoskeleton comprises a filamental network. These features have been assigned to spectrin filaments and were also observed in previous AFM studies of the RBC (see, for example refs. 7,28,29). The filaments are known to be connected to the membrane at protein complexes that serve as the nodes of this two-dimensional, membrane-bound network. In the Pf-derived EV-exposed human RBCs, the network structure is disrupted: in some cells we find regions of the membrane where the node-filament network seems to be dissolved and replaced by a more uniform distribution of material (top row of the Pf-derived EV-exposed cells in Fig. 1D). In other cells, large-scale aggregation into mounds of material is evident, which indicates that the original network is highly disrupted (bottom row of the Pf-derived EV-exposed cells in Fig. 1D). This modulation of the cytoskeleton was not observed when naïve RBCs were treated with control vesicles derived from healthy RBCs (Fig. 1D), indicating that only the parasitic vesicles induced these cytoskeleton alterations in naïve RBCs.
The Pf-derived EV cargo is enriched with kinases and 20S proteasome subunits
Considering that mature RBCs lack translational machinery, it is reasonable to speculate that the observed Pf-derived EV-induced cytoskeleton changes are mediated by the delivered protein cargo (rather than the nucleic acid cargo). Therefore, we tested whether EVs derived from Pf-iRBCs are able to fuse with target membranes. To this end, we used a FRET-based fusion assay30,31,32, between Pf-derived EVs and liposomes resembling the plasma membrane lipid composition of the RBC33. Pf-derived EVs display significant membrane mixing compared to large unilamellar vesicles (LUVs) (Supplementary Fig. S4A), suggesting EVs can fuse with the RBC membrane to deliver their content. Moreover, using nanoparticle tracking analysis (NTA) we measured the size distribution of the vesicles before and after mixing of EVs with LUVs and found that vesicle size increases after mixing, due to the addition of membrane (Supplementary Fig. S4B–D), most probably via fusion. Taken together, these results suggest that EVs fuse to deliver their cargo.
Next we employed proteomics analyses to reveal the protein cargo carried by Pf-derived EVs. EVs were harvested from Pf-iRBC culture and their proteins were subsequently extracted and subjected to LC-MS/MS analysis. A total of 800 human proteins were identified (Supplementary Table 1A), in addition to 387 Pf proteins (Supplementary Table 1B). Among the human host proteins were 304 cellular components of extracellular exosomes (GO:0070062, 2.7-fold enrichment, p value 3.30E-67, FDR 8.84E-67). These included SR1, ENO1, ALDOA, HSP90AA1, GAPDH, HSPA8, PGK1, ACTB, CFL1, TF, YWHAZ, LDHA, YWHAE, CLTC, RAB5A, PDCD6IP, all markers typically found in human EVs34,35,36 (https://www.antibodies-online.com/images/resources/ABO_Exosome_poster.pdf). Interestingly, Gene Ontology (GO) analysis based on cellular component enrichment revealed that the most enriched term in Pf-derived EVs represents a family of parasitic kinases (Fig. 2A, B and Supplementary Table 1B). We also noticed that proteasome subunits, of both human and Pf origin, are among the top-ranking components (Fig. 2A, C, D, F and Supplementary Table 1A, B).
Fig. 2: Pf-derived EVs are enriched with kinases and proteasome subunits.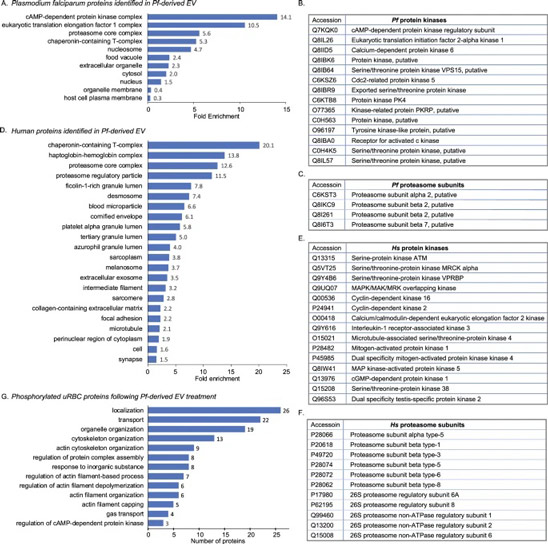
Gene Ontology (GO) cellular components enrichment analysis of Pf-derived EV protein cargo. Vesicles were harvested and proteins were extracted and subjected to cellular components analysis following LC-MS/MS proteomic identification. The horizontal bar graph shows the fold enrichment of significantly enriched A Pf and D human proteins. Results are based on GO cellular component enrichment analysis of all identified proteins against the background of D Homo sapiens and A Plasmodium falciparum (http://geneontology.org/; p-value < 0.05, FDR < 0.01). Lists of identified Pf and human (B and E) kinases and proteasome subunits (C and F). G Phosphoproteomics analysis of uRBCs treated with Pf-derived EVs. Identified proteins were subjected to GO Biological Processes analysis (FDR < 0.00035). Statistical analyses in A and D were done using PANTHER Statistical Overrepresentation Test (Released 2019-07-11). Annotation versions and release date: GO Ontology database (Released 2019-10-08), PANTHER version 15 (Released 2020-02-14). Analyzed lists: Homo sapiens or Plasmodium falciparum Proteins IDs (Uniprot Accessions are listed in Table S1A, S1B). Reference list: Homo sapiens or Plasmodium falciparum (all genes in database). Test Type: FISHER, applying FDR correction, p < 0.05.
The proteasome is a conserved degradation machinery essential for maintaining cellular homeostasis. It comprises two functional species, the 26S and 20S proteasome complexes, which are not mutually exclusive. Degradation by the 26S proteasome, which is composed of the 19S and 20S particles, is an active process that is regulated by a series of enzymes that ubiquitinate the substrate and sensitize it to degradation. In contrast, the 20S proteasome, on its own, can degrade protein substrates in a ubiquitin- and ATP-independent manner, by recognizing unfolded or unstructured regions within its substrates. Hence, in order to validate the presence of 20S and/or 26S proteasome subunits within the Pf-derived vesicles, we purified the EVs by sedimentation into a density gradient via an OptiPrep centrifugation assay34. Western blot analysis of the EV pool (fractions 6–8) confirmed the presence of the 20S proteasome subunits PSMA1 (Fig. 3A), with SR1 and HSP90 serving as EV control markers. We were also able to identify PSMD1, a 19S subunit which forms the 26S proteasome (Fig. 3A).
Fig. 3: The 20S proteasome is assembled and functional within Pf-derived EVs.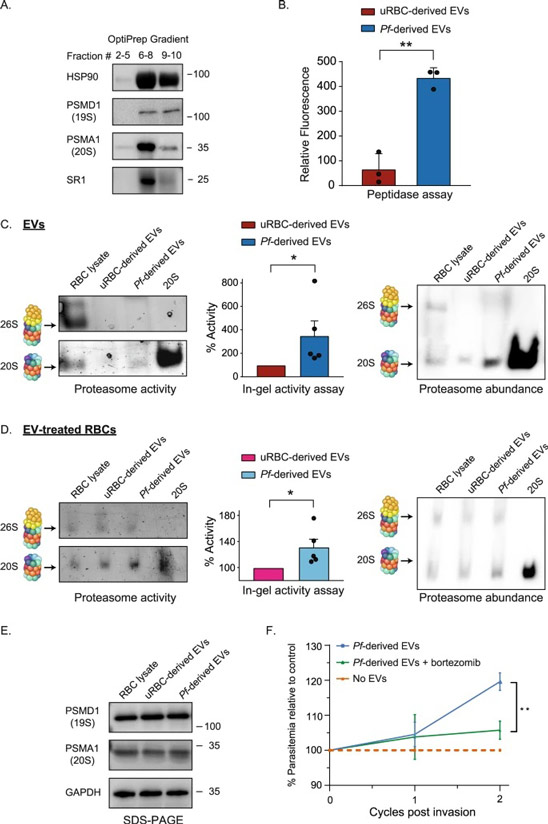
A Western blot analysis of the different fractions separated by OptiPrep velocity gradient centrifugation. Anti-PSMA1 antibody was used to probe the 20S proteasome complex, and anti-PSMD1 was used to identify the 19S particle. As a positive control, antibodies against the EV markers HSP90 and SR1 were used. This experiment was repeated independently three times with similar results. B Proteasome proteolytic activity measurement of Pf-derived EVs with the fluorescent peptide Suc-LLVY-AMC. As a control, uRBC-derived EVs were used. The data was normalized with respect to background levels of fluorescence in the presence of the proteasome inhibitor MG132. Averaging and statistical analysis were performed on three biological replicates using two tailed t-test assuming unequal variances. Error bars represent SD (standard deviation) (**p = 0.0032). C To validate the integrity and activity of the proteasome complex, uRBC-derived, and Pf-derived EVs were lysed and separated using 4% native-PAGE. The activity of the proteasome complexes was analyzed by incubating the gels with the fluorescent peptide substrate Suc-LLVY-AMC (left panel). Quantifications demonstrates the average of five independent biological replicates subjected to paired two-way t-test analysis using log-transformed measurements (*p = 0.028). Error bars represent SEM. The relative abundance of the complexes was assessed by Western blot analysis of the native gel (right panel, showing a representative gel from three independently repeated experiments with similar results.) using an anti-PSMA1 antibody. Samples of RBC lysate and purified 20S proteasome were used as controls. D Naïve RBCs were incubated with EVs purified from Pf-iRBCs or from uRBC cultures; samples were then lysed and separated using 4% native-PAGE and incubated with the fluorescent peptide (left panel) for activity analysis. Band intensity quantifications of five independent experiments were subjected to averaging and paired t-test analysis (*p = 0.021). Error bars represent SEM. Western blot of the native gel (right panel), using an anti-PSMA1 antibody. Samples of uRBCs and uRBCs treated with EVs derived from naïve RBCs were used as controls. E Denaturing gel of the samples analyzed in D. Anti-PSMA1 was used to probe the 20S proteasome, and anti-PSMD1 was used to probe the 19S complex. Glyceraldehyde-3-phosphate dehydrogenase (GAPDH) was used as a loading control. All images are representatives of three independent repeats (see Supplementary Fig. S9). F Parasite growth curve in EV-treated RBCs following incubation with Pf-derived EVs with or without the proteasome inhibitor bortezomib. Average and statistical significance was calculated for at least three independent experiments by comparing percentages (relative to control) between treatments with a two-way ANOVA, accounting for treatment and batch (No EVs n = 3, Pf-derived EVs n = 7, Pf-derived EVs + bortezomib N = 7), **p = 0.0015). Error bars represent SEM. Source data are provided in Supplementary Fig. S7 and in the source data file.
We validated that protein kinases within the secreted Pf-derived EVs are active, by monitoring Ser/Thr phosphorylation events that were increased upon ATP addition to isolated and sonicated Pf-derived EVs (Supplementary Fig. S5). Overall, our results imply that Pf-derived EVs contain kinases and 20S proteasome subunits, suggesting that these delivered proteins play a role in the observed host mechanical alterations and the resultant elevated parasitemia levels.
Pf-derived EVs affect phosphorylation of the RBC cytoskeleton
To investigate whether the delivered kinases (Fig. 2B, E) are involved in phosphorylation events of the host human RBCs, we treated naïve RBCs with Pf-derived EVs for either 5 or 15 min and then subjected them to phosphoproteomics analyses. In order to eliminate background noise from hemoglobin and cytosolic proteins, we focused our analysis on the ghost RBC fraction (i.e., the membrane component and bound cytoskeletal proteins). Treatment with EVs derived from healthy naïve RBCs served as control. In total, 930 distinct phosphorylation sites from 394 proteins were identified for each condition in at least 2 samples out of the 6 biological repeats (Supplementary Data 1). As samples from different blood donors give rise to different phosphorylation kinetics and different responses, we focused on phosphosites that were unique to the Pf-derived EVs. Namely, those that were identified in at least 3 out of the 6 samples in either time point and differential intensities with at least 2-fold change (p value < 0.1), or those that were identified in at least 3 Pf-derived EV samples and in none of the uRBC (Table 1). A total of 55 phosphosites corresponding to 43 proteins were elevated upon treatment with parasitic EVs, of which, 20 were unique to the parasitic EVs. Importantly, GO Biological Processes analysis of the differential phosphosites shows a clear enrichment of localization (FDR 0.00029) and transport (FDR 0.00074) proteins as well as those involved in cytoskeleton organization (FDR 2.24E-05) and actin cytoskeleton organization (FDR 4.03E-05) (Fig. 2G). Eight of the 11 cytoskeleton organization proteins comprising the unique phosphosites belong to the same protein cytoskeletal complex, namely, α-adducin (ADD1), β-adducin (ADD2), γ-adducin (ADD3), ankyrin-1 (ANK1), dematin (DMTN), Ebp41, spectrin α−chain (SPTA1) and spectrin β−chain (SPTB). These findings could underlie the AFM results demonstrating significant alteration of both the stiffness and morphology of the cytoskeleton.
To further validate the phosphoproteomics results, we immunoprecipitated dematin (one of the modified cytoskeleton proteins) from human RBCs treated with Pf-derived EVs (Supplementary Fig. S6) and performed an additional phosphoproteomics analysis on the pulled down fraction. We chose dematin due to the multiple Pf-derived EV-dependent phosphorylation sites identified on it (Supplementary Data 1). Again, dematin was phosphorylated at position Ser333 following Pf-derived EV treatment of naïve human RBC (Supplementary Fig. S6B,C). These results indicate that Pf-derived EVs induce a distinct phosphorylation pattern in cytoskeleton proteins of the RBC host.
Notably, we also found a unique phosphorylation on glycophorin-A (GYPA) after the parasitic EV treatment (Table 1). GYPA is known to be a receptor for Pf erythrocyte-binding antigen 175 (EBA-175)6. Thus, the phosphorylation can be part of the parasitic regulation. In addition, unique phosphorylations were seen on several channels: calcium-transporting ATPase-ATP2B4, SLC2A1-glucose transporter, AQP1 water-specific channel, and PIEZO1, a mechanically-activated ion channel. PIEZO1 was previously identified to be phosphorylated in other sites following Pf invasion42.
An intact, assembled and functional 20S proteasome is delivered by Pf-derived EVs to naïve RBCs
Given the large number of proteasome subunits identified within Pf-derived EVs (Fig. 2), we questioned whether their presence is linked to the membrane mechanical alterations and, thus, to the EV-mediated enhancement of parasite growth (Fig. 1A). We therefore examined whether the EV-20S subunits (Fig. 3A) are not just present but actually assembled and functional within the secreted vesicles derived from Pf-iRBCs. Initially, the peptidase activity of the proteasome was monitored in Pf-derived EV extracts using fluorogenic proteasome substrates43 (Fig. 3B and Supplementary Fig. S7A and S8). All three types of proteasome enzymatic activities were detected in the Pf-derived EVs, namely, caspase-like, chymotrypsin-like and trypsin-like. Using this assay, we found that the proteasome complex is highly active in Pf-derived EVs as opposed to control EVs (Fig. 3B).
Next, we examined whether the secreted EVs contain 26S and/or 20S assembled proteasome complexes. This was achieved by separating EV extracts on native-PAGE, followed by performing an in-gel proteasome activity assay (Fig. 3C left panel and Supplementary Fig. S9). The analysis revealed that Pf-derived EVs exhibit enhanced peptidase activity in comparison to EVs derived from uRBCs (Fig. 3C middle panel and Supplementary Fig. S7B). Moreover, unlike uRBC lysates, which contain both active 26S and 20S proteasome species, Pf-derived EVs contain the active, assembled 20S proteasome complex, but not the 26S particle. Western blot analysis using an antibody against the human PSMA1 subunit validated the presence of 20S proteasome particles in the Pf-derived EVs (Fig. 3C, right panel and Supplementary Fig. S9), as opposed to the low abundance of the 26S proteasome. Moreover, Western blot analysis with an anti-ubiquitin antibody of RBC lysates, before and after incubation with Pf-derived or control EVs, and of the EVs themselves, revealed no significant change in global ubiquitination levels (Supplementary Fig. S10). Taken together, our results indicate that functional 20S (and not 26S) proteasome complexes are found within Pf-derived EVs, suggesting that the restricted volume in the vesicles promotes 20S-mediated degradation rather than ubiquitin-dependent proteolysis. Although we are currently unable to precisely delineate the composition of the subunits of the EV-20S proteasome complex (parasitic vs. human), to the best of our knowledge, this is the first report exhibiting an intact and functional 20S proteasome encapsulated within EVs derived from infected RBCs.
To determine whether the presence of the 20S proteasome in Pf-derived EVs affects the global activity of 20S proteasomes in recipient naïve RBCs, we measured the 20S proteolytic activity in naïve RBCs before and after treatment with Pf-derived EVs. Indeed, our results indicate a moderate increase in total 20S proteasome activity in RBCs following the Pf-derived EV treatment (Fig. 3D and Supplementary Figs. S7C and S9), suggesting that the Pf-EV-20S proteasome increases the cellular proteolysis capacity upon uptake. This enhancement is also evident when comparing the 20S proteasome activity to that of the control experiment, in which RBCs were treated with EVs derived from uRBCs (Fig. 3D and Supplementary Figs. S7C and S9). Immunoblotting of native and denatured gels indicates no significant change in the level of both the 20S and 26S proteasomes (Fig. 3D right panel, 3E and Supplementary Fig. S9). However, this is expected, given the dilution of the EV protein content within the recipient cell and that in in vitro Pf cultures only ~5–8% of the total RBCs are infected by the parasites, suggesting that the specific increase in EV-derived 20S proteasome activity is relatively large.
Importantly, when we repeated the parasite growth experiment, but this time in the presence or absence of bortezomib, which reversibly inhibits the chymotrypsin-like activity of the proteasome44, we detected a significant decrease in parasite growth in the presence of the Pf-derived EVs and the proteasome inhibitor as opposed to treatment with Pf-derived EVs alone (Fig. 3F and Supplementary Fig. S7D). As a control, we validated that this observation is not due to the presence of bortezomib, by comparing parasitemia levels of RBC in the presence or absence of the proteasome inhibitor after pre-incubation with control EVs derived from uRBCs (Supplementary Fig. S11). Taken together, these findings suggest that the encapsulated 20S proteasome complexes play a role in promoting parasite invasion and thus its growth.
The secreted EV-20S proteasome alters the mechanical properties of human RBCs and disrupts the cytoskeleton network
To test whether the observed modulation in RBC stiffness upon Pf-derived EVs treatment (Fig. 1C, D) is associated with proteasome activity, we treated prior to incubation with naïve human RBC, Pf-derived EVs with proteasome inhibitors and measured, by way of AFM, the stiffness of the cells (Fig. 4 and Supplementary Fig. S12). As Pf parasites are growing in RBCs pooled from healthy donors, we replicated the mechanical measurements in three independent biological repeats of parasite cultures, which were introduced in each repeat to minimum of two different healthy donors (Fig. 4A and Supplementary Fig. S12). Corroborating our previous results (Fig. 1C), our findings show that the Pf-derived EV treatment significantly lowers the Young’s modulus values (Fig. 4A), from median of 588 Pa to 247 Pa (Fig. 4A), following the trend reported above. However, exposure of Pf-derived EVs to the proteasome inhibitor prior to the treatment countered the deformability effect, so that the Young’s modulus values were similar to those of the control set of untreated naïve RBCs with median of 479 Pa (Fig. 4A). The Tukey multiple comparison of means shows a significant difference between the control and proteasome inhibitor-treated sample relative to the Pf-derived EV infected RBCs (p < 0.001) whereas the control and proteasome inhibitor-treated sample are indistinguishable (p = 0.88). (Fig. 4A, B and Supplementary Fig. S12). These results imply that the 20S proteasome complexes shuttled within Pf-derived EVs are involved in modulating the deformability of the RBC.
Fig. 4: EV-20S proteasomes modulate the mechanical properties of RBCs.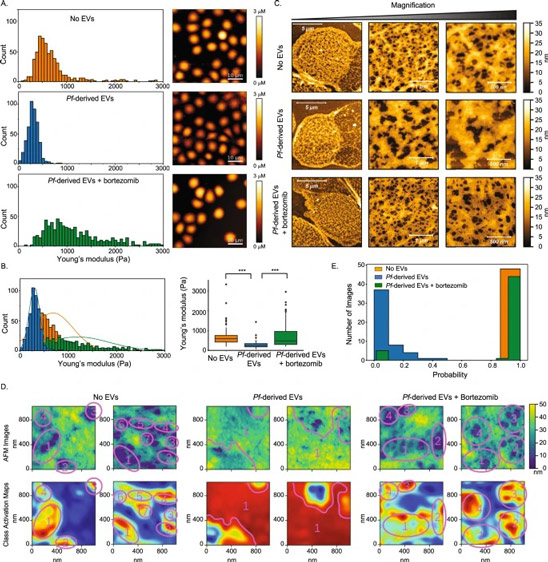
A Mechanical changes measured by AFM following Pf-derived EV incubation with naïve RBCs. Pf-derived EVs or Pf-derived EVs pretreated with proteasome inhibitor (bortezomib) were incubated with naïve RBCs. Pretreated cells were deposited on a mica surface for AFM topography and mechanical measurements. Distributions of Young’s modulus values shown in the left panel, each count in the histogram represents data from a separate indentation, nine different positions were measured near the center of each cell. Representative AFM images are shown in the right panel (scale bar 10 µm). B Superposition of the Young’s modulus distribution (left panel) and box plot of the average value from the four different experiments (right panel). Boxes represent the 25–75 percentiles of the sample distribution, with black vertical lines representing the 1.5 × IQR (interquartile range). The black dots represent outliers. Black horizontal line represents the median. Significance was calculated using one-way ANOVA, followed by a Tukey post hoc test. For A and B three independent experiments were performed, each comparing naïve RBCs, and naïve RBCs treated with Pf-derived EVs in the presence or absence of bortezomib, with total of 15 full images acquired for each condition. Number of cells measured were for No EVs n = 86, Pf-derived EVs n = 103, Pf-derived EVs + bortezomib n = 95, p < 0.001. C Representative AFM images recorded in air showing the cytoskeletal structures of naïve RBCs, naïve RBCs treated with Pf-derived EVs in the presence or absence of bortezomib. Three independent experiments were performed, with a total of 50 AFM scans for each type of cell treatment. D Demonstration of the CNN analysis discrimination. Two examples are shown for each cytoskeleton phenotype: uRBCs on the left, RBCs exposed to Pf-derived EVs without and with bortezomib treatment in the center and right, respectively. Top row shows AFM images and bottom row the class activation maps whereby discriminatory regions are red/yellow and uncorrelated or anti-correlated regions blue/green. Discriminatory regions are marked and labeled to guide the eye. It is clear that the “hole” regions are associated with healthy untreated RBC and RBC treated with Pf-derived EV and bortezomib and the “backbone” regions with the RBC affected with Pf-derived EVs. E CNN prediction, showing analysis made on the control set of naïve RBCs, and naïve RBCs treated with Pf-derived EVs in the presence or absence of bortezomib (proteasome inhibitor). The x-axis represents the probability for an image to resemble the uRBC control. The y axis represents the number of images in the analysis for a class type (untreated RBC, Pf-derived EV-treated RBC, and RBC treated with Pf-derived EV and bortezomib) which conforms to a given probability. The no EV and Pf-derived EV data is from the testing set.
Furthermore, we investigated whether the topological and morphological changes of the cytoskeleton network induced by Pf-derived EVs (as shown in Fig. 1D) are mediated by the activity of the delivered 20S proteasomes. This was achieved by treating Pf-derived EVs with and without proteasome inhibitor followed by incubation with host cells. RBCs were then imaged by high-resolution AFM. Here, too, following Pf-derived EV treatment, the fibrillar structure bunched together, leaving gaps in the cytoskeleton, i.e an increase in the mesh size of the cytoskeletal network (Fig. 4C middle panel). However, in the presence of the proteasome inhibitor, the Pf-derived EV-treated RBC sample showed a well-defined cytoskeleton (Fig. 4C, bottom panel), similar to that of control RBCs.
In order to objectively validate these morphological results regarding cytoskeleton disruption (as detected by ‘holes’ and filament ‘mashing’), we analyzed the collected AFM images obtained from all treatments (by two independent experiments) using a convolutional neural network (CNN) deep learning model (see methods section). The natural variations arising from biological and local kinetic variability in extent of the damage complicated the identification of image features that could be definitively related to the changes. The CNN model removes analysis bias and lends confidence to the interpretation of our results in light of the significant variability between different cells. We trained the model on the control untreated RBCs and Pf-derived EVs treated AFM images. We then used the trained model as an independent approach to predict the type of treatment to which the RBCs were exposed on the testing set.
This analysis provided two important results. Firstly, it identified the surface features from the cytoskeleton images associated with healthy or treated cells. Secondly, it provided a quantitative measure of the cell’s health. Figure 4D, E and Supplementary Fig. S13 presents this data. Figure 4D shows sample AFM images of healthy naïve RBCs, and Pf-derived EV-treated RBCs – the latter both untreated and treated with bortezomib – and the corresponding class activation maps. Comparing the maps for healthy naïve RBCs and Pf-derived EV-treated RBCs highlights the significant regions arising from the classification45. Within the limits of the reduced resolution inherent in these maps (see below), it is clear that the holes in the structure are discriminatory regions associated with the healthy cells and the backbone regions discriminatory for the treated ones. This identifies the transition from a semi-regular network of nodes that are connected by well-differentiated filaments surrounding holes, to a morphology where the holes have been reduced in size or in number, leaving a denser, amorphous background of membrane proteins, and without clearly differentiated filaments. Because the CNN process reduces the pixels used for each generation of feature maps, and the final weighted sum of the feature maps is upsampled to the original image size, we are unable to link the difference in data sets to high level tangible fine structural details such as the size and local arrangement of the individual fibrils. The quantitative specificity of two filters (activation of holes and backbone) is displayed in the distribution plots in Supplementary Fig. S13F, G.
Next, the full CNN analysis was used to assign the probability that a particular image belongs to the set of healthy or exposed cells. The closer the probability was to 1.0, the more closely the image resembled the control naïve RBCs (Fig. 4E and Supplementary Fig. S13B–E). The class activation maps and probabilities (Fig. 4D and Supplementary Fig. S13D, E) for Pf-derived EVs treated with bortezomib, associate those phenotypes with the healthy cell. Two sets were tested: one gave a probability of 94% (Supplementary Fig. S13D) and the other of 86% (Supplementary Fig. S13E) of being similar to the control images (i.e., uRBCs), indicating that proteasome inhibition prevents cytoskeleton disruption. These quantitative results strongly support the involvement of Pf-EV-20S in membrane cytoskeleton remodeling of the host RBC.
Phosphorylated cytoskeleton proteins are degradation substrates of the secreted EV-20S proteasome
Having established that (I) Pf-derived EVs trigger unique phosphorylation events among proteins belonging to the cytoskeleton network (Fig. 2G and Supplementary Fig. S5), and that (II) the Pf-EV-20S proteasome is functional and is involved in inducing mechanical alterations in the RBC (Figs. 3 and 4). We subsequently directed our efforts to determine whether these cytoskeleton proteins are, in fact, direct substrates of the Pf-EV-20S proteasome. We, therefore, measured the stability of five cytoskeleton proteins, pre and post Pf-derived EV treatment and in the presence or absence of a proteasome inhibitor. Western blot analysis detected a significant decrease in the levels of β-adducin, ankyrin-1, dematin, and Epb4.1 following treatment with Pf-EV-20S proteasomes, whereas no changes were observed in the levels of spectrin α−chain (Fig. 5A, B and Supplementary Fig. S14A). In contrast, treating Pf-derived EVs with a proteasome inhibitor stabilizes the level of the four proteins, suggesting that they are target substrates of the Pf-EV-20S proteasome.
Fig. 5: RBC cytoskeleton proteins are target substrates of the EV-20S proteasome.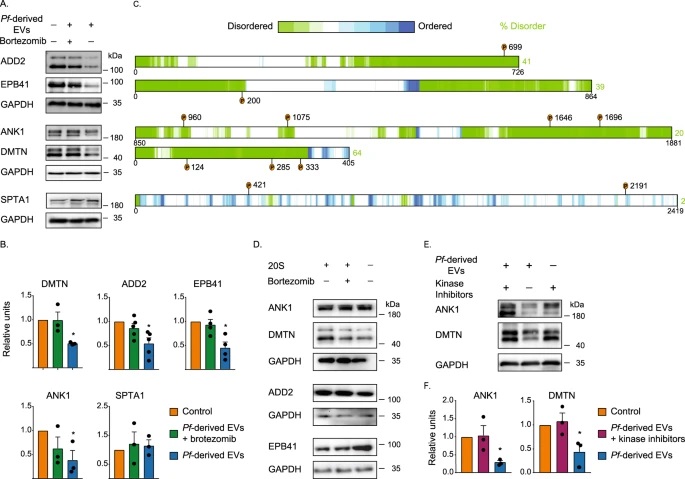
A Degradation of cytoskeletal proteins following Pf-derived EV treatment. Western blot analysis of naïve RBCs treated with Pf-derived EVs in the presence or absence of the proteasome inhibitor bortezomib. Commercial antibodies were used against five cytoskeletal proteins: β-adducin (ADD2), erythrocyte membrane protein band 4.1 (EPB4.1), ankyrin-1 (ANK1), dematin (DMTN), and spectrin α−chain (SPTA1). For each gel, GAPDH was used as a loading control. B Quantification and averaging of three independent experiments (as in A). Each protein’s value was divided by the control value for that batch, thus creating a pair of ratios for each batch. The ratios of Pf-derived EVs were tested against the ratios of the Pf-derived EVs + bortezomib using a paired two-way t-test, error bars represent SD (DMTN *p = 0.0102, ADD2 *p = 0.01339, EPB41 *p = 0.02769, ANK *p = 0.01339). C Graphical illustration of the disorder prediction of human β-adducin, Ebp4.1, ankyrin-1, dematin, and spectrin α−chain, generated by D2P2 (website: http://d2p2.pro), a database of protein disorder predictions. The level of disorder prediction is shown as a color intensity in which green segments represent disordered regions. The position of the unique phosphosites following treatment with Pf-derived EVs is indicated by orange circles. D Degradation assay of ghost naïve RBCs with purified 20S proteasome complexes. Bortezomib was used as a control for 20S proteasome inhibition. Panels display immunoblots using the relevant antibodies. Results represent three independent experiments (Supplementary Fig. S16). E Degradation of cytoskeletal proteins following Pf-derived EV treatment in the presence of kinase inhibitors mixture. Western blot analysis for naïve RBCs that were treated with Pf-derived EVs in the presence or absence of kinase inhibitor mixture (staurosporine and dihydrochloride). Antibodies were used against ankyrin-1 and dematin. GAPDH was used as a loading control (Supplementary Fig. S17). F Quantification and averaging of three independent experiments (as in E), using a paired two-way t-test, error bars represent SD (ANK *p = 0.0421, DMTN *p = 0.0402). Source data for A and D are provided in the source data file. Source data for B and F are provided in Supplementary Fig. S14.
It is known that the 20S proteasome can degrade only proteins that contain partially unfolded regions38,41, such as proteins harboring intrinsically disordered regions (IDRs), unstructured segments of more than 30 amino acids in length. Remarkably, our examination of the structural properties of the four substrates, using disorder prediction algorithms46, generated by D2P2, revealed that at least 20% of each of the four substrates’ residues is predicted to be IDRs, with β-adducin exhibiting 41%, ankyrin-1 20%, dematin 64%, and Epb4.1 39% disorder (Fig. 5C). Moreover, we noticed that the phosphosites that are unique to the Pf-derived EVs (Table 1) are all located within the unstructured regions, suggesting that they facilitate domain exposure that causes degradation (Fig. 5C). On the other hand, spectrin α−chain, which was not degraded by the Pf-EV-20S proteasome, displays only 2% disorder (Fig. 5A–C). Taken together, these results confirm that the four IDR proteins are susceptible to 20S proteasome-mediated degradation, suggesting that these critical components of the RBC cytoskeletal network are degradation targets of the Pf-EV-20S proteasome.
To determine whether 20S activity can alone degrade these proteins, irrespective of the other EV cargo components, we established an in vitro degradation system. In this system, the degradation levels of proteins are measured following treatment with purified 20S proteasome complexes47,48. After validating the activity of the purified 20S proteasome (Supplementary Fig. S15), 20S proteasome complexes were added to ghost RBCs, which are deprived of cytoplasmic proteins and, thus contain mainly the membrane fraction. We monitored the levels of dematin, β-adducin, ankyrin-1, and Epb4.1, using Western blot analysis before and after the addition of purified 20S proteasome complexes, in the presence or absence of the proteasome inhibitor. Notably, none of the proteins were degraded by the purified 20S proteasome complex, regardless of the proteasome inhibitor’s presence (Fig. 5D and Supplementary Fig. S16). Thus, the results suggest that in order to transform these cytoskeletal proteins into mature substrates of the 20S proteasome, an additional component within the Pf-derived EVs is required.
Since the cytoskeletal substrates acquire unique phosphorylation sites upon treatment with Pf-derived EVs (Figs. 2B, E and 5C and Table 1), we reasoned that this phosphorylation step might be necessary for shifting the proteins toward 20S proteolysis. This hypothesis is supported by the fact that the identified unique phosphorylation sites are all located within the unstructured regions, suggesting that they facilitate conformational transitions that cause degradation (Fig. 5B, C). To test this assumption, we treated naïve RBCs with Pf-derived EVs in the presence and absence of a mix of two known kinase inhibitors (staurosporine and dihydrochloride) and examined the level of two representative proteins, dematin and ankyrin-1. We found that both proteins were clearly stabilized upon cell treatment with Pf-derived EVs in the presence of these kinase inhibitors (Fig. 5E, F and Supplementary Fig. S14B and S17), suggesting that the phosphorylation serves as a precondition step prior to proteasome degradation. Collectively, our results indicate that RBC cytoskeleton proteins are direct degradation substrates of the delivered 20S proteasome and that this degradation is facilitated by delivery of Pf-derived EV kinases.
Discussion
Here we discovered a mechanism by which malaria parasites use EVs to facilitate their growth in their most essential host cell, the RBC (Fig. 6). In particular, we showed that assembled and active 20S proteasome complexes are delivered together with kinases to naïve RBCs through EVs that are released from Pf-infected RBCs. This leads to a 20S-proteasome-dependent process of cytoskeleton network remodeling, which eventually enhances parasitemia. We found that following Pf-derived EV introduction, two sequential steps take place. First, RBC proteins are subjected to specific phosphorylation, including many cytoskeletal proteins. Then, the delivered 20S proteasome mediates the degradation of phosphorylated cytoskeleton proteins by a ubiquitin-independent process. This mechanism, reduces the stiffness of the membrane, and therefore primes naïve RBCs for parasite invasion, eventually increasing the parasite’s growth capacity. Put together, our results combine to reveal a previously unidentified pathway of Pf survival in the human host RBC.
Fig. 6: Pf-derived EVs prime naïve host RBCs to enhance parasite growth.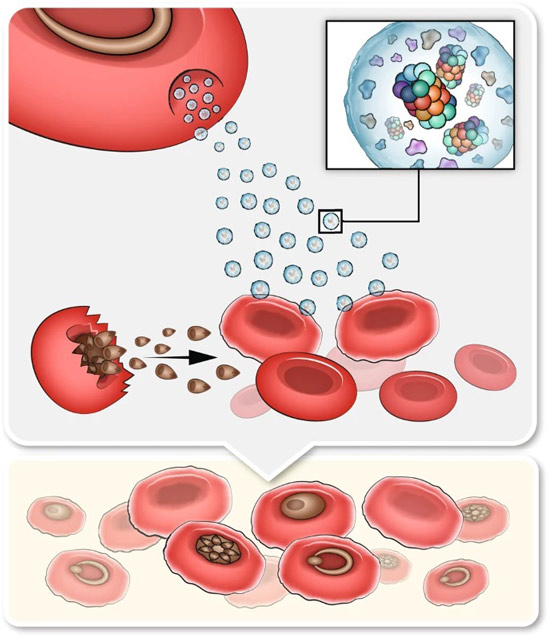
Diagram demonstrating the impact of Pf-derived EVs on naïve RBCs. Our results indicate that EVs enriched with active proteasome complexes and protein kinases invade naïve host RBCs. This process leads to the phosphorylation and subsequent degradation of RBC cytoskeleton proteins. Consequently, the cytoskeleton network of the recipient naïve RBC is disrupted and the cell membrane is remodeled, improving the invasive capacity of the malaria parasite.
The parasite invasion involves overcoming the barrier of bending the host membrane as it wraps the parasite49, and production of biophysical forces between the two cells: the parasite and the host RBC50. Here, we show that the parasite while growing inside the RBC, uses secreted 20S complexes to modify the biophysical properties of ‘future’ host cells before invasion, to increase membrane deformability for its benefit. Since increased deformability of the RBC is required for merozoite invasion6, we suggest that the secreted EV-20S complexes assist the parasite in a similar manner by increasing ‘in advance’ the host deformability of surrounding cells. Our observations indicate that the EV-20S proteasomes degrade the protein complexes that are involved in binding the membrane to the spectrin filaments, which form the backbone of the RBC cytoskeletal network, which in normal RBCs is adsorbed to the membrane and spans the whole surface of the cell. Upon degradation of these complexes, the spectrin network connectivity is broken, with spectrin filaments only partially bound to the membrane. These biochemical observations therefore naturally explain the reduced stiffness51 as indicated by the AFM measurements, and the observed damage to the network organization (Figs. 1 and 4). These observed changes in naïve RBCs are in accordance with previous reports that, within blood samples from malaria patients, the uRBCs surrounding iRBCs exhibit alterations and accelerated cell destruction52,53. The new observations also offer a natural explanation for the role of the ATP content of the RBC during the parasite invasion, with lower invasion in low-ATP-containing RBCs51,54.
We stress that the changes studied here are preparatory steps which condition the prospective host cell at the “pre-invasion” stage. The literature contains various studies on stiffening and softening of damaged RBCs in general, and those infected with the Pf parasite in particular6,7. In all of these cases, damage both by chemical agents and by biological processes enhanced the rate of infection following softening of the RBC, whereas infection was inhibited when the cell was stiffened in qualitative agreement with our findings. Our work provides a detailed insight into the specific nature of the biochemical process occurring and the mechanical implications, related to the different stages of the entire infection process.
The parasite’s specific preference for the 20S proteasome is interesting, given that the degradation of proteins is predominantly mediated by the ubiquitin-dependent 26S proteasomal pathway55, which comprises the 20S catalytic core particle and the 19S regulatory complex. The existence of the alternative, simpler degradation route mediated solely by the 20S proteasome is a recent discovery, (reviewed in refs. 38,41). Unlike its 26S counterpart, wherein substrate selectivity is achieved by ubiquitin tagging, the 20S proteasome cleaves proteins containing partially unfolded regions that can enter into its catalytic chamber. Although this field of research is still in its infancy, accumulating evidence indicates that the 20S proteasome degradation route is tightly regulated47, influencing various cellular processes, such as neuronal stimulation56,57, antigenic peptide production58,59, and post-translational processing60,61,62,63,64. When considering the requirements of 26S proteasome-mediated degradation, i.e., the dependency on ATP hydrolysis and ubiquitinylating enzymes (E1, E2, and E3), the preference of the parasite to harness the 20S-mediated degradation route is reasonable. Another critical factor is the restricted size of the malaria-derived EVs, 50–200 nm in diameter, which limits the encapsulation of 26S proteasomes (~45 × 20 nm), to a greater degree than 20S particles (~15 × 12 nm). Thus, degradation via the 20S proteasome offers a relatively compact system for eliminating proteins, one that reduces energy costs and is not dependent on an enzymatic cascade.
Considering the unique anuclear configuration of mature RBCs, an attempt at altering the conformation, function or integrity of RBC proteins can be achieved via protein post-translation modification (PTM) mechanisms. Because PTMs influence protein activity, folding, interactions, localization, stability and turnover, they are key in defining the protein structure-function relationship in every living organism, including in malaria parasites65. Among all PTM mechanisms, phosphorylation is perhaps the most well- studied to date in Plasmodium with numerous parasite and host cell protein kinases identified as essential for the development of the parasite throughout its entire life cycle66. Interestingly, many PTMs, including phosphorylation, are increasingly being shown to modify proteins harboring IDRs67, protein regions lacking stable tertiary and/or secondary structure, but characterized by highly dynamic structures extremely sensitive to changes in the environment66. Indeed, we found that the EVs secreted from Pf-iRBCs carry a large group of parasitic kinases (14 Pf kinases, Fig. 2B), of which many could potentially be involved in the phosphorylation of host membrane and cytoskeletal proteins. The observation that in addition to the delivery of 20S proteasomes, parasitic kinases are also delivered by the Pf-derived EVs, is reasonable given that under basal conditions 20S proteasomes are found both within uRBC and EVs derived from uRBCs while maintaining the integrity of the host’s cytoskeleton proteins. Thus, the parasite uses the kinases to specifically phosphorylate RBC cytoskeleton proteins. This, in turn, primes the target proteins towards degradation and, consequently, to cytoskeleton destabilization. Interestingly, and in line with our data, it was previously shown that Pf parasites secrete protein kinases outside of the iRBCs through an unknown mechanism, and it was suggested that EVs could play a role in this mechanism68,69.
Protein kinases are considered to be excellent drug targets for a variety of human diseases. To the best of our knowledge, only two Plasmodium protein kinases, PfCK168 and PfTL269, have been shown to date to be secreted by the iRBC to the extracellular milieu. Although PfCK1 and PfTKL2 were not identified in the proteomics analysis of parasite derived EVs, other protein kinases have been detected and remain likely candidates responsible for the observed increased phosphorylation of RBC cytoskeletal proteins. Inhibition of the kinase activity detected in Pf-derived EVs will be an exciting avenue for testing the potential of specific kinase inhibitors in preventing parasite expansion.
Another avenue for therapeutic intervention is the 20S proteasome. The malaria proteasome degradation pathway is considered a high-value druggable target due to its essential role in protein turnover and the parasite’s need to rapidly divide inside host cells70. This was recently confirmed by a study demonstrating the high ratio of essential or dispensable genes in the parasite proteasome system71. However, to date, most compounds tested against the parasite also inhibit the mammalian proteasome, resulting in toxicity that precludes their use as therapeutic agents72. Nevertheless, recent structural studies have concluded that the Pf-20S proteasome is sufficiently unique from the human proteasome for selective targeting73,74. Taken together with our findings, we anticipate that efficient inhibition of the EV-proteasome-dependent RBC priming process could serve as an avenue for therapeutic treatment. To realize such an approach, however, a first critical step is to determine whether the Pf-derived EV-delivered 20S proteasome is composed solely of human subunits, parasite components or a hybrid of the two.
We demonstrated that functional cellular machinery, the 20S proteasome, is transported by EVs in order to reshape the host membrane. Along these lines, recent proteomic data indicated the presence of subunits of the 20S proteasome in EVs derived from many pathogens, including pathogenic protozoans such as Acanthamoeba castellanii75 and Toxoplasma gondii76, helminth parasites such as Echinococcus granulosus77, as well as Leishmania78, Trichuris muris79, Trichomonas vaginalis80, and even fungus81. These results may therefore hint to a more general mechanism, in which pathogen-derived EVs use the degradation machinery to reshape the host proteome49.
From a broader perspective, active 20S proteasomes, and not 26S proteasomes, were recently discovered within EVs secreted from tumor-associated macrophages82, mesenchymal stem cells83, and endothelial cells84. Hence, it is possible that EV-mediated delivery of functional 20S proteasome complexes for cellular remodeling is a more common phenomenon then currently believed.
Methods
Parasite line and culture
The NF54 parasite line is a common human infecting Pf line and was obtained from the Malaria Research Reference Reagent Resource Center (MR4). Parasites were grown in pooled donor RBCs provided by the Israeli blood bank (Magen David Adom blood donations in Israel) at 4% hematocrit, and incubated at 37 °C in a gas mixture of 1% O2, 5% CO2 in N2. In order to culture the parasite, we used human RBCs that were pooled from approximately total of 25 different healthy donors. Parasites were maintained in RPMI medium pH 7.4, 25 mg/ml HEPES, 50 µg/ml hypoxanthine, 2 mg/ml sodium bicarbonate, 20 µg/ml gentamycin, and 0.5% (w/v) AlbumaxII (Invitrogen), as previously described85. P. falciparum cultures were tested for mycoplasma once a month using MycoAlert™ PLUS (LONZA, Cat# LT07-703).
Magnetic isolation of Pf -iRBCs
iRBCs were purified using a magnetized MACS column as described in86 with minor modifications. Briefly, the iRBC culture was loaded on a pre-washed MACS© CS column (Milteny Biotech, Cologne, Germany). Infected cells were eluted at a rate of one drop per one second, washed with 10 column volumes of pre-warmed RPMI and eluted to a fresh 50 mL tube.
EV isolation
EVs were isolated from either the NF54 strain in a relatively high P. falciparum-iRBC parasitemia level (~8%) at 4% hematocrit and highly synchronized parasite culture, 24 h post invasion into the RBC (Trophozoite stage), or from uRBC culture. We extracted EVs using a Beckman OPTIMA90X ultracentrifuge with a TI70 rotor, as previously described34. Briefly, 200–400 ml of a parasite growth medium was collected and then cellular debris were removed by centrifugation at 413 × g for 5 min, 1650 × g for 10 min (Eppendorf Centrifuge 5804), followed by centrifugation at 15,180 g for 1 h in a SORVALL RC5C PLUS, SLA-1500 rotor. The supernatant was filtered through a 0.45-µm filter, concentrated down using a VivaCell 100,000 MWCO PES (Sartorious Stedium) and ultracentrifuged at 150,000 × g for 18 h to pellet EVs. The pellet was resuspended in PBS−/− or in a cell culture medium. In all, 100 μL suspension of EVs yields a typical concentration of 1 × 10¹² particles per ml. Purified EVs were added into medium of growing Pf-iRBCs culture.
Nanoparticle tracking analysis
EV size and concentration distribution was performed using nanoparticle tracking analysis (Malvern Instruments Ltd., NanoSight NS300) performed at 20 °C19. Sample size distributions were obtained in a liquid suspension (1:1000 dilution in PBS−/−) by the analysis of Brownian motion via light scattering. The camera level was set to 13 and the gain to 1, blue (405 nm) or green (488 nm) lasers without filter, following the manufacturer’s instruction. The data was analyzed by using NTA 2·1 software (NanoSight).
OptiPrep gradient fractionation
EVs were fractionated by centrifugation (250,000 × g, 18 h, 4 °C) in a SW41 rotor (Beckman Coulter, Fullerton, CA, USA) through a continuous 5–40% OptiPrep (Sigma-Aldrich, cat# D1556) gradient. Fractions (1 ml) were collected from the top of the gradient for further analysis.
Parasite growth assay and immunofluorescence labeling
To monitor parasitemia levels, Pf-iRBCs were collected and incubated with a mixture of nucleic acid stain dyes: The DNA dye Hoechst 33342 (Invitrogen cat# H1399) was titrated to 5 μM and the RNA dye Thiazole Orange (Sigma-Aldrich, cat# 390062) was diluted 1:100,000 from a 1 mg/ml stock. Pf-iRBCs were incubated for 30 min at 37 °C and were analyzed in a Bio-Rad ZE5™ flow cytometer. Parasitemia (rings) was counted 3 or 5 days after infection by microscopy of Giemsa stained thin smears, using an upright NIKON objective 100x Plan Apo and NIS Element software version 4.4.
For parasite growth assay in the presence of bortezomib-treated EVs: Medium harvested from uRBC culture containing EVs was treated with 0.05 μM bortezomib, at 37 °C for 2 h. Following this step, the treated EVs were washed with PBS via ultracentrifugation spin ON. uRBC-derived EVs with or without bortezomib were introduced to naïve RBCs for 18 h. Following RBC pretreatment, magnet-purified late stage-parasites (0.5%) were introduced and parasitemia was monitored after 12 h (ring stage) using flow cytometry (Biorad-ZE5™). The data was analyzed by using Everest v. 2.3.03.0 software (BioRad). The FACS gating strategy is demonstrated in Fig. S18.
Preparation of large unilamellar vesicles
LUVs were prepared with a lipid composition of DOPC:DOPE:DOPS:SM:chol of 20:5:15:25:35 (molar ratio), resembling the RBC plasma membrane composition as previously described33. Lipid solution in chloroform of the different phospholipid species were mixed to the desired molar ratios in a glass vial, and organic solvent was evaporated by 12 h of vacuum pumping. For labeled LUVs, the lipids were stained with 2% mol of DiI and DiD in chloroform before evaporation. The lipid film was then hydrated with PBS (Ca2+-/Mg2+-at 40 °C to reach the desired concentration and gently vortexed. The resulting MLV suspension was then sonicated for 10 min to disperse larger aggregates and the liposomal suspension was extruded 21 times through polycarbonate filters (100 nm pore size, Avanti Polar Lipids) using a mini-extruder (Avanti Polar Lipids). Size and concentration were verified using NTA and the liposomal suspension was used within 2 weeks from the extrusion. DiI (1,1′-dioctadecyl-3,3,3′,3′-tetramethylindocarbocyanine perchlorate) and DiD (1,1′-Dioctadecyl-3,3,3′,3′-Tetramethylindodicarbocyanine 4-Chlorobenzenesulfonate Salt) membrane dyes were purchased from Thermo Fisher as a powder and dissolved in chloroform at 1 mM final concentration. All chemicals had high purity and were used without further purification.
Membrane mixing assay
All experiments were performed using a Cytation 5 Imaging Reader plate reader (BioTek) with a 96-well plate. DiI-DiD labeled liposomes were diluted in 200 µl PBS (Ca2+-/Mg2+-) per well to reach a final concentration of 10 µM, and fluorescence intensity of the donor (DiI) was recorded every 60 s for 30 min, with excitation wavelength of 530 nm and emission wavelengths of 570 nm. Subsequently, unlabeled Pf – derived EVs or unlabeled LUVs were added in each well to reach a labeled: unlabeled ratio of 1:9 particles and DiI fluorescence intensity was recorded for 1 h every 60 s. Finally, Triton X-100 was added in each well to reach 0.1% final concentration and fluorescence intensity was recorded for 15 min every 60 s. The emission fluorescence for each time point was measured as In. The emission fluorescence of the untreated liposomes was measured as I0, and that of the liposomes solubilized with 0.1% TRITON X-100 was defined as I100. The percentage of membrane mixing at each time point is defined as: donor relative intensity (% of TRITON X-100) = (In − I0) × 100/(I100 − I0). All measurements were performed at 37 °C. The data was analyzed by using Gen5™ v. 3.04 software (BioTek).
Size distribution NTA analysis for EV fusion events
LUVs and Pf-derived EVs were mixed in a 1:1 ratio (particles: particles) to a final concentration of 1–10 × 108 particles/mL in 1 mL of filtered PBS (Ca2+-/Mg2+-) and size distribution was immediately measured using a NanoSight NS300. Briefly, approximately 1 ml solution was loaded into the sample chamber of an LM10 unit (NanoSight) and five videos of 60 s were recorded. Data analysis was performed with NTA 2·1 software (NanoSight). This size distribution was considered as time 0 min of the interaction between LUVs and EVs. Subsequently, EVs from the same biological sample were mixed with LUVs at the same particle ratio and incubated at 37 °C for 30 min, after which size distribution was measured using the same recording parameters and detection threshold of the sample at time 0 min. The resulting size distribution curves were then analyzed by summing for each individual technical repeat of the acquisition the number of particles above the D90 parameter value (the diameter where ninety percent of the distribution has a smaller particle size and ten percent has a larger particle size) obtained at time 0 min, and the fraction of particles above D90 was calculated as: number of particles above D90/ total number of particles. The statistical significance of the fraction above D90 at time 0 between the two different time points was calculated with a two-sided t-test with a p-value of 0.05.
Protein extraction from naïve red blood cells
Naïve human RBCs were washed with iso-osmotic buffer (103 mM Na2HPO4, 155 mM NaH2PO4, Sigma-Aldrich), followed by lysis with RIPA buffer (150 mM NaCl, 1% Triton X-100, 0.1% SDS, 50 mM Tris, 0.5% Sodium deoxycholate, pH 8.0) with or without a protease inhibitor mix (1.5 mM Aprotinin (A1153), 1.5 mM Pepstatin A (P5318), 2 mM Leupeptin (L2884), 0.5 mM PMSF (P7626) (Sigma-Aldrich)) and Halt™ Phosphatase Inhibitor Cocktail (78420, Thermo Fisher scientific). Cells were incubated with the RIPA buffer for 15 min on ice, followed by 10 min centrifugation on the maximum speed at 4 °C. The supernatant was collected and hemoglobin was depleted using TALON metal affinity beads (635502 Takara-Clontech). For ghost purification, the pellet was re-washed with 1 mL iso-osmotic buffer until the membrane pellet became clear.
Western blot assay
Proteins were separated on 10–15% SDS-PAGE and transferred to nitrocellulose membranes. The primary antibodies used for detection were obtained commercially from Abcam®. anti-dematin (ab226357, dilution 1:1000), anti-adducin 2 (beta-adducin) (ab251821, dilution 1:500), anti-Epb4.1 (ab185704, dilution 1:1000), anti-ankyrin-1 (S288A-10, dilution 1:1000) (ab212053), anti-HSP90 (AC88) (ab13492, dilution 1:10,000), anti-GAPDH (6C5) (ab8245, dilution 1:5000), anti-alpha 1 spectrin (17C7) (ab11751, dilution 1:1000), anti-SR1 (ab71983, dilution 1:1000), anti-phospho Ser/Thr, anti-Phe (ab17464, dilution 1:1000), anti-PSMD1 (ab2941, dilution 1:5000), anti-PSMA1 (ab140499, dilution 1:5000) and anti-ubiquitin (PW0930, Enzo, dilution 1:1000). Secondary antibodies used are Goat anti Rabbit IgG-HPR (111-035-003, Jackson, dilution 1:10000), and Goat anti mouse IgG-HRP (115-035-003, Jackson, dilution 1:10,000). Western blot analyses were repeated at least three times. Image collection was performed using the ThermoScientific MyECL Imager V. 2.2.0.1250 and Amersham Imager 680 (GE Healthcare Life Sciences). Quantifications of the blots were done using ImageJ 1.51k, R v.4 software.
Analysis of total ubiquitination in RBCs and EVs was performed as follows: naïve RBCs (~1 × 10⁸ cells) were incubated with Pf-derived EVs and control EVs (40 μl of EVs at a concentration of 2 × 10¹¹ particles/ml) and analyzed for total ubiquitination by Western blot analysis using an anti-ubiquitin antibody. Total ubiquitination in EVs was similarly monitored in extracts from 50 μl of EVs at a concentration of 2 × 10¹¹ particles/ml).
Kinase activity for P. falciparum-derived EVs
Equal volumes of EVs were sonicated using BRANSONIC 5 for 10 s with ATP in kinase reaction buffer (20 mM Tris-HCl pH 7.5, 10 mM MgCl2) prior to 30 min incubation. Sample buffer was immediately added and the mixture heated to 60 °C. Samples were subjected to 10% SDS-PAGE gel separation.
Prediction of protein unstructured regions
To predict unstructured regions in cytoskeleton proteins, we analyzed the protein sequence using the Database of Disordered Proteins Predictions (http://d2p2.pro/). The consensus sequence (>75%) among the nine different prediction algorithms used by the software is displayed.
20S proteasome in-gel activity assay
The catalytic activity of the 20S and 26S proteasomes was assayed as we have previously done87. Briefly, 20 µg/μl of RBC lysates or extracts from 1 × 10¹¹ EVs were separated on 4% native-PAGE using native running buffer (0.09 M Tris-base, 0.09 M boric acid, 1 mM EDTA, 2.5 mM MgCl2, 0.5 mM ATP and 1 mM DTT). Gels were soaked in 10 ml native buffer supplemented with 100 μM of the proteasome fluorogenic peptide substrate Suc-LLVY-AMC (Bachem I-1395.0100) and 0.02% SDS. Gels were incubated in the dark at 30 °C for 15–30 min and then imaged under ultraviolet light. Proteasome subunits were further verified by western blot using an anti-PSMA1 antibody and an anti-PSMD1 antibody.
Proteasome activity assay in solution (peptidase assay)
To monitor 20S proteasome activity, we measured the hydrolysis of 100 µM of the proteasome fluorogenic peptide substrate, Suc-LLVY-AMC, as done previously87. Briefly, 20 µl vesicles at a concentration of 1.5–2 × 10¹² particles per ml were sonicated in a bath sonicator for 10 s and then incubated with the fluorescent peptide for 1 h in the dark at 37 °C. After incubation, the fluorescence of the hydrolyzed AMC groups was measured with a microplate reader (Infinite 200, Tecan Group, Tecan icontrol v. 3.9.1.0), using an excitation filter of 380 nm and an emission filter of 460 nm.
Time course experiments were performed in a similar manner, using three fluorescent substrate peptides for the three catalytic activities of the 20S proteasome; Suc-LLVY-AMC for the chymotrypsin-like activity, Z-Leu-Leu-Glu-AMC (BML-ZW9345, Enzo) for the caspase-like activity and Boc-Leu-Arg-Arg-AMC (BML-BW8515, Enzo) for the trypsin-like activity. Measurements were taken at 1 min intervals over a period of 90 min. During the measurement, the plate was kept at 37 °C.
Cytoskeleton protein degradation assay
Pf-derived EVs were produced as described above. Following the VivaCell filtration, media containing EVs was incubated with 0.05 μM bortezomib (Merck 5.04314.0001) at 37 °C for 2 h. Naïve RBCs were incubated with Pf-derived EVs with or without pretreatment with bortezomib, for 3 h. The treated cells were then lysed and separated by 10% SDS-PAGE. Protein amounts were evaluated using a Western blot assay.
In vitro degradation assay of cytoskeleton proteins were done by incubating ~7 μM of purified 20S proteasomes with RBC ghost cells (8 mg/ml total protein) for 3 h at 37 °C in the presence or absence of the 20S proteasome inhibitor bortezomib (0.05 μM). Samples were then separated using 12% SDS-PAGE and protein amounts were evaluated using Western blots.
Cytoskeleton protein degradation assay in the presence of kinase inhibitors
In all, 40 µl of EVs (in a concentration of 2 × 10¹¹ particles/ml) were incubated with or without kinase inhibitor mixture (14 nM (R)-DRF053 dihydrochloride, D6946-5MG, Sigma Aldrich, 1 µM Staurosphorine, (kindly provided by G-INCPM, Weizmann Institute) (v/v) for 1.5 h at 37 °C. Treated EVs were incubated for 3 h with naïve RBCs, followed by protein extraction (as described above) and separation on 10% SDS-PAGE. As controls, cells were incubated with kinase inhibitor mixture alone.
Proteomics analysis of Pf-derived EVs
TPCK-treated soybean trypsin and trypsin inhibitor were purchased from Worthington Biochemical Corporation. Parasites were grown to the trophozoite stage and then gelatin-floated for 45 min to enrich for iRBCs. 1 × 10⁸ iRBCs and control uRBCs were digested with 1 mg/ml trypsin or PBS vehicle control at 37 °C for 1 h. Next, 4 mg/ml trypsin inhibitor was added and the samples were incubated at room temperature for 15 min. Samples were then lysed with 1% Triton-X 100 (Sigma) in PBS with Protease Inhibitor Cocktail (Roche) on ice for 20 min, centrifuged, and the supernatant was discarded. The pellet was washed with 1% Triton-X 100 and solubilized with 2% SDS in PBS with protease inhibitors. EVs were digested with 2 μg/ml trypsin for 15 min at 37 °C, in the presence or absence of 0.1% Triton-X 100, prior to the addition of 1 mg/ml trypsin inhibitor.
Tryptic peptides were separated by nano-flow reversed-phase liquid chromatography on a nanoACQUITY UPLC system (Waters, USA). Samples were loaded onto a 20-mm pre-column with 180 μm I.D. and 5 µm C18 silica bead in 5% buffer B at a flow rate of 10 µl/min and then resolved on a 100-mm analytical column with 75 μm I.D. and 1.7 µm C18 silica beads using a 90-min gradient set at a flow rate of 0.4 μl/min from 95% solvent A (0.1% formic acid in Milli-Q water) to 60% solvent B (0.1% formic acid, 80% acetonitrile in Milli-Q water). MS data were acquired on a Q-Exactive mass spectrometer fitted with a Proxeon nano-ESI source (Thermo Fisher Scientific). High mass-accuracy MS data was obtained in a data-dependent acquisition mode with the Orbitrap resolution set to 75,000 and the top-10 multiply charged species selected for fragmentation by HCD (single charged species were ignored). The ion threshold was set to 15,000 counts for MS/MS. The CE voltage was set to 27 V.
Data analysis and functional annotation of proteomic data
Mass spectra peak lists (MGF files) were extracted from the LC-MS/MS raw data using the software package ProteomeDiscoverer v. 2.1 (Thermo Fisher Scientific). For peptide identification and protein inference, the MGF peak lists were searched against a composite non-redundant protein sequence database comprising common contaminants and Homo sapiens and Plasmodium falciparum sequences downloaded from UniProtKB. Mascot v. 2.4 (www.matrixscience.com) was used as the primary database search engine. In-house software tools (MSPro and Digger, v. 1.0; http://repository.unimelb.edu.au/10187/18167) were used to collate and merge the peptide and protein information across biological replicates. The database search parameters consisted of carbamidomethyl of cysteine as a fixed modification (+57 Da) and NH2-terminal protein acetylation (+42 Da), N-terminal Q->pyroglutamic acid (−17 Da) and oxidation of methionine (+16 Da) as variable modifications. A precursor mass tolerance of ±10 ppm, #13 C defined as 1 and a fragment ion mass tolerance of ±20 ppm was used. The specified enzyme was trypsin/P, allowing for up to two missed tryptic cleavage sites. The program MSPro was used as a wrapper for parsing Mascot search result files and instantiating the post-processing software tool Percolator v.2.1088. The search results from the two independent biological replicates were analyzed individually and in combination in order to generate an inferred protein list for both Plasmodium falciparum and Homo sapiens (host) based on significant scoring (posterior error probabilities ≤1%) peptide identifications. Significant peptide matches were further categorized as unique or degenerate on the basis of peptide sequence and assigned to protein groups based on the principle of parsimony (Occam’s razor). The inferred proteins for Homo sapiens and Plasmodium falciparum were submitted to The Gene Ontology Resource (http://geneontology.org)89,90 and DAVID Bioinformatics Database (http://david.ncifcrf.gov)91,92 for functional annotation and enrichment analysis. The LC-MS/MS raw data were also analyzed using MaxQuant v1.6.14 using default parameters for Thermo Q-Exactive data against the identical FASTA sequence database. The mass spectrometry proteomics data have been deposited to the ProteomeXchange Consortium via the PRIDE93 partner repository with the dataset identifier PXD023353 and 10.6019/PXD023353.
Phosphoproteomic analysis of EV-treated RBCs
Naïve RBCs were treated with EVs derived from Pf-iRBCs and from uRBCs for two time points 5 and 15 min. Ghost samples were harvested and the pellet was subjected to mass spectrometry analysis. The samples were dissolved in 10 mM DTT, 100 mM Tris, 5% SDS, boiled at 95 °C for 5 min, and subjected to two cycles of sonication. The samples were precipitated in 80% acetone and washed three times with 80% acetone. Protein pellets were dissolved in 9 M Urea and 400 mM ammonium bicarbonate and then reduced with 10 mM DTT (60 °C for 30 min), modified with 5 mM iodoacetamide in 100 mM ammonium bicarbonate (room temperature for 30 min in the dark) and digested in 2 M Urea, 25 mM Tris with modified trypsin (Promega) at a 1:50 enzyme-to-substrate ratio overnight at 37 °C. An additional, second trypsinization was done for 4 h.
The tryptic peptides were desalted using C18 tips (Oasis), dried and resuspended in 0.1% formic acid. Twenty percent of the resulting tryptic peptides were analyzed by LC-MS-MS. The remaining 80% of peptides (in 40% acetonitrile, 6% TFA) were enriched for phosphopeptides on titanium dioxide (TiO2) beads. Titanium beads were pre-washed (80% acetonitrile, 6% TFA), mixed with the peptides for 30 min at room temperature, and then washed with 30% acetonitrile with 3% TFA and then with 80% acetonitrile with 0.1% TFA. Bound peptides were eluted with 20% acetonitrile with 325 mM ammonium hydroxide, followed by 80% acetonitrile with 325 mM ammonium hydroxide. The resultant peptides were desalted using C18 tips and analyzed by LC-MS-MS.
In all, 2 µg of the resultant peptides were analyzed by LC-MS/MS using a Q-Exactive plus mass spectrometer (Thermo) fitted with a capillary HPLC (easy nLC 1000, Thermo-Fisher). The peptides were loaded onto a C18 trap column (0.3 × 5 mm, LC-Packings), connected online to a homemade capillary column (20 cm, 75 µM ID), packed with Reprosil C18-Aqua (Dr. Maisch GmbH, Germany) in solvent A (0.1% formic acid in water). The peptide mixture was resolved with a 5–28% linear gradient of solvent B (95% acetonitrile, 0.1% formic acid) for 120 min, followed by a 5-min linear gradient from 28 to 95% of solvent B and then 25 min at 95% acetonitrile with 0.1% formic acid in water at a flow rate of 0.15 μl/min. Mass spectrometry was performed in a positive ion mode (350–1800 m/z mass range, 70,000 resolution) using repetitively full MS scan followed by collision induced dissociation (HCD, 35 normalized collision energy) of the 10 most dominant ions (>1 charge) selected from the first full MS scan. MS data were acquired using the Dionex Chromatography MS Link (ThermoScientific) and Xcalibur v. 4.2 (ThermoScientific) software. The mass spectrometry phosphoproteomics data have been deposited to the ProteomeXchange Consortium via the PRIDE partner repository with the dataset identifier PXD018154.
Phosphoproteomic data analysis
The mass spectrometry data was analyzed using the MaxQuant software 1.5.2.8. (www.maxquant.org) for peak picking identification and quantitation using the Andromeda search engine, searching against the Human and Pf Uniprot database with a mass tolerance of 20 ppm for the precursor masses and 20 ppm for the fragment ions. Methionine oxidation, phosphorylation (STY) and protein N-terminus acetylation were accepted as variable modifications and carbamidomethyl on cysteine was accepted as a static modification. Minimal peptide length was set to six amino acids and maximum of two missed cleavages was allowed. Peptide- and protein-level false discovery rates (FDRs) were filtered to 1% using the target-decoy strategy. The protein table was filtered to eliminate identifications from the reverse database and common contaminants. The data was quantified by label-free analysis using the MaxQuant software, based on extracted ion currents (XICs) of peptides, enabling quantitation from each LC/MS run for each peptide identified in any of the experiments.
Immunoprecipitation of dematin
Packed RBCs were incubated with equal amounts of Pf-derived EVs or uRBC-derived EVs for 30 min at 37 °C. Following incubation, the cells were lysed in RIPA buffer, hemoglobin was depleted, and 15% of the total lysate was taken as control. Immunoprecipitation using a dematin antibody was performed following the manufacturer’s protocol of Bio-Rad SureBeads™ Protein G magnetic beads protocol. Samples were then separated by SDS-PAGE.
Sample preparation for cytoskeleton AFM imaging
Freshly cleaved mica surfaces were incubated with 0.1% polyLysine solution for 2 h and then rinsed with PBS. This was followed by the deposition of 100 µl RBCs in PBS (106 cells per ml) which was incubated for 10 min after which the cells were shear washed with 60-ml 5P8-10 buffer (5 mM Na2HPO4/NaH2PO4, 10 mM NaCl, pH 8.0) using a syringe at a ~20° angle from the surface plane. The cytoskeleton-exposed samples were dried with nitrogen flow and kept in a desiccator overnight (or longer).
AFM cell stiffness measurements
RBCs floated in RPMI medium without Albumax were deposited onto freshly cleaved mica for 5 min and then washed with the same medium by infinite dilution. AFM imaging and indentations were carried out using a JPK Nanowizard III AFM (Berlin, Germany) in QI mode Control Software v.6.1.159. This mode allows the collection of force–distance curves at each pixel, which can be used to acquire topographic images simultaneously with mechanical data. With aid of these images, force curves for analysis were taken near the center of the cell. The elastic modulus was calculated after calibration of the cantilever sensitivity and spring constant, by applying a contact mechanical Hertzian model (using JPK data processing software version 6.1.86) presuming a Poisson ratio of 0.5 and the radius of the colloidal probe tip used. This analysis treats the RBC as a uniform three-dimensional elastic medium, and is used extensively in the literature to characterize changes in the stiffness of the RBC94,95,96,97.
The indentation measurements were conducted with various tips; a gold colloid (R-1.8 µm, spring constant ≈ 0.11 N/m) (sQUBE Co. CP-PNPS-Au-B), a borosilicate glass colloid (R-2.9 µm, spring constant ≈ 0.013 N/m) (sQUBE Co. CP-qp-SCONT-BSG-A)) for which the colloidal probe tip radius was determined by scanning electron microscope (JEOL JSM-7000F) images. We also used a qp-BioAC- Cl CB3 probe (Nanosensors). These probes have a rounded tip apex with typical radius 30 nm, spring constant ≈ 0.06 N/m. For the 200 nm indentation depth which we used with these probes, the tip shape was chosen as a cone with an opening half-angle of 22 degrees in the Hertz model calculations. In all indentation experiments, the cell topography was inspected before and after the indentation to ascertain their integrity after the indentation.
For bortezomib-treated EVs: culture medium containing EVs was treated with 0.05 μM bortezomib, at 37 °C for 2 h, followed by wash via ultracentrifugation. EVs with or without bortezomib were introduced to naïve RBCs for 2 h at 37 °C in albumax-free media before AFM stiffness measurements. For epoxomicin treated-EVs - epoxomicin (HY-13821, MedChemExpress) was used at a concentration of 10 μM. Incubation with RBCs in albumax-free media was done for 2 h at 37 °C before the AFM stiffness measurement.
AFM cytoskeleton imaging
Initial AFM imaging was carried out by using a MultiMode AFM with Nanoscope V electronics (Bruker AXS SAS, Santa Barbara, CA) controlled with Nanoscope 9.2 software (Build R2Sr1.130547). Scans were made in ac mode using a silicon probe (Olympus Co. AC240) or in PeakForce Tapping mode using a Super Sharp Silicon tip on a silicon nitride lever (Bruker Co. SAA-HPI-SS).
The large amount of images necessary to train and test the CNN model required high image throughput. This was achieved with a fast-scan AFM system, using photothermal off-resonance tapping and small cantilevers, which fits on the base of the commercial MultiMode AFM system. The fast scanning AFM head and electronics were designed by Georg E. Fantner’s group, Ecole Polytechnique Fédérale de Lausanne, Lausanne, Switzerland98, images were collected with custom software from the group of Georg Fantner, EPFL, (IbniAFMController-BetaVersionv2.0.16-20190117 written under Labview environment). Scans were made with a silicon tip on a silicon nitride cantilever- (Bruker FASTSCAN-B). All cytoskeleton images were analyzed using Gwyddion 2.55 software99.
Image processing and machine learning
We applied deep learning100,101 to classify RBCs as being healthy (non-treated control uRBCs) or infected (Pf-derived EVs treated) by evaluation of fast-scanning AFM (fs-AFM) images. Specifically, we applied a convolution neural network (CNN) model that successfully quantified and verified the difference between cytoskeleton images from healthy cells as compared to those which were exposed to Pf-derived EVs. Furthermore, the model was applied to cytoskeleton images for which the Pf-derived EVs were pre-treated with the bortezomib proteasome inhibitor. The CNN deep learning approach applied here is similar to those applied recently for biomedical and texture image classification102,103,104,105,106,107,108,109,110.
Two data sets of images were obtained with the fs-AFM, corresponding to two experiments performed on different days, with different AFM tips. Batch 1 contains 60 healthy cytoskeleton images and 65 Pf-derived EV-exposed cytoskeleton images, and batch 2 contains 51 healthy (no EVs) cytoskeleton images and 58 Pf-derived EV-exposed cytoskeleton images. The size of each 2 µm × 2 µm image is 512 × 512 pixels. At this scale and resolution, the number of usable images can be increased by dividing each image into four non-overlapping images of size 256 × 256 pixels. This increased the data set size by a factor of four to 500 images in batch 1 and 436 images in batch 2.
Five different CNN architectures were then examined. For tuning the different CNN architectures, 20% of the images were taken as a test set (with stratification), i.e., 100 and 88 images for testing in batches 1 and 2 respectively. The remaining 80% 512 × 512 images were further randomly grouped (with stratification) into 20 different sets, 75% for training and 25% for validation. Again, each image in each set was divided into four non-overlapping images of size 256 × 256 pixels.
In training/validation splits, the training set alone was image-augmented by four rotations: 0°, 90°, 180°, and 270°, and two flipping operations – horizontal and vertical. The image augmentation increased the number of images in the training set to exceed 2000 in both batches. This has been suggested as an approach to reduce over-fitting101. This augmented training set was trained until it reached an accuracy of 96% on training or exceeded 30 epochs. To define the discriminative features in each data set, features from the last feature activation maps are weighted according to their importance, and summed to give the class activation map which ranks the importance of various surface features. Then the class activation map is upsampled to the size of the input image. For obtaining the class activation maps we used the trained model with the necessary modification as described in45 and fine-tuned the weights of the last layer (obtained from the global 2D average pooling) that connected to the output unit.
After training the model, we performed accuracy evaluation on the validation sets.
On average, we found that the CNN architecture presented in Supplementary Fig. S13A gives the highest accuracy on the validation sets compare to the different architectures tested (different number of filters, neurons, and layers), with average accuracy of ~90%. To obtain further insights, we use this architecture and trained the model again on all data (training + validation, except the testing set), with the image augmentation transformations described, to use it for prediction on testing set.
With the model presented in Supplementary Fig. S13A we obtained accuracies of 99.0% and 96.6% on the test set for data sets 1 and 2, respectively. The prediction probability for healthy cytoskeleton images in the test set for data sets 1, 2 is shown in Supplementary Fig. S13B, C, respectively.
It is clear that in both data sets the model successfully differentiates between the two image classes, namely healthy cytoskeleton (RBC, no EV control) cell images vs. Pf-derived EV - exposed cytoskeleton (exo) cell images. We note that the images in data sets 1 and 2, correspond to two different experiments. This means that the images relate to two different populations. Hence, to generalize the model for the two data sets together, a new model should be trained on the full set of images from both batches. The accuracy on the test set in that case is 86.1% with a more-complex model architecture than in Supplementary Fig. S13A, which accounts for the complexity of the two data sets together.
In a second set of experiments, we examined the effect of bortezomib-treatment on the Pf-derived EVs. The model classifies 94.1% (188 images in total in batch 1) and 86.0% (236 images in total in batch 2) of the images as healthy. The prediction probability for healthy cytoskeleton images for data sets 1 and 2 is shown in Supplementary Fig. S13D, E, respectively, for the Pf-derived EVs that were treated with bortezomib. It is clear that the effect of the bortezomib treatment on the EVs leads to significant retention of cell structure with the majority of the images being classified as healthy26.
All code was written with Python v. 3.6.8. Besides its default packages, Scikit-learn v. 0.21.1111 and Keras v. 2.2.2112 packages were utilized for machine learning and deep learning implementations, together with Scipy v. 1.2.1113 package for data analysis and OpenCV v. 3.4.2114 package for computer vision.
Acoustic force spectroscopy cell mechanics experiments
AFS experiments with RBC are described in detail elsewhere26. Briefly, microfluidic chambers from LUMICKS B.V were used, consisting of a monolithic glass chip with a fluid channel inside and a piezoelectric element on top (as described in25). RBCs were flushed into the microfluidic chamber, settled and adhered to a poly-l-lysine functionalized surface. Next, concanavalin-A coated polystyrene beads were flushed in, settled down, and attached to RBCs. Upon voltage application, beads were pulled towards the node of the acoustic pressure field in the chamber, thus pull the cells and leading to their elongation. For imaging, an inverted bright-field microscope was used, as described in115. Digital camera images were recorded, and the x, y, and z coordinates of all the tracked microspheres were determined in real-time. The x and y positions were obtained by quadrant interpolation116 and the z position by means of a look-up table117. Force calibration was performed by quantifying and averaging the response of freely suspended beads to force, as previously described26,115. To quantify the RBCs viscoelastic response, the data was fitted to a Burger’s viscoelastic model. Fitting parameters were extracted using a custom-made Python script.
Statistical analysis
Unless otherwise stated, comparisons between two treatments were done with t-tests. If experiments were run in blocks (i.e. one replicate of each treatment per block), this was compared with paired t-tests. For comparisons between more than two groups, we used one-way ANOVA, followed by Tukey’s post-hoc test where it was relevant. If a batch effect was required, we used a two-way ANOVA. For analysis of counts, we used a mixed GLM assuming binomial distribution. Analyses were conducted in R, v. 4.0.3 and using Origin 8 and the implement algorithm in the OriginPro 2018 v. b9.5.0.193 and OriginLab Pro 2018b v. 9.55 software.
Light-driven anisotropy of 2D metal-organic framework single crystal for repeatable optical modulation
Yuliya A. Kenzhebayeva, Nikita K. Kulachenkov, Sergey S. Rzhevskiy, Pavel A. Slepukhin, Vladimir V. Shilovskikh, Anastasiia Efimova, Pavel Alekseevskiy, Gennady Y. Gor, Alina Emelianova, Sergei Shipilovskikh, Irina D. Yushina, Alexander Krylov, Dmitry I. Pavlov, Vladimir P. Fedin, Andrei S. Potapov and Valentin A. Milichko
Nature Communications Materials volume 5, Article number: 48 (2024)
Published:
Abstract
Structural transformations of metal-organic frameworks (MOFs) go through a complex energy landscape with multiple intermediate states. Although the transformations allow controlling the functional properties of the MOFs, an imbalance between MOF flexibility and rigidity sets a fundamental barrier to achieving fast and multiple transformations. Here, we study the stimuli-responsive structural transformation in a 2D MOF assembled from paddle-wheel secondary building units joined by a semi-flexible organic ligand with 1,2,4-triazole and carboxylate groups with a rigid adamantane cage between them. The structure results in a distinctive combination of MOF flexibility and rigidity, thus, facilitating a continuous transformation driven by laser light. We reveal the laser-induced anisotropic thermal expansion nature of such transformation, initiating optical changes of the 2D MOF. The latter is utilized for fast and highly repeatable optical modulation of over 10,000 cycles. The endurance of such a 2D MOF-based optical modulator during 1 year of storage at ambient conditions paves the way to design tunable and robust MOFs for diverse applications.
Introduction
Metal-organic frameworks (MOFs), as part of a large family of coordination polymers, have emerged as a unique class of porous crystalline materials for diverse applications ranging from engineering chemistry to catalysis and even nonlinear optics. In contrast to rigid and kinetically stable MOFs, demonstrating the structural resistance at harsh conditions to a certain extent, their flexible (soft, dynamic, adaptive, or four-dimensional) counterparts imply diverse structural transformations (STs) upon the guest uptake, elevated pressure and/or temperature, and applied electromagnetic fields. On the one hand, such transformations offer an efficient route to control the gas/solvent separation and sorption properties of MOFs. On the other hand, controllable STs bring the flexible MOFs into a list of smart materials for diverse applications.
In terms of solid state physics, STs of most MOFs can be classified as phase transitions, breathing, thermal expansion, and even defect formation accompanied by the ligand dynamics, conformations , to the chemical bonds rearrangement and breaking. Moreover, due to the complex composition and the framework hierarchy, the STs may be associated with a change in the space group (and/or crystal symmetry), or occur at a fixed MOF structure. As a result, STs determine the changes of chemical, electronic, magnetic, and mechanical properties of the MOFs. However, the STs of most stimuli-responsive MOFs are described generally by a limited number of cycles and a relatively low rates (from hours to milliseconds), being a consequence of the reasons including weak intermolecular forces (preventing the return of MOF structure to its initial state) and complex multi-step ST paths.
Here, we report on a two-dimensional (2D) MOF assembled from incomplete (i.e., containing three carboxylate bridges instead of four) paddle-wheel secondary building units (SBU), joined by a semi-flexible organic ligand with 1,2,4-triazole and carboxylate groups with a rigid adamantane cage between them. Such structure results in a distinctive combination of the framework flexibility and endurance due to allowed deformations of the ligand shape and SBU in a reversible manner. It, thus, facilitates a continuous ST, driven by low-intensity laser light. In situ optical, mechanical, numerical, and structural analysis reveal that such ST is a laser-induced thermal expansion process accompanied by reversible anisotropic spatiotemporal volume expansion. We also confirm that the ST initiates the change in optical properties of 2D MOF along orthogonal directions, utilized then for fast (5000 s−1) and highly repeatable (over 104 cycles of ST) optical modulation. The latter is expressed as a rotation of the polarization of the transmitted visible light. The reported endurance and structural resistance (during 1 year of storage at ambient conditions) of such 2D MOF-based optical modulator pave the way to design a series of tunable and robust MOFs for diverse chemical and optical applications.
Results and discussion
Design
To address the challenge of multiple and fast STs of MOFs with low energy consumption, we refer to the experimentally discovered Barker rule for solids. According to that rule, there is a relation between an elastic modulus E and thermal expansion coefficient α of a solid (E · α2 ~ const): the more flexible the solid (low value of E), the greater the α and, hence, physicochemical properties of the corresponding solid can be changed more efficiently with less energy consumption. However, for the rigid solid (high value of E and low value of α), faster and less efficient changes of the solid’ properties can be detected. Thus, there is a contradiction: if someone needs to achieve a higher ST rate (κ), the structure of the corresponding solid provides weaker changes in its physicochemical properties, which strongly limits the real-life application. Therefore, we assume that fast (i.e., high κ), multiple (due to high E), and simultaneously efficient ST (corresponding to high value of α) can be precisely achieved through the balance between the MOF flexibility and its volume expansion.
In this sense, we rationally designed and synthesized 2D MOF (1) based on copper(II) cations and a hybrid angle-shaped 1,2,4-triazole-carboxylate ligand with a rigid cage hydrocarbon (adamantane) linker (Fig. 1a, b). In the structure of 1, two Cu2+ cations are linked by three bridging carboxylic groups of the ligand into an incomplete paddle-wheel SBU (Fig. 1c). The apical positions of the SBU are occupied by the nitrogen atoms of 1,2,4-triazole rings of two different ligands. Instead of the fourth carboxylate group in a typical paddle-wheel SBU, the two remaining coordination places of two Cu2+ cations are occupied by an additional nitrogen atom of the ligand and an oxygen atom of the coordinated methanol molecule. Overall, the SBU is six-connected and these units are joined into 2D layers oriented parallel to the crystallographic bc plane (Fig. 1d, e).
Fig. 1: Crystal structure of 1.
Optical images of the single crystal of 1 in dark and bright fields. Scale bars, 50 μm (a) and 100 μm (b). c Secondary building unit of 1, adamantane fragments are omitted for clarity and (d) the layer of 1, viewed along the crystallographic axis b (hydrogen atoms and nitrate anions are omitted for clarity). Color code: gray—carbon, light-gray—hydrogen, blue—nitrogen, red—oxygen, orange—copper. e The structural transformation of 1 extracted from SCXRD analysis upon. f In-situ PXRD patterns (CoKα radiation) recorded upon the heating of the powder of 1 from 298 to 338 K with 5 K step.
Structural transformation
Based on the structural data, we have performed in advance the molecular modeling, which revealed the following. When the heating of the structure of 1 is initiated by 10 K, a linear increase in the total energy occurs with a slope of 2.92 kJ mol−1 K−1 , associated with 10 to 20 % change in the angles of both the coordination bond (Cu-O-C, O-C-O, and O-C-C) and the ligand. To confirm the predicted transformations of 1, we have performed in-situ powder and single crystal X-Ray diffraction analyses with a heating mode (PXRD in Fig. 1f). As one can see in Fig. 1f, the PXRD pattern demonstrates the continuous (from 298 to 338 K) and reversible ST, associated with the anisotropic volume expansion up to 1% at a fixed space group P21/c of 1. Thermogravimetric measurements also confirmed the continuous behavior of the ST of 1. The detailed SCXRD analysis over heating revealed the reversible changes in the coordination bonds and the ligand shape, being in a qualitative agreement with the molecular modeling results: the covalent bonds in the ligand, as well as the coordination bonds in Cu2+ coordination sphere did not change within the experimental error. In contrast, the torsion angles corresponding to the rotation of the carboxylate and 1,2,4-triazole groups relative to the rigid adamantane linker, as well as the bond angles in metal coordination sphere changed notably upon heating from 298 to 338 K (Fig. 1e). These changes led to distortion of the SBU, evident from elongation of Cu-Cu interatomic distance. We assumed that this distortion has been facilitated by incompleteness of the paddle-wheel SBU (three carboxylate bridges instead of four). Herein, the characteristic Cu-Cu internuclear distance within these SBUs increased monotonously and linearly in 298–338 K temperature range. The orientation of the SBUs in the unit cell led to stretching of 2D MOF layers along the crystallographic axis c and their separation along the crystallographic axis α during the ST. All these movements of the structure of 1 upon heating are reflected in the simulated video. It is important that the individual crystals of 1 demonstrated the volume expansion ranging from 0.5 to 0.9 % under the same heating conditions, which can be associated with the imperfection of the synthesized MOFs.
In addition to the structural analysis, we have performed a study of low-energy vibrations of the MOF structure (associated with changes of the structure as a whole) upon heating. Experimental results and modeling also confirmed that the heating of 1 by tens of Kelvins led to changes in the vibration energies associated with conformations of triazole and adamantane units. The latter indirectly confirms the results of molecular modeling, TGA, PXRD, and SCXRD and allows us to refer the observed ST to a thermal expansion. Therefore, using the results of SCXRD over heating Tables, we have estimated the thermal expansion coefficient, α, of 1 (221.4 · 10−6 K−1), which has been appeared in the gap between flexible and fairly rigid MOFs.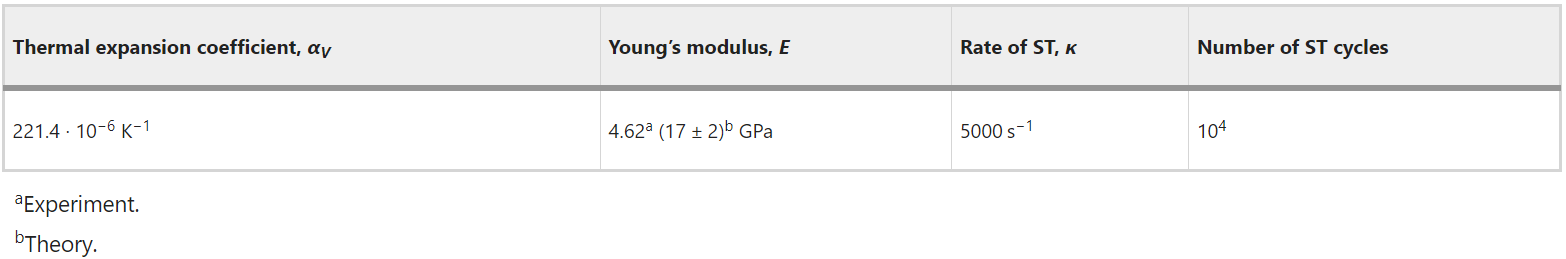
Staying in the paradigm of the balance between E and α, we have also analyzed experimentally and numerically the mechanical properties of single crystals of 1 : The determined value of Young’s modulus E (the calculated value of 17 ± 2 GPa, and the experimental one ranging from 4.6 to 72 GPa, depending on the atomic force microscopy approach) places 1 again between flexible and fairly rigid MOFs . In addition, atomic force microscopy before and during the ST has also confirmed the effect of thermal expansion of 1: continuous irradiation of the single crystal of 1 by laser light (800 nm, 12 mW integral power corresponding to 105 W cm−2 power density) led to a reversible 4 ± 1 % increase in its thickness, being larger than the structural data reported probably due to the stronger heating of 1.
Dynamics
Next, to reveal the ST rate, κ, we have assumed that the thermal expansion of 1 is independent on the source of heating. Thus, we have checked the ST upon the laser-induced heating by the wavelength providing an effective absorption of light by 1 and conversion of the photon energy to the heat. In situ SCXRD and PXRD with the laser mode confirmed that, upon the action of continuous laser irradiation (800 nm wavelength, 12 mW integral power corresponding to 2 · 103 W cm−2 power density), 1 demonstrated similar reversible anisotropic volume expansion, as has been detected upon conventional heating. The similarity is described within the error in determining the lattice parameters and the individuality of each single crystal. Based on this data, we have then utilized an optical pump-probe spectroscopy to indirectly reveal the κ value: As a pump, the laser pulses of near-infrared region (800–1100 nm) are considered as a heating source; while as a probe, the laser pulses, sensitive to the structure-related electronic (optical) changes of 1 and non-perturbing its structure, should be utilized. Therefore, to select the optimal wavelength of the probing laser pulses, we have measured the transmission optical spectra of single crystal of 1 before and during the ST. As one can see in Fig. 2a, the ST induced by the laser-induced heating (by 800 and 1050 nm) or conventional heating on Peltier stage is accompanied by similar 12 nm spectral shift within the whole visible ranges.
Fig. 2: The dynamics of the structural transformation of 1.
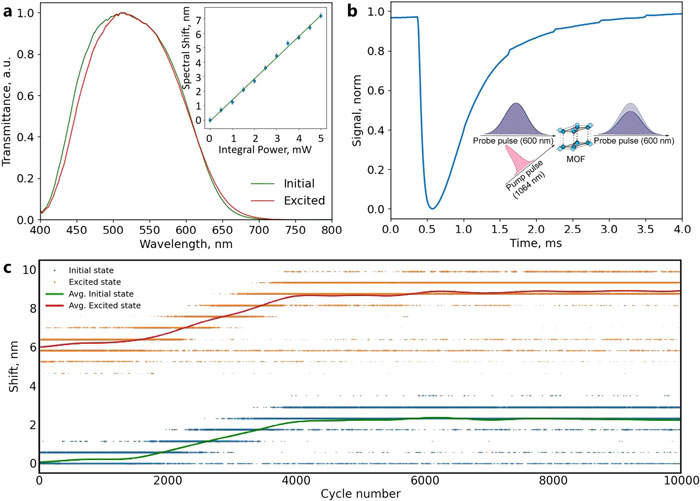
a The normalized optical transmission spectra of the single crystal of 1 before (initial state, green curve) and during the ST (excited state, red curve), stimulated by laser heating (1050 nm, 150 fs). Inset: linear dependence of the spectral shift on the pumping laser power. b The dynamics of the ST expressed as the evolution of the intensity of 600 nm probing laser light passing through the single crystal of 1 during the ST, stimulated by a single laser pulse (1064 nm, 100 ns pulse duration). Inset: the scheme of the laser pump-probe spectroscopy. c Long-term stability of single crystal of 1 at ambient conditions (air atmosphere, room temperature and humidity) during 104 cycles of the ST, stimulated by laser-induced heating (1050 nm as a pump with a fluence of 3.6 mJ cm−2; and 600 nm as a probe). Green curve—initial state; red curve—excited state (during the ST).
Thus, utilizing a low-intensity of 600 nm laser pulses (6 ns) as a probe, and a single 1060 nm laser pulse (100 ns) as a pump, we have discovered the following. The ST (i.e., thermal expansion led to the transmission spectral shift from the initial to the excited state) occurs over τ ~ 0.2 ms (the rate κ ~ 1/τ ~ 5000 s−1) with 3.3 ms relaxation (Fig. 2b), being equal or even greater than that of specific photosensitive MOFs. In details, the laser-induced heating led to the volume expansion and initiated a decrease in the intensity of the transmitted probe pulse due to the drop of the MOF transmittance at 600 nm (Fig. 2a ); while the relaxation of the structure of 1 to the initial state (corresponding to the structure at 298 K returned the probe intensity to its initial value. Intriguing is that the variation of the wavelength of the probing light from 500 to 750 nm revealed the opposite behavior of its intensity: The decline followed by the growth of the intensity of 500–650 nm light over time is due to the fact that these wavelengths can be efficiently absorbed by 1 during the ST; while the growth followed by the decline of the intensity of 700–750 nm light can be explained by an increase of transparency of 1 within this spectral range during the ST. In addition, these results revealed that an increase in excitation time from 0.15 to 0.2 ms and the relaxation time from 1 to 4.5 ms correlated with the decrease of the probe wavelengths from 750 to 500 nm. This allowed us to determine an average 3.8 ms time required to complete the ST process, and to speculate about app. 260 full cycles of the reversible STs of 1 per second.
It is worth noting that a comparison of the data obtained (in situ SCXRD in heating mode and the laser-induced heating) indicated that the heating of 1 from 298 to 338 K provided 1% volume change. The same temperature range led to 5 nm spectral shift for 1, heated on Peltier stage, allowing us to determine an efficiency of the optical changes upon heating (0.125 nm K−1). The latter has been used then for evaluating the heating of MOF directly by the laser (Fig. 2a, inset): the same 5 nm spectral shift, achieved with 3.5 mW of the laser power, can be attributed also to 338 K of 1 achieved by the laser-induced heating.
Endurance
For such 2D MOF demonstrating E vs α balance and relatively high thermal expansion rates, we have checked its endurance at ambient conditions (air atmosphere, room temperature and humidity) during the ST cycles stimulated by the laser-induced heating (1050 nm, 7.2 mJ cm−2 laser fluence). Figure 2c shows that the single crystal of 1 demonstrates unprecedented endurance during 104 cycles of the ST expressed as 6 nm shift of the optical transmission of 1 (corresponding to heating to 348 K). A slight 2 nm shift, observed between 1500 and 4000 cycles, is probably related with the removing of residual solvent molecules (coordinated methanol). Surprisingly, such relatively fast and multiple (104 cycles) ST has been also confirmed for single crystals of 1 in 1 year of storing at ambient conditions. Coupled with SCXRD data on reversible ST , these results unambiguously addressed the question of the possibility of simultaneous coexistence of the structural flexibility and integrity of the MOF (Table 1). Notably, the observed continuous ST (i.e., thermal expansion) of 1 with movable elements (SBU and ligand), on the one hand, initiated the detectable optical changes with the rate of app. 5000 s−1; on the other, was accompanied with the MOF structural integrity confirmed by 104 ST cycles. The latter value exceeds all previously declared cycles of the transformation of the flexible MOF, bringing, thus, the reported compound closer to the rigid one, subjected to alternating electric field over thousands of cycles for semi-commercial capacitive and memory elements. However, the observed ST rates are still far from an ideal value for alternative smart materials exhibiting up to picosecond phase transformations, conformations, thermal deformations, or defect formation for utilization as logic gates and switchers. Nevertheless, we speculate that decreasing the dimension of MOFs (from bulk to nanosheets) may contribute to an increased rates of ST and thermal deformations (heat propagation).
Optical modulation
Generally, the ST (regardless of its nature) directly affects the electronic (optical) properties and functionality of the solids; hence, we have utilized the laser-induced thermal expansion of 1 to initiate its optical anisotropy for optical modulation. The ST scheme in Fig. 3a, expressed in the form of anisotropic change in the lattice parameters during the ST, predicts both an initial and the light-driven (during the ST) anisotropy of the optical properties of 1. As we expected (Fig. 3b), the laser-induced heating with corresponding thermal expansion stimulated an anisotropic change in the refractive indices of single crystal of 1 at a fixed plane: A drop in the refractive index, n, by 1.3 % (Δn = 0.02) in (100) plane and by 0.7 % (Δn = 0.01) in (110) plane has been detected . The observed changes of n are also in good agreement with the calculated data (Δn = 0.005) obtained for the structure of 1 heated from 298 to 338 K. Moreover, an analysis of the optical transmission of polarized light through the single crystal of 1 (of an arbitrary orientation) has revealed that rotating of the polarization of incoming light by 90° provides app. 3-fold increase in transmission. Herein, during the ST, this value equals to 9 , which again proves that the ST induces an additional optical anisotropy of 1.
Fig. 3: Optical anisotropy of 1 driven by the structural transformation.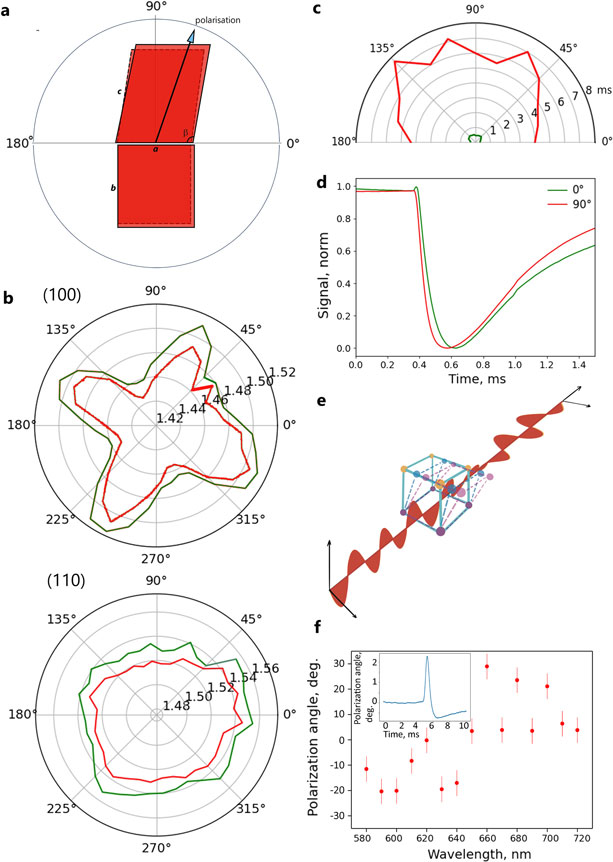
a A scheme of the ST of 1 in polar coordinates revealed by SCXRD (Supplementary Tables S1–S3). b Spatial dispersion of refractive index n for (100) and (110) planes of 1 before and during the ST, initiated by laser-induced heating (1050 nm, 4.5 mW of pumping laser power; green curve corresponds to the initial state, while the red one is for the excited state). c, d The dynamics of the ST expressed as the evolution of the intensity of 450 nm probing laser light with a varied polarization (0°–180°) passing through the single crystal of 1 during the ST, stimulated by a single 1064 nm (100 ns) laser pulse (red curve corresponds to the relaxation time in (c), while the green one is for the excitation time; green and red curves in (d) correspond to 0° and 90° polarization of the probing laser light). e, f Scheme and the experimentally measured rotation of the polarization of the probing laser light of a varied wavelength (580–720 nm, fluence of 0.28 mJ cm−2) over time (inset) passing through the single crystal of 1 (of 100 µm thick and an arbitrary orientation) during the ST, stimulated by the laser irradiation (1050 nm, fluence of 3 mJ cm−2)
The observed effect of the ST on n values and the optical transmission of 1 in orthogonal directions brings us to an idea to rotate the polarization of visible light, passing through the single crystal of 1 with a thickness of 100 μm. This can be realized due to an unequal change in the optical transmission and n for the orthogonal components (like s and p as illustrated in Supplementary Figs. S23c, S24c) of the polarized light at 45°. As can be seen in Fig. 3f , we have experimentally observed via two independent methods, that the polarization of light with a wavelength of 580 to 720 nm rotates additionally by 4°–30° (corresponding to app. 105 degree m−1) from the initial position (i.e., 45°). Herein, an arbitrary (and uncontrolled) orientation of the single crystals of 1 with different thickness contributed to the values of determined rotation angles, as shown in Supplementary Fig. S22. Moreover, the direction of rotation of the polarization depends on the wavelength of light (Fig. 3f) : The orthogonal components of polarized light with a wavelength of 580-650 undergo unequally increased absorption during the ST; while 650–720 nm light propagates in an opaque crystal, whose degree of transparency increases due to the ST. Taking into account the fact of the thickness of optically transparent crystals of 1 (10–100 µm), which minimized the contribution of the surface effect on the rotation of the polarization of visible light73,74,75, the detected rotation by 1 (during the ST) in many respects exceeds such values for well-known optically active and anisotropic materials. Finally, through the additional analysis of the ST by optical pump-probe spectroscopy with polarization resolution for the probing laser light (Supplementary Fig. S15), we have discovered a spatiotemporal dependence for the rates of the change of the MOF’ optical properties (Fig. 3c, d): Again, comparing two orthogonal directions (0° and 90°) for the single crystals of 1 of an arbitrary orientation, we have revealed statistically the decrease in the excitation ST rate by 20 % (from κ = 5000–4000 s−1, corresponding to excitation time of 0.2 and 0.25 ms, respectively), and the decrease in the relaxation ST rate by 40% (corresponding to excitation time of 4–7 ms). This spatiotemporal process is also reflected in Fig. 3f : the orthogonal components of polarized light (of 450 and 600 nm wavelengths), passing through 1, demonstrate app. 0.1 ms time delay in their excitation and relaxation time relative to each other. According to our knowledge, this is the first observation of the anisotropic spatiotemporal behavior of the structure of coordination polymers (as previously observed for liquid crystals), and can be explained by heat propagation thought the MOFs, complicated with their organic-inorganic nature, weak chemical bonding, and the structural anisotropy.
Conclusion
We report on a 2D MOF assembled from incomplete paddle-wheel secondary building units joined by a semi-flexible organic ligand with 1,2,4-triazole and carboxylate groups with a rigid adamantane cage between them. The structure results in a distinctive combination of the framework flexibility and endurance due to allowed deformations of the ligand shape and SBU in a reversible manner. It, thus, facilitates a continuous structural transformation, driven by low-intensity laser light. In situ optical, mechanical, numerical, and structural analysis reveal that such transformation is a laser-induced thermal expansion process, accompanied by reversible 1% anisotropic spatiotemporal volume expansion. We also confirm that the structural transformation initiates the change in optical properties of 2D MOF along orthogonal directions, utilized then for fast (5000 s−1) and highly repeatable (over 104 cycles of ST) optical modulation. The latter is expressed as rotation of the polarization of the transmitted visible light. The reported endurance and structural resistance (during 1 year of storage at ambient conditions) of such 2D MOF-based optical modulator pave the way to design a series of tunable and robust MOFs for diverse chemical and optical applications where transformation of the structure is required while maintaining its integrity.
Methods
Synthesis
The synthesis of MOF 1 was described in detail in ref. 37. Briefly, 2 ml of 0.1 M 3-(3-methyl-1,2,4-triazol-1-yl)-adamantane-1-carboxylic acid solution (0.2 mmol) in methanol was mixed with 1 ml 0.1 M solution (0.1 mmol) of copper(II) nitrate trihydrate in a 4 ml screwcap glass vial. The vial was placed in oven at 80 °C for 24 h. Upon cooling to room temperature, bright green crystals suitable for SCXRD analysis have been obtained, followed by their washing with 4 ml of methanol and storing under pure solvent.
Thermal gravimetric analysis (TGA) and differential scanning calorimetry (DSC)
TGA and DSC were performed on a NETZSCH TG 209 F1 Iris Thermo Microbalance from 30 to 850 °C (TGA) and 40 to 100 °C (DSC) under helium atmosphere with heating rate of 10 °C per min.
Single crystal XRD with heating mode
Variable-temperature single crystal XRD data were collected on a Bruker D8 Venture diffractometer with a CMOS PHOTON III detector and IµS 3.0 source (mirror optics, λ(MoKα) = 0.71073 Å). The φ- and ω-scan techniques were employed to measure the intensities. The crystal structure was solved using the SHELXT and was refined using SHELXL programs with OLEX2 GUI. The corresponding references can be found in Supplementary Note 1. Atomic displacement parameters for non-hydrogen atoms were refined anisotropically, hydrogen atoms were placed geometrically and refined in the riding model.
In-situ powder XRD analysis with heating mode
Temperature-dependent powder X-ray diffraction was performed using a Rigaku Ultima IV diffractometer (CoKα radiation) equipped with a high-temperature camera. The MOF powder was ground on a platinum holder. The study was carried out in air in the temperature range of 298–338 K with a 5 K step and a heating rate of 1 K min−1 between the temperature points. The reflexes were recorded in the 2Θ range of 5–45°.
Single crystal XRD with laser mode
The XRD analyses were carried out using equipment of the Center for Joint Use “Spectroscopy and Analysis of Organic Compounds” at the Postovsky Institute of Organic Synthesis of the Russian Academy of Sciences (Ural Branch). The experiments were accomplished on the automated X-ray diffractometer «Xcalibur 3» with CCD detector on the standard procedure (МоKα-irradiation, graphite monochromator, ω-scans with 0.3° step for experiments at room temperature). The solution and refinement of the structures were accomplished by using Olex program package. Empirical absorption correction was applied. The structures were solved by the method of the intrinsic phases in SHELXT program and refined by SHELXL by the full-matrix least-squares method for non-hydrogen atoms. The H-atoms were placed in the calculated positions and were refined in the isotropic approximation. The laser irradiation of the single crystal of 1 during XRD experiments was accomplished by a laser source with 800 nm wavelength mounted in the safety chamber of the diffractometer. The single crystal was irradiated during the entire diffraction measurement procedure (up to 10 h) with 5 and 12 mW integral power focused by a lens (into 1 × 1 mm spot). The starting orientation of 1 in the axis of the goniometer from experiment to experiment did not change. The results of the XRD analyses in initial, excited (upon 5 and 12 mW irradiation), and reverse states are presented in Supplementary Table S7.
Molecular dynamics simulations
The thermal effect on 1 was estimated using molecular dynamics simulations at a constant number of particles, pressure, and temperature (NPT). The initial positions of the atoms were taken based on the crystallographic data. Universal Force Field (UFF), specifically its extension to MOFs, was used to describe the flexibility of the structure. The UFF force field was chosen due to its application to a variety of chemical elements and as well-established and widely used for simulations of different MOFs structures. Most importantly, this force field was shown previously to give a good description of the elastic properties of MOFs in a number of studies. Partial charges were not assigned to the atoms since their incorporation into a framework with the UFF force field produces worse agreement with experimental mechanical properties of MOFs. The simulations were performed in LAMMPS software. The structure was heated in a range of temperatures from 293 to 443 K. Lennard-Jones interactions were truncated at 12.5 Å. The Velocity-Verlet algorithm was used for time integration with a time step of 0.5 fs (which is typical for simulations of MOFs thermal behavior). Nosé-Hoover thermostat with 100 fs damping time and Nosé-Hoover barostat with 1000 fs damping time was used. Each temperature point included an equilibration time of 0.5 ns followed by a production time of 0.5 ns, where the average total energy of interactions was estimated.
Calculations of Raman spectrum and elastic constants
Periodic density functional theory (DFT) calculations have been performed in Kohn-Sham approach in CRYSTAL17 software (v.1.0.2). The initial structural data of the crystal of 1 with structural parameters for 298 and 338 K have been optimized in several ways: (i) with B3LYP functional (has been chosen due to less prominent change of cell parameters during the optimization process with respect to other functionals and optimization strategies) and fixed volume for the calculations of elastic constant tensor; (ii) with PBEh-3c/PBE0 functional with fixed cell parameters for the calculation of Raman active modes and their intensities. Such combination with the implementation of three-fold corrected (3c) Hartree-Fock method together with classical PBE0 approach has been chosen in order to accelerate the calculation speed due to large number of atoms in the unit cell (492 atoms), which is especially important in the calculation of frequencies. Basis set was unified for all of the calculations: the 6–31 G(d) basis set for the H, C, N, O atoms and basis set for the Cu atoms (see details in Supplementary Note 1). Calculation of Raman active modes has been done in couple-perturbed Kohn-Sham approach for both 298 and 338 K cases. Calculation of elastic constants tensor has been applied for the optimized structure of 1 at 298 K with relaxed cell parameters and fixed cell volume. The spatial dependences of elastic moduli were calculated from stiffness tensors by means of the ELATE online tool. This tool also allowed us to calculate the tensor eigenvalues, the minimum and maximum values of Young’s modulus and linear compressibility, as well as the directions of their extremal values.
Transmission optical spectroscopy with heating and laser modes
A homemade setup based on confocal microscopy spectrometer HORIBA Labram with water cooling Andor VIS/NIR cameras and diffraction gratings kit (150 and 1800 g mm−1) has been used for MOF characterization. The setup was reconfigurable and allowed us to provide a series of optical experiments with spectral, spatial, and time resolution involving mechanical shutter for laser selection, infinity-corrected objectives, and sample heating tool. As pump sources, two lasers were used: 800 nm diode continuous wave laser with external resonator (model ECDL-7930R) and 1050 nm Yb3+ doped femtosecond laser TEMA (150 fs pulse duration, 80 MHz repetition rate). A Mitutoyo NIR 10 × 0.28NA objective was installed in the excitation channel, and a Mitutoyo VIS 50 × 0.56NA objective was used in the collection channel. The effect of the optical spectral shift was confirmed for both sources and correlated with the absorption band of the crystal spectra transmission (Supplementary Fig. S14). The optical transmission experiment with heating has been provided using a resistive heater with stabilization close-loop that allowed stabilizing the temperature in the range from 25 to 100 °С with accuracy ±1 °С. The analysis of the spectral shift from obtained data was discussed in detail in Supplementary Note 1.
Transmission optical spectroscopy with polarization resolution
The polarization transmission optical spectroscopy has been implemented for the estimation of the change in rotation angle for a polarized white light. For this, the single crystals of 1 were settled on a glass substrate. A Mitutoyo NIR 10x0.26NA objective was installed in the excitation channel (to initiate the ST), and a Mitutoyo VIS 50x0.55NA objective was used in the collection channel. A polarization vector from the white light (Avantes 300–2500 lamp) has 45° polarization after passing throw the Glan prism and half wave plate. After the passing through the excited crystal, the signal passed through the Glan prism in two orthogonal positions in order to detect two orthogonal components (s and p polarized signals) of a white polarization light and then was analyzed by spectrometer HORIBA Labram with water cooling Andor VIS/NIR cameras and diffraction gratings kit (150 and 1800 g mm−1). As pump source for initiating the ST, 1050 nm Yb3+ doped femtosecond laser TEMA (150 fs pulse duration, 80 MHz repetition rate) was used.
Pump-probe spectroscopy with a time resolution
The pump-probe optical spectroscopy approach with time resolution has been implemented for estimation the timing parameters of the optical transmission spectra. A supercontinuum source (Fianium picosecond laser, 60 MHz pulse repetition rate, 6 ps pulse duration, passed through the tunable spectral filter SuperChrome to select 500–750 nm) was used to generate a probe laser light. A commercially available Yb3+ doped fiber laser (IPG Photonics) operating at wavelength of 1064 nm, with 100 ns pulse duration, and repetition rate of 1.6 kHz was as a pump laser; to decrease the pulse repetition rate, a chopper-based modulator Thorlabs MC2000B with an MC1F60 blade that transmits radiation in one of 60 slots was implemented and synchronized by frequency and phase with a nanosecond laser based on a photodetector signal. The probe signal was detected using high-speed photodetector Standa 11HSP-FS1 and analyzed then using an oscilloscope.
Pump-probe spectroscopy with polarization resolution
The polarization-resolved pump-probe optical spectroscopy has been implemented for the estimation the timing parameters of the optical transmission spectra for a polarized probe laser light (Supplementary Fig. S15). For this, the single crystals of 1 were settled on a glass substrate. A Mitutoyo NIR 10x0.26NA objective was installed in the excitation channel (to initiate the ST), and a Mitutoyo VIS 100x0.9NA objective was used in the collection channel. A signal from supercontinuum source (Fianium picosecond laser, 60 MHz pulse repetition rate, 6 ps pulse duration, 200 μW integral power) passed through a tunable visible spectral filter (SuperChrome the spectral range 400–800 nm, FWHM 10 nm, 6 ns pulse duration), was used as a probe source. As a pump source, a commercially available Yb3+ doped femtosecond laser (wavelength of 1050 nm, with 150 fs pulse duration, 80 MHz repetition rate, and a fluence of 3 mJ cm−2) was used; to select the chain of femtosecond pulses, a chopper-based modulator Thorlabs MC2000B with an MC1F60 blade that transmits radiation in one of 60 slots was implemented, the radiation to which was diverted using a beam-splitting cube. The polarization vector of probe beam has 45° polarization after passing throw the Glan prism and half wave plate. The pump beam was analyzed than using the signal from the photodetector settled in the excitation channel and was cut off using a short-pass visible spectral filter; while the probe light was detected in a balanced scheme including a polarization beam splitter cube and two high-speed photodetectors (rising time less than 1 ns), and an oscilloscope, which provides detection of two orthogonal components (s and p polarized signals in Supplementary Fig. S22a) of probe polarization light. The estimation of the angle of the rotation of polarization vector over time is presented in details in Supplementary Note 1.
Endurance
The stability of switching between initial and excited states has been provided in the scheme described in Supplementary Fig. S14, with additional irradiation of 1050 nm femtosecond laser. The white light transmitted through the single crystals of 1 of an arbitrary orientation was detected by a commercial spectrometer Avantes in the visible spectral range. The mechanical shutter was opened and closed laser irradiation that allowed detecting an initial and exciting state in each iteration. The shift was calculated as a difference of wavelength positions with an accuracy of 0.005 nm for fixed intensity on each iteration. Two crystals of 1 were considered as a model object including a 1-year stay in the air crystal (the old one in Supplementary Fig. S25) and another crystal dried from matrix solvent (the new one in Fig. 2c and Supplementary Fig. S26). The fluence of the 1050 nm laser source was 2.4 mJ cm−2 for the old crystal, and 3.6 mJ cm−2 for the new one.
Refractive index analysis
To analyze the refractive indices, n, of the single crystals of 1 (of an arbitrary orientation, Supplementary Figs. S19, S20, and determined orientation, Supplementary Figs. S23, S24), we have measured the reflectance spectra depending on the angle of polarization of incoming light (Supplementary Fig. S19). For this, the single crystals of 1 were settled on a glass substrate. A Mitutoyo NIR 10x0.26NA objective was installed in the excitation channel (to initiate the ST by 1050 nm laser light with 4.5 mW power), and a Mitutoyo VIS 100x0.9NA objective was used in the collection channel. A signal from white light source (Avantes 300–2100 nm spectral range lamp) reflected from the MOF surface via collection channel, the Glan prism, and a half-wave plate with a step of 10°, have been analyzed with a spectrometer (AvaSpec-ULS2048CL-EVO). The mathematical analysis of the refractive index and its changes (during the ST, initiated by laser-induced heating) is presented in Supplementary Note 1.
Raman spectroscopy
Raman spectra (Supplementary Fig. S27) have been measured using a triple spectrometer T64000 (Horiba, Jobin Yvon) in subtraction dispersion mode. As a light source, an DPSS laser Spectra-Physics Excelsior-532-300-CDRH at a wavelength of 532 nm has been used. Signal accumulation time was set at 960 s, with 2 cm−1 spectral resolution, 0.3 cm−1CCD matrix pixel coverage, and 1 mW laser excitation power. The laser beam was focused by a lens with a large working distance 10.5 mm of 50× (NA 0.5). The scattered light was collected by the same lens in the backscattering geometry. Thermal measurement of individual MOF crystals was investigated using a temperature-controlled stage THMS600 (Linkam Sci. Inst.). The MOF has been heated in the range from 22 °C to 180 °C with a constant heating rate of 5 °C per minute. After reaching a certain point value, the temperature remained constant, and the Raman spectra have been measured after 10 min (required for uniform heating). Additionally, the unfocused beam with 300 µm diameter from the red laser pointer with a wavelength of 650 nm illuminated the MOF. The angle between the green Raman laser and the red one was set at 60°.
Mechanical characterization
Mechenical characteristics have been estimated using atomic force microscopy (SmartSPM 1000 AIST-NT microscope) in contact mode at ambient conditions. Working cantilevers were PPP-NCSTAuD-10 (Nanosensors) with 160 kHz resonance frequency, 14 N m−1 force constant, and 10 nm tip radius of curvature; CP-qp-SCONT-SiO-A (sQube) cantilevers with round tip made of silicon dioxide with diameter of 2 μm, and 0.01 N m−1 force constant.
Data availability
The X-ray crystallographic coordinates for structures reported in this Article have been deposited at the Cambridge Crystallographic Data Centre (CCDC), under deposition numbers CCDC 2278066 (at 298 K) and 2278067 (at 338 K) and 2312382-2312386 (for gradual heating). These data can be obtained free of charge from The Cambridge Crystallographic Data Centre via www.ccdc.cam.ac.uk/data_request/cif.
Photoresponsive Hydrogels with Photoswitchable Mechanical Properties Allow Time-Resolved Analysis of Cellular Responses to Matrix Stiffening
I-Ning Lee, Oana Dobre, David Richards, Christoph Ballestrem, Judith M. Curran, John A. Hunt, Stephen M. Richardson, Joe Swift and Lu Shin Wong
ACS Applied Materials & Interfaces Cite this: ACS Appl. Mater. Interfaces 2018, 10, 9, 7765–7776 https://doi.org/10.1021/acsami.7b18302 Published February 12, 2018
Abstract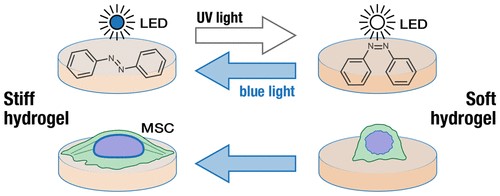
As cell function and phenotype can be directed by the mechanical characteristics of the surrounding matrix, hydrogels have become important platforms for cell culture systems, with properties that can be tuned by external stimuli, such as divalent cations, enzymatic treatment, and pH. However, many of these stimuli can directly affect cell behavior, making it difficult to distinguish purely mechanical signaling events. This study reports on the development of a hydrogel that incorporates photoswitchable cross-linkers, which can reversibly alter their stiffness upon irradiation with the appropriate wavelength of light. Furthermore, this study reports the response of bone-marrow-derived mesenchymal stem cells (MSCs) on these hydrogels that were stiffened systematically by irradiation with blue light. The substrates were shown to be noncytotoxic, and crucially MSCs were not affected by blue-light exposure. Time-resolved analysis of cell morphology showed characteristic cell spreading and increased aspect ratios in response to greater substrate stiffness. This hydrogel provides a platform to study mechanosignaling in cells responding to dynamic changes in stiffness, offering a new way to study mechanotransduction signaling pathways and biological processes, with implicit changes to tissue mechanics, such as development, ageing, and fibrosis. Copyright © 2018 American Chemical Society
1. Introduction
Since its inception, in vitro cell biology has been performed primarily on rigid substrates, such as glass and polycarbonate, which have Young’s moduli (E) in the GPa range. This level of rigidity contrasts with most human tissues that are typically more deformable, from “soft” tissues such as marrow (E ∼ 0.2 kPa) and brain (E ∼ 0.4 kPa), to “stiff” tissues such as cartilage (E ∼ 24 kPa) and precalcified bone (E ∼ 35 kPa). By using synthetic materials fabricated within these ranges of biological stiffnesses, it is possible to investigate and manipulate cell behavior in systems that more closely simulate the biomechanics of the tissue microenvironment.
Polyacrylamide (PA)-based hydrogels have been widely used as a model soft material in studies of cell–substrate interaction as they are noncytotoxic, can be chemically functionalized (e.g., with small molecules and proteins), and have physical properties (e.g., stiffness and porosity) that can be systematically varied by altering their formulation. These stiffness-defined substrates have proven to be a valuable tool in efforts to understand cellular mechanotransduction, the conversion of physical inputs into biochemical responses. Indeed, it is now well established that substrate mechanics determine a broad range of cellular behaviors, including cell motility, proliferation, and apoptosis. Furthermore, mesenchymal stem cells (MSCs), extensively studied because of their potential for application in tissue engineering and regenerative medicine, can be mechanically induced to differentiate to lineages commensurate with substrate stiffness. These MSCs are characterized by an ability to adhere to a substrate during in vitro culture and the ability to produce adipogenic, chondrogenic, and osteogenic lineages. Biochemically, a diverse range of mechanosensing pathways have been identified, including rapidly responding ion channels; the dynamic interplay between the cytoskeleton, nucleoskeleton, and chromatids; the translocation of transcription factors such as yes-associated protein 1 (YAP1), myocardin-related transcription factor A (MRTF-A), and homeobox protein Nkx-2.5; and mechanically modulated microRNAs.
However, a limitation of current PA-based materials is that their mechanical properties are essentially fixed at the point of preparation. In contrast, developing tissues alter their matrix composition and stiffness in response to mechanical loading. In addition, fibrosis as a result of a broad range of pathologies is associated with the stiffening of the tissues affected and the ageing process is also known to affect the mechanical properties of many tissues. Thus, studies into the dynamic nature of cell behavior would greatly benefit from systems that enable a tuneable mechanoenvironment in situ.
To address this aspect, a number of hydrogel systems have been reported that can alter their mechanical stiffness in response to a variety of stimuli while in cell culture. Examples include collagen–alginate formulations that respond to Ca2+ ions and pH-sensitive acrylate-based triblock copolymers. However, their use necessitates that the cells are also exposed to these chemical stimuli and it remains unclear if cell behavior would be unaffected. As an alternative, PA hydrogels that incorporate photocleavable 2-nitrobenzyl-derived cross-linkers have been reported. Irradiation with near-UV light (typically ∼365 nm) results in the cleavage of these linkers and a softening of the gel, with subsequent changes in cell behavior. This wavelength of UV irradiation has also been used to activate the cross-linking of methacrylated hyaluronic acid gels, resulting in substrate stiffening. These approaches require only the use of light to trigger the desired mechanical effect, so they offer the advantage of being “reagent free”. Materials combining different approaches have also been reported. For example, hyaluronic acids bearing both photocleavable cross-linkers and acrylates are able to repolymerize in the presence of a photoactivatable polymerization initiator. These materials are able to soften on cross-linker cleavage and stiffen on acrylate polymerization.
Azobenzene is a photoresponsive molecule that undergoes a trans to cis isomerization upon exposure to UV light (typically between 300 and 400 nm), resulting in a change of distance between two phenyl rings of ∼3.5 Å (Figure 1A). Upon irradiation, this photoisomerization is rapid and results in a photostationary state (PSS), with ∼80% of the population in the cis state. Conversely irradiation of the cis isomers with visible light (typically 400–500 nm) results in a rapid conversion back to the predominantly trans form (∼95% at PSS). Gradual isomerization from cis to trans forms can also occur thermally.
Figure 1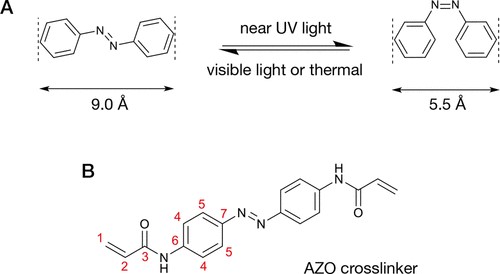
Figure 1. Chemical structure and isomerization of azobenzene. (A) Isomerization of azobenzene between trans and cis isomers. (B) Structure of the 4,4′-di(acrylamido)azobenzene (AZO) cross-linker used in this study. Numbering in red indicates the positions referred to in the NMR spectra for this compound.
There have been several reports of hydrogels that incorporate an azobenzene group to impart photoswitchable swelling and stiffness changes for applications in small-molecule (drug) delivery, cell encapsulation, and optical devices. There is currently only one example of the use of azobenzene-containing hydrogels in relation to cell culture, in which it is incorporated into a poly(ethylene glycol)–peptide polymer matrix. However, this material has a relatively small dynamic range upon switching (
Building on these examples, this report demonstrates the use of a PA-based hydrogel that incorporates an azobenzene cross-linker for the photoswitchable manipulation of primary human MSCs, demonstrating the potential of this material as a minimally invasive method to study mechanotransduction in this medically important cell type. Here, it is shown that near-UV irradiation results in the softening of the gel, whereas visible blue light results in stiffening, which alters cell morphology.
2. Materials and Methods
2.1. Materials and Equipment
All chemicals were sourced from standard suppliers unless otherwise stated and used without further purification. Antibodies were purchased from Abcam (Cambridge, U.K.) or Thermo Fisher Scientific (Waltham, MA) and AlexaFluor488-phalloidin from Cell Signaling Technology (Danvers, MA). For cell culture experiments, the hydrogels were cast in glass-bottomed dishes (uncoated, γ-irradiated, MatTek Corp, MA).
Irradiation experiments were performed with light emitting diodes (LEDs) emitting at a λmax of 365 nm (part no. M365L2) and 490 nm (M490L4), powered by a DC4100 LED driver; all supplied by ThorLabs (Newton, NJ). Photon flux was measured by ferrioxalate actinometry, with a 3 mL cuvette held 1.3 cm away from the LED, which gave 32.5 and 11.9 mW cm–2 for the 365 and 490 nm LEDs, respectively. Epifluorescence microscopy was performed with an Axioplan 2 microscope (Zeiss, Jena, Germany), with the appropriately stained cells (on coverslips) mounted using Fluorescence Mounting Medium (Agilent, Santa Clara, CA). The gold/palladium coater used to prepare samples prior to scanning electron microscopy (SEM) was a Quorum SC7620 Mini Sputter Coater. SEM images were taken on an XL-30 FEG ESEM, while environmental SEM (ESEM) images were captured using a Quanta 650 FEG ESEM, both from FEI (Hillsboro, OR).
2.2. Synthesis of 4,4′-Di(acrylamido)azobenzene (“AZO”)
4,4′-Azoaniline (265 mg, 1.25 mmol) was dissolved in dimethylformamide (DMF, 20 mL) and triethylamine (540 μL, 3.875 mmol) was added, followed by acryloyl chloride (305 μL, 3.75 mmol) in a dropwise manner. The reaction was stirred at room temperature overnight, after which the reaction was observed to be complete by thin-layer chromatography. The solution was poured into 600 mL of water and the mixture adjusted to pH 4 by dropwise addition of concentrated aq HCl. The precipitated orange solids were collected by filtration, washed once each with saturated NaHCO3 and water, then lyophilized to yield the desired product as an orange powder (83.2%, 387.6 mg). Rf 0.38 (EtOAc); λmax/nm (tetrahydrofuran) 377 (ε/dm3 mol–1 cm–1 33 200); νmax/cm–1 (solid) 3310, 3067, 1670, 1248, 843; δH (400 MHz; DMSO-d6) 5.81 (2H, C(1)H, d, J = 10.1 Hz), 6.31 (2H, C(1)H, d, J = 16.9 Hz) 6.49 (2H, C(2)H, dd, J = 10.1, 16.9 Hz), 7.88 (8H, C(4,5)H, m), and 10.6 (2H, NH, s); δC (101 MHz, DMSO-d6); δ 119.41 (C(4)H), 123.56 (C(5)H), 127.74 (C(1)H2), 131.59 (C(2)H), 141.96 (C(6)), 147.82 (C(7)), and 163.48 (C(3)); m/z (ES+) 343 (100%, [M + Na]+); HRMS calculated for C18H16N4O2: 321.1535, found: 321.1352 ([M + H]+), δ 2.3 ppm.
2.3. Fabrication of Hydrogels
The prepolymer mixtures for initial screening were formulated according to the compositions specified in the Supporting Information (SI) (Tables S1–S6). In general, AZO was dissolved in dimethyl sulfoxide (DMSO), DMF, or EtOH. Separately, aqueous solutions of acrylamide (AM, 40% w/v) and N,N′-methylenebisacrylamide (BIS, 0.1 M) were mixed with phosphate-buffered saline (PBS). The AZO and AM/BIS solutions were then mixed with ammonium persulfate (10% w/v in water, 10 μL) and N,N,N′,N′-tetramethylethylenediamine (1 μL). These mixtures were allowed to polymerize in vials for 30 min prior to analysis.
The polymer formulations that were subsequently taken for cell culture and mechanical and photochemical characterization (formulations 56, 62, 64, and 83; see Section 3.1 below) were cast on glass-bottomed dishes and coated with fibronectin (FN) (see Figure S1 in SI for an illustration of the general workflow). The glass surfaces of the dishes were surface treated with aq NaOH (700 μL, 1 M) for 5 min, followed by washing three times with deionized water and drying with a stream of N2 gas. 3-Aminopropyltriethoxysilane (700 μL) was then pipetted onto the glass, left to stand for 5 min, and washed three times with water and dried as above. Glutaraldehyde (0.5% v/v in water, 700 μL) was added and incubated for 30 min and the glass was then washed and dried as above. (5) Separately, glass coverslips were prepared by drop coating with a rat fibronectin (FN) solution (120 μL, 0.05 mg mL–1 in PBS), which was allowed to stand for 1 h before drying with a stream of N2 gas. 30 μL of the desired prepolymer mixture was then dropped onto the silanized glass surface of a glass-bottomed dish. The FN-coated coverslip was placed on top of the droplet, taking care to ensure even spreading of the prepolymer droplet and avoidance of any trapped bubbles. The polymerization was allowed to proceed for 30 min, after which the coverslip was carefully removed and the FN-coated hydrogels stored in the dark under PBS at 25 °C until used.
For cell culture, the hydrogels were prepared according to formulation 83 (see the SI for composition). For calibration purposes, FN-coated PA gels with defined stiffnesses of 2, 4, 8, and 23 kPa were prepared according to previously published formulations.
2.4. UV–Vis Absorption Spectroscopy and Photoirradiation
UV–vis spectra of the AZO cross-linker in solution were measured at a concentration of 21 μM in tetrahydrofuran in a 1 cm path length glass cuvette. For the irradiation of solutions, the same solution was placed in a cuvette holder (ThorLabs CVH100) directly coupled to the desired LED. During irradiation, the samples were removed intermittently and the UV–vis spectrum recorded, before returning the sample for further irradiation.
The proportions of the isomers at the PSS were calculated using a method similar to that previously reported. (43,44) Under 365 nm irradiation (trans to cis), the following formula was used![]()
where f365 is the fraction of the AZO population that is in the cis state at the PSS under 365 nm irradiation; AE is the absorbance at the λmax (in this case 380 nm was used for the calculation) of the AZO solution before irradiation, which is assumed to be 100% trans isomer; APSS365 is the absorbance at 380 nm at the PSS under 365 nm irradiation (for this calculation, the absorbance after 100 s irradiation was used); AZ is the theoretical absorbance at 380 nm of the AZO solution at 100% cis isomer, which for this calculation was taken to be 0 (i.e., absorbance after subtraction of the solvent baseline).
For the spectral measurements at 490 nm (cis to trans), the AZO solution was irradiated continuously for 30 min with 365 nm light, then irradiated at 490 nm for various time intervals with periodic UV–vis data collection. The f490 was calculated using![]()
where f490 is the fraction of the AZO population that is in the cis state at the PSS under 490 nm irradiation; AE is the absorbance at the λmax (in this case 380 nm) of the AZO solution before irradiation at 365 nm, which is assumed to be 100% trans isomer; APSS490 is the absorbance at 380 nm at the PSS under 490 nm irradiation (for this calculation, the value after 100 s irradiation at 490 nm was used); AZ is the theoretical absorbance at 380 nm of the AZO solution at 100% cis isomer, which for this calculation was taken to be 0 (i.e., absorbance after subtraction of the solvent baseline).
For the irradiation of the hydrogels, the Petri dish containing the hydrogel was placed on a Peltier cooler set to 25 °C and PBS was added, sufficient to keep the gel from drying (approximately 200 μL). The LED was placed 1 cm above the gel. At the appropriate time intervals, the Petri dish was removed, any excess PBS was drained, the dish (with the gel in place) was placed in a UV–vis spectrometer, and its spectra were recorded. The dish and gel were then returned to the Peltier cooler, PBS was added, and irradiation was restarted until the next time interval, when the process was repeated.
2.5. Atomic Force Microscopy (AFM) of Hydrogels
Hydrogel stiffness was measured by AFM using either: (i) JPK CellHesion AFM using tipless cantilevers (Bruker NP-O10) attached to 10 μm diameter stiff polystyrene beads (Kisker Biotech PPS-10.0) using Loctite 3103 UV curing glue. The gels were immersed in PBS during the measurements. Measurements were made in randomly selected 30 μm × 30 μm areas on each hydrogel; two measurements were obtained at each point of an array of 4 × 4 in each area. (ii) Bruker Catalyst AFM coupled with a Nikon Eclipse Ti microscope, operated in peak force tapping mode using a cantilever tipped with a 5 μm diameter borosilicate glass sphere (CP-CONT-BSG-A; sQUBE, Windsor Scientific, U.K.). Hydrogels were immersed in deionized water as measurements were made in randomly selected 10 μm × 10 μm areas. The force constant of the cantilever was measured by thermal tuning in air. Force curve data were fitted using the Hertz model. Comparative experiments between the two instruments using the same samples confirmed that the data was mutually comparable. Nonparametric Kruskall–Wallis tests were used to determine the statistical significance of the differences between samples.
2.6. Scanning Electron Microscopy (SEM) and Environmental SEM (ESEM) of Hydrogels
For SEM, the hydrogels were snap frozen in liquid nitrogen, then lyophilized. Prior to imaging, hydrogels were attached to a metallic holder using double-sided tape and sputtered with gold/palladium alloy for 90 s. Images were recorded using an accelerating voltage of 10 kV.
ESEM images of hydrogels were captured in variable pressure mode at 1.3 mbar using water vapor as the make up gas. The instrument was operated at an accelerating voltage of 10 kV, and secondary electron images were collected with a large field detector.
2.7. Isolation and Culture of Mesenchymal Stem Cells (MSCs)
Human MSCs were isolated from the bone marrow (knee and hip) of male and female donors aged 58–80 years using a previously reported methodology. The relevant ethical approvals were obtained in all cases prior to the procedures. MSC cultures were expanded on tissue-culture-treated polystyrene in low-glucose Dulbecco’s modified Eagle’s medium (DMEM) with pyruvate, 10% fetal bovine serum, and 1% penicillin/streptomycin solution (containing 10 000 units of penicillin and 10 mg of streptomycin per mL) under an atmosphere of 5.5% CO2 at 37 °C. Cell interactions with substrates were characterized using cells at passage five or lower. DMEM without phenol red was used in irradiation experiments.
2.8. Assessment of Cell Viability
MSCs were seeded on coverslips at a density of 2 × 10⁴ cells cm–2 (counted by hemocytometer) 24 h prior to irradiation. Cells were exposed to light from the desired LED source for defined periods of time, then cultured for further 24 h before cell viability was assayed with the LIVE/DEAD Viability/Cytotoxicity kit (Thermo Fisher Scientific) according to the manufacturer’s instructions. All experiments were performed in triplicate, the data was averaged, and the standard mean error (SME) was calculated.
2.9. Quantification of DNA Damage
MSCs were seeded on coverslips at a density of 2 × 10⁴ cells cm–2 24 h prior to irradiation. Cells were exposed to light from either LED source for the desired period of time, then cultured for a further 24 h before being fixed with 4% formaldehyde in PBS for 10 min, followed by two 5 min washes with PBS. The cells were then permeabilized using 1% Triton-X in PBS, blocked with 10% horse serum, and stained sequentially with anti-γH2AX(phospho-S139) antibodies, AlexaFluor488-labeled donkey antirabbit antibodies (100 μL 1:400 dilution of a 2 mg mL–1 stock solution) and 4′,6-diamidino-2-phenylindole (DAPI, 1 μg mL–1 aq solution), according to standard procedures. The coverslips were mounted onto glass slides and imaged by epifluorescence microscopy, as noted above.
2.10. Analysis of Cell Viability in Response to Stiffness Changes
The general experimental design is described in the results section below. MSCs were seeded in individual hydrogel-containing dishes at a density of 4 × 10³ cells cm–2 (counted by hemocytometer), where the hydrogels had been preirradiated with 365 nm light for 30 min. The cells were cultured in the dark according to for 24 h, irradiated with 490 nm light for 60 min, followed by another 24 h period of culture. As comparators, the cells were cultured for the same period either on gels that were not previously irradiated with 365 nm light or were not exposed to the 490 nm light.
Subsequently, a resazurin assay (alamarBlue, Invitrogen, U.K.) was performed in accordance with the manufacturer’s instructions. Briefly, the reagent was added to the media (1:10 dilution) in which the cells were cultured on the hydrogel samples and left to incubate at 37 °C for 1 h in the dark. The media were then decanted and their fluorescence intensity measured, which was directly proportional to the number of metabolically active (live) cells. Each cell culture was performed in triplicate on each material using cells only from one MSC donor to avoid any interdonor variability. For the baseline negative control experiment, the resazurin reagent was added to media containing hydrogels that had not been seeded with cells.
2.11. Analysis of Cell Morphology in Response to Stiffness Changes
The cell culture and surface preparation were carried out in the same way, but instead of the viability assay, the cells were fixed with formaldehyde and permeabilized. The fixed samples were blocked with 2% bovine serum albumin and stained with AlexaFluor488-phalloidin and DAPI according to standard procedures. They were then imaged by epifluorescence microscopy, as noted above.
The images were processed in ImageJ (version 2.0.0, National Institutes of Health), and CellProfiler (version 2.1.1, Broad Institute) (47) was used to quantify cell morphometric characteristics. Analysis of variance (ANOVA) and donor-paired t-tests were used as indicated. p < 0.05 was used as a threshold for significance. Statistical tests were performed using GraphPad Prism (version 7, GraphPad Software) and Mathematica (version 11.0, Wolfram Research).
3. Results and DiscussionClick to copy section link
3.1. Preparation of AZO Cross-linker and Formulation of AZO–PA Hydrogels
To prepare the azobenzene-cross-linked polymers, a 4,4′-di(acrylamido)azobenzene (AZO) cross-linker (Figure 1B) was first synthesized by the acylation of 4,4′-diaminoazobenzene with acryloyl chloride. The structure of AZO allows it to be used as a substitute for the classical N,N′-methylenebisacrylamide (BIS) cross-linker in PA hydrogels. In terms of its photophysical properties, AZO was found to photoisomerize (trans to cis) in solution upon irradiation at 365 nm, reaching a PSS consisting 90% cis isomer after approximately 30 s (Figure 2A,B). Further irradiation for up to 1 h resulted in no significant further change. The isomerization could also be reversed (cis to trans) upon irradiation at 490 nm to a PSS of 88% trans isomer after 60 s, with no further change even after 1 h of irradiation (Figure 2C,D).
Figure 2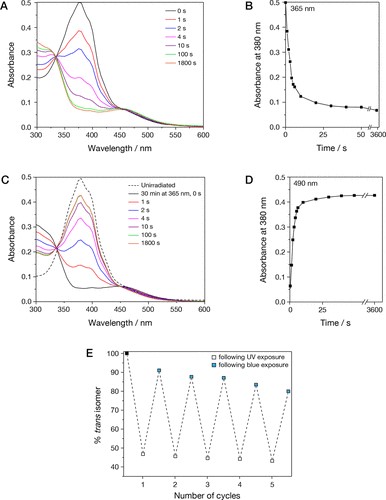
Figure 2. UV–vis absorbance spectra of AZO. (A) Sequential absorbance spectra after exposure to 365 nm irradiation for varying amounts of time. (B) Plot of absorbance at the AZO λmax (380 nm) against length of time under 365 nm irradiation. (C) Sequential absorbance spectra after exposure to 365 nm irradiation for 30 min, followed by 490 nm for varying amounts of time. (D) Plot of absorbance at the AZO λmax (380 nm) against length of time under 490 nm irradiation, showing the degree of reversibility in photoisomerization. (E) Graph of % trans isomer after each photoswitching cycle for AZO (30 min at 365 nm, followed by 60 min at 490 nm).
To test the reversibility of isomerization, the compound was subjected to five cycles of irradiation at each wavelength (Figure 2E). Consistent with the above, a PSS of 89% trans isomer was reached after the first cycle, with an approximately 2% loss for every subsequent cycle. Considering the lengthy exposure times, these results indicated a photostability that was sufficient for several cycles and for the proposed cell culture experiments.
Having shown the photoswitchability of the cross-linker in solution, a range of prepolymer formulations containing differing amounts of acrylamide, BIS, and AZO were then screened for the formation of clear, stable, and homogenous hydrogels upon polymerization (Tables S1–S6 in the Supporting Information). Here, initial efforts were aimed at dissolving AZO in a water miscible solvent (i.e., DMSO, DMF, and EtOH) that enabled the formation of a homogenous hydrogel. The formulations that were able to achieve such gels were then tuned to minimize the amount of solvent needed. The inclusion of BIS was also investigated as a means to generate stable hydrogels. Finally, formulations were tested with the aim of maximizing the amount of AZO incorporation. Of those that met these criteria for stable, homogenous gels, four formulations (formulations 56, 62, 64, and 83) that incorporated the highest quantity of AZO cross-linker were taken for further testing.
3.2. Mechanical Characterization of AZO–PA Hydrogels
The Young’s modulus of the four candidate hydrogels were measured by AFM before and after photoirradiation at 365 nm. As expected, a trend toward increasing stiffness could be observed with increasing amounts of monomer and cross-linker in the hydrogels (Figure 3A). Of these candidates, formulation 83 was found to give the largest dynamic range, with a pre-exposure stiffness of 8.3 ± 2.0 kPa that reduced to 2.0 ± 0.6 kPa after irradiation at 365 nm, comparable to that of previously reported materials that use photocleavable cross-linkers. In terms of proportion, this result represented a 76% reduction in stiffness.
Figure 3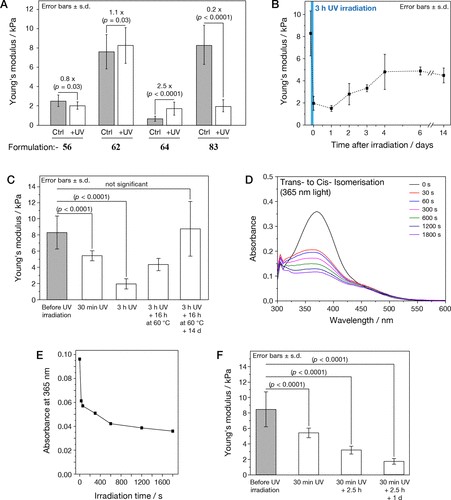
Figure 3. Mechanical analysis of hydrogels. (A) Chart of Young’s modulus measurements for the hydrogels made from the four lead candidate formulations, comparing the differences between before and after 3 h of photoirradiation at 365 nm. (B) Graph of Young’s modulus against time after 3 h of photoirradiation at 365 nm for the hydrogel from formulation 83. (C) Chart of Young’s modulus against time after 3 h of photoirradiation at 365 nm for the hydrogel from formulation 83 and upon prolonged storage. (D) UV–vis spectra of the hydrogel after exposure to light at 365 nm for varying amounts of time and (E) graph of UV–vis absorbance at 365 nm against time. (F) Young’s modulus of the AZO hydrogel after 30 min irradiation at 365 nm, followed by various rest periods (± standard deviation, s.d.; p-values indicated from Kruskal−Wallis tests).
Formulation 83 was thus taken for further mechanical stability studies. The hydrogel was irradiated at 365 nm for 3 h, followed by storage in the dark at 37 °C for 2 weeks to allow for a gradual thermal reversion. The stiffness of the sample was measured at various intervals throughout, and it was found that the stiffness of the gel only recovered to 4.5 ± 0.7 kPa after 2 weeks, with little apparent change in stiffness after 6 days (Figure 3B). To test whether relatively long UV exposure may have resulted in the degradation of the AZO linkers and the loss of full reversibility, a thermal reversibility experiment was carried out. Here, the hydrogel was irradiated for 3 h, warmed to 60 °C for 16 h, then stored in the dark at ambient temperature (∼25 °C) for 2 weeks (Figure 3C). It was observed that the stiffness had increased to 4.3 ± 0.8 kPa immediately after the thermal treatment and was fully reversed (9.0 ± 3.0 kPa) at the end of the storage period. These observations indicated that the hydrogel’s stiffness was fully reversible but only extremely slowly. This low rate of background reversibility therefore enables longer term (days to weeks) experiments such that it would make a suitable material for the proposed cell culture applications.
Notably, the subsequent analysis of the hydrogels by UV–visible spectroscopy showed that the trans-azobenzene group had reached the PSS within approximately 30 min of irradiation with 365 nm light (Figure 3D,E). This difference in rapid isomerization of the cross-linker relative to the change in macroscopic stiffness is thought to be due to a requirement for the remodeling of the polymer matrix, which is much slower than the rate of molecular photoisomerization. This delayed change in physical properties is consistent with reports of other hydrogel materials incorporating azobenzene switches.
Because only 30 min of irradiation was sufficient to reach PSS yet approximately 3 h was needed to reach minimum stiffness, a range of shorter irradiation times were investigated followed by a rest period before the stiffness measurements (Figure 3F). It was found that irradiation for 30 min followed by incubation of the material in the dark for 2.5 h under ambient conditions resulted in a repeatable stiffness change to 2.5 ± 0.2 kPa. This optimized regime was therefore used for subsequent experiments.
3.3. Light-Induced Softening and Stiffening of AZO–PA Hydrogels
Formulation 83 of the AZO–PA hydrogel was adapted to a platform that would enable the material to be used as a substrate for cell culture. As cells cannot adhere directly to polyacrylamide, the substrate was coated with a layer of fibronectin, providing binding sites for cell attachment. Previously, methods have been developed to attach a variety of alternative extracellular matrix proteins, including collagen-I, collagen-IV, and laminin. Alternating the composition of the surface coating offers further opportunity to modulate cell behavior by activating different integrin receptors at the cell membrane.
To enable a study of the interaction between cells and the AZO–PA hydrogels, a 2-day experimental program was designed (Figure 4A). First, the mechanical properties of the culture substrates were measured in the absence of cells. Analysis by AFM showed the fibronectin-coated hydrogels to be significantly softened by exposure to UV light, measured 48 h after irradiation (sample “(−) blue” in Figure 4B) compared with a control sample that was kept in the dark (sample “ctrl”), consistent with the results reported above for the uncoated gels. In contrast, exposure of the gels to blue light (60 min at 490 nm) after 24 h caused the stiffness to be significantly recovered at 48 h (sample “(+) blue”) to 7.6 ± 0.2 kPa.
Figure 4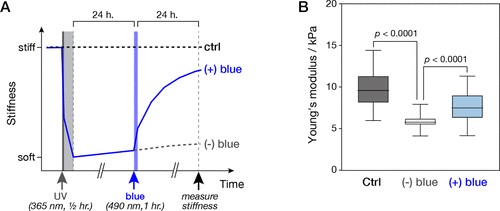
Figure 4. Hydrogel softening and stiffening by irradiation. (A) Schematic overview of experiment design showing treatments of photoresponsive hydrogels prior to mechanical characterization. Following preparation, fibronectin-coated gels were softened by exposure to UV (365 nm) irradiation for 30 min; 24 h later, (+) blue gels were exposed to blue (490 nm) light for 1 h, whereas (−) blue gels were unirradiated (left in the dark). Stiffness measurements were made after a further 24 h and compared to control gels (ctrl) that had not been exposed to UV or blue light. (B) Plot of hydrogel stiffnesses obtained by AFM. (−) Blue gels were significantly softer than controls, 5.9 ± 0.1 vs 9.7 ± 0.2 kPa. Stiffness was significantly increased to 7.6 ± 0.2 kPa in (+) blue gels (±SME; n > 97 measurements; p-values indicated from Kruskal–Wallis tests).
3.4. Substrates Examined by Electron Microscopy Exhibit Morphologies Typical of Hydrogels
The light-responsive hydrogels were imaged with scanning electron microscopy (SEM) under the same conditions as that in the mechanical characterization, i.e., with no exposure to UV irradiation (ctrl), with UV irradiation ((−) blue, softer state), and with UV followed by blue irradiation ((+) blue, returned to a stiffer state). The surface topology in all cases exhibited a branched networklike structure, with pores in the order of 5–20 μm in diameter (Figure 5A–C). This observation was consistent with earlier SEM characterizations of hydrogel morphology, including those of polyacrylamide hydrogels with conventional bis-acrylamide cross-linkers, (49) poly(vinyl alcohol)-based, (50) and protein-based hydrogels.
Figure 5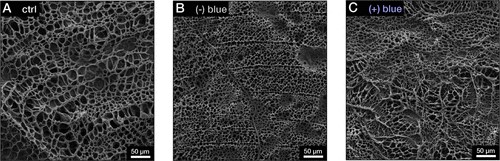
Figure 5. Scanning electron micrographs of photoresponsive hydrogels before and after irradiation. The images were recorded following the treatments indicated in Figure 4A at the point of “stiffness measurement”. (A) Control (ctrl) sample: AZO hydrogels not subjected to irradiation. (B) (−) blue sample: hydrogel treated with UV (365 nm) irradiation. (C) (+) blue sample: hydrogel treated with UV (365 nm) and subsequent blue light (490 nm) irradiation.
Previous reports of the characterization of hydrogels by SEM have suggested that the pore structures may form as samples were freeze-dried for imaging. Nonetheless, the AZO–PA hydrogels showed distinct morphological characteristics following the irradiation treatments: the pores appeared to be smaller in the (−) blue sample (Figure 5B) but were returned to a larger size following exposure to blue light, although the structure appeared less ordered (Figure 5C). These results were consistent with those of previous reports, where an inverse relationship was found between the size of pores observed by SEM and the stiffnesses of hydrogels formed by varying the relative concentrations of polyacrylamide and conventional cross-linkers. This observation further supports the view that the mechanisms by which hydrogel stiffness is altered by photoirradiation is not due only to the switching of the AZO conformation but that switching subsequently results in the reorganization of the overall polymer matrix.
These materials were also subsequently subjected to microscopy under environmental SEM (ESEM), which enabled the imaging of the hydrated gels under near ambient conditions (Figures 6 and S2 in SI). In all cases, these images showed a uniform surface with apparent “pore” features in the nanometer size regime. In contrast with the images from the freeze-dried materials, no differences in morphology were readily apparent. However, the quality of the images at high magnification (Figure 6) were not sufficiently well resolved to perform fully quantitative measurements. Several manual measurements suggest pore widths of approximately 30–50 nm in all cases, which were far below the size of biological cells.
Figure 6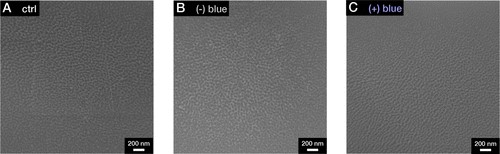
Figure 6. Environmental scanning electron micrographs of photoresponsive hydrogels before and after irradiation. The images were recorded following the treatments indicated in Figure 4A at the point of stiffness measurement. (A) Control (ctrl) sample: AZO hydrogels not subjected to irradiation. (B) (−) blue sample: hydrogel treated with UV (365 nm) irradiation. (C) (+) blue sample: hydrogel treated with UV (365 nm) and subsequent blue light (490 nm) irradiation.
3.5. Effect of Irradiation Conditions on MSC Viability
Once the dosage of light that was necessary for isomerization had been established, the next phase of investigation was to determine the extent to which irradiation would in itself affect cell behavior, irrespective of substrate mechanics. Cells cultured in vitro were therefore subjected to matched irradiation regimes and assayed for viability and damage to DNA.
Primary human mesenchymal stem cells (MSCs) cultured under standard conditions were subjected to irradiation, and viability was assessed by established live/dead staining (Figure S3A in SI). Exposure to light emitted from a blue LED for up to 1 h did not significantly alter cell viability, compared to control cells without irradiation. In contrast, exposure to just 10 min of UV light was sufficient to reduce cell viability to 18 ± 8% of that of the control (Figure S3B in the SI).
DNA double-strand breaks (DSBs) are particularly deleterious to cell viability and can occur where DNA replication forks are arrested following UV irradiation. In response to DNA damage, a cascade of kinase signaling pathways result in the phosphorylation of the histone variant H2AX. This phosphorylated histone (“γH2AX”) accumulates at DSBs and the immunostaining of γH2AX foci can be used as a basis for quantifying the extent of DNA damage. Following irradiation, the number of focal points of DNA damage were counted in each nucleus by staining with an antibody against serine-139 phosphorylated γH2AX (Figure S4A in the SI). Irradiation with blue light for up to 60 min did not increase the number of γH2AX foci above a baseline set by a control sample of cells cultured in the dark (Figure S4B in the SI). However, exposure to UV light for just 10 min was sufficient to cause so much γH2AX staining in the nuclei that individual foci could not be distinguished.
In summary, exposure to blue light had no detrimental effect on MSC viability but exposure to UV irradiation for 10 min caused sufficient DNA damage to greatly limit cell viability. Subsequent cell culture experiments were thus designed such that UV irradiation was performed prior to cell seeding onto the gels.
3.6. Substrates Enable Light-Induced Modulation of MSC Morphology
The MSC response to culture on stiffness-tuneable substrates was assessed according to the following scheme (Figure 7A). Fibronectin-coated AZO–PA hydrogels were first softened by exposure to UV light (30 min at 365 nm), and only subsequently were primary human MSCs seeded onto the softened hydrogels, thus avoiding any cell exposure to UV irradiation. As a control, MSCs were also seeded onto a hydrogel that had not been subjected to irradiation (ctrl). After 24 h, a set of cells on UV-softened substrates were subjected to blue-light irradiation ((+) blue), whereas a second set of cells on UV-softened substrates were maintained in the dark ((−) blue). All cell samples were cultured for a total of 48 h before being fixed for imaging. This work was undertaken with primary human MSCs because of their potential for application in medical and tissue engineering applications, but primary cells are subject to donor-to-donor variation. Thus, this study employed MSCs sourced from multiple donors, therefore ensuring reproducibility and robustness of both the hydrogel platform and the biological response. After fixing, the cell nuclei were stained with DAPI and the actin cytoskeleton with phalloidin, thus allowing cell morphology to be readily assessed.
Figure 7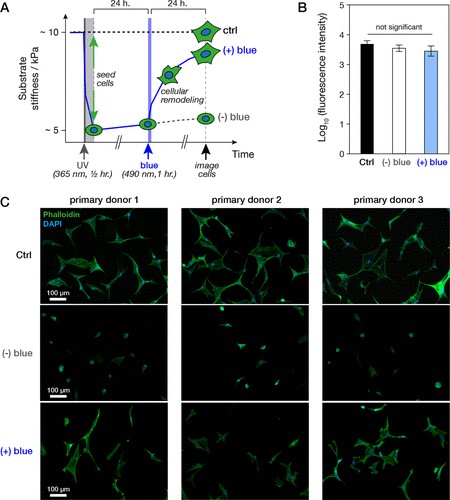
Figure 7. Mesenchymal stem cell (MSC) culture on photoresponsive hydrogels. (A) Schematic overview of cell culture experiments on photoresponsive hydrogels. Fibronectin-coated gels were softened by exposure to UV (365 nm) irradiation for 30 min. Primary human MSCs were then seeded. After 24 h, (+) blue gels were exposed to blue (490 nm) light for 1 h, whereas (−) blue gels were kept in darkness. Cells were fixed for imaging after a further 24 h and compared to cells cultured on control gels (ctrl) that had not been exposed to UV or blue light. (B) Plot of cell viability against hydrogel samples (significance determined by ANOVA testing; error bars from technical triplicate). (C) Fluorescence microscopy images of MSCs from multiple primary human donors on photoresponsive hydrogels. Cells in all conditions were seeded and fixed at the same times and stained with DAPI (blue) and phalloidin (green).
Cells adhered, spread, and flattened on the hydrogels, exhibiting a morphology typical of MSCs and adherent cells cultured on two-dimensional substrates, indicating successful cellular attachment to the fibronectin coating. Cell adherence was maintained over the 48 h course of the experiment, and an assessment of cell viability by a resazurin assay (Figure 7B) showed that there was no significant difference in the fluorescence signal in any of the surface types. Furthermore, it was observed that the cells did not show the rounded morphologies typical of apoptosis, suggesting that the hydrogel chemistry was not intrinsically toxic (Figure 7C). Additionally, cells were imaged in a single focal plane, indicating that the cells were adhering to the substrate surface and were not penetrating into the pores identified in SEM images, which typically had subcellular dimensions. Finally, for practical purposes, the cells could be imaged effectively on the hydrogels without interference from high background autofluorescence.
Cell morphology is robustly coupled to substrate stiffness, with many types of adherent cells spreading to a greater degree on stiffer substrates. (31,55,56) Features such as the alignment of actin stress fibers are also influenced by substrate stiffness. (57) Furthermore, characterizations of morphological features, such as spread cell area and cytoskeletal features, have been shown to be highly predictive of cell fate. (58) Imaging of the MSCs on AZO–PA substrates after 48 h showed ctrl cells to be well spread, (−) blue cells to be smaller, and (+) blue cells to have recovered spreading (Figure 7C).
To gain further insight into cell morphometrics, images of MSCs on the AZO–PA gels were subject to quantitative image analysis. It was found that the spread cell area was significantly lower in (−) blue samples than ctrl in each of the five biological replicates, with the mean spread area reduced from 1090 ± 60 to 500 ± 40 μm2 (donor-paired t-test p = 0.003; Figure 8A,B). The cell spread area was recovered in the (+) blue samples to 940 ± 50 μm2 (donor-paired t-test p = 0.002 for difference from (−) blue samples; Figure 8A,B). It was also found that the cell spread area can be used as a readout of stiffness, as “sensed” by the cells, by calibrating against a standard of bis-acrylamide cross-linked polyacrylamide gels prepared in accordance with the previous literature (coated with fibronectin). This method suggested that the ctrl gels having a stiffness of ∼3 kPa were softened to ∼1.5 kPa in the (−) blue treatment but were recovered to ∼2.5 kPa in (+) blue samples (Figure 8C). These values are lower than those measured by AFM (Figure 4B), but the trend was maintained and the magnitudes of fold changes were similar.
Figure 8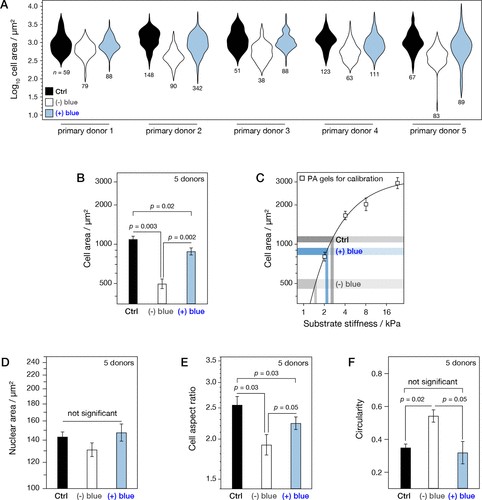
Figure 8. Quantitative morphometric analysis of mesenchymal stem cells (MSCs) on photoresponsive hydrogels. (A) Distribution plots of MSC spread areas, following treatments shown in Figure 7A (n indicates number of cells analyzed). (B) Donor-paired t-tests confirmed that MSC spread area was significantly reduced under (−) blue conditions, 500 ± 40 vs 1090 ± 60 μm2 (±SME; p = 0.003) and that spreading was significantly recovered by blue-light exposure to 940 ± 50 μm2 (±SME; p = 0.002). (C) Cell spread areas on photoresponsive gels were compared to those on polyacrylamide gels prepared according to established formulations and used as a “cellular calibration” of stiffness. (D) Nuclear spread areas correlated with trends seen in cell spread areas, although changes were not significant. (E) Cell aspect ratios were significantly reduced in (−) blue samples and recovered in (+) blue samples. (F) Cell circularity was significantly increased in (−) blue samples and recovered in (+) blue samples (all p-values from donor-paired t-tests).
Because the nucleus is physically connected to the cytoskeleton by the linker of nucleoskeleton and cytoskeleton complex, changes in cellular morphology often propagate to the nucleus, a mechanism likely to influence the transduction of mechanical signaling. Consistent with this hypothesis, the mean projected nuclear area was slightly reduced relative to ctrl in (−) blue samples but recovered in (+) blue samples. However, these trends were not statistically significant (Figure 8D). The cell aspect ratio (defined by the ratio of lengths of long to small sides of a rectangle bounding the cell) was found to be significantly lower in the (−) blue sample relative to ctrl (p = 0.03) and significantly recovered in (+) blue (p = 0.05; Figure 8E). Correspondingly, cell circularity (proportional to the area divided by the square of the perimeter) was significantly increased in the (−) blue sample relative to ctrl (p = 0.02) and reduced again in (+) blue (p = 0.05; Figure 8F). Each of these morphological characterizations is consistent with the response of MSCs to changes in substrate stiffness reported in earlier literature.
4. Conclusions
MSCs have well characterized mechanoresponses, where the phenotype can be influenced by substrate stiffness and topology at micron and nanometer scales. The AZO–PA hydrogel was able to modulate MSC behavior through alteration of substrate mechanics in response to stimulation that was otherwise “invisible” to the cells. In comparison to an earlier azobenzene-incorporating hydrogel, this material demonstrates a superior dynamic range (76% reduction in stiffness vs ∼2%) and a longer maintenance of the softer “on” state (2 weeks vs ∼10 h). It could therefore be used as a platform to study mechanosignaling in cells responding to dynamic and potentially spatially defined changes, over biologically relevant stiffnesses and timescales.
Further materials development in this area will benefit from the incorporation of advanced designs of azobenzene cross-linkers with tuneable photoabsorption that circumvent the need for detrimental UV light. The dynamic range (i.e., the difference in stiffness achieved upon switching) could also be improved by reengineering of the cross-linker to increase its solubility in aqueous media, as it would enable the incorporation of larger amounts into the polymer.
From a biological perspective, future work will apply this technology to better understand mechanotransduction signaling pathways and also biological processes with implicit changes to tissue mechanics, such as development, ageing, and fibrosis.
Effect of patterned polyacrylamide hydrogel on morphology and orientation of cultured NRVMs
Sanzari, I., Humphrey, E.J., Dinelli, F. et al.
Sci Rep 8, 11991 (2018).
https://doi.org/10.1038/s41598-018-30360-6
Abstract
We recently demonstrated that patterned Parylene C films could be effectively used as a mask for directly copolymerizing proteins on polyacrylamide hydrogel (PAm). In this work, we have proved the applicability of this technique for studying the effect such platforms render on neonatal rat ventricular myocytes (NRVMs). Firstly, we have characterised topographically and mechanically the scaffolds in liquid at the nano-scale level. We thus establish that such platforms have physical properties that closely mimics the in vivo extracellular environment of cells. We have then studied the cell morphology and physiology by comparing cultures on flat uniformly-covered and collagen-patterned scaffolds. We show that micro-patterns promote the elongation of cells along the principal axis of the ridges coated with collagen. In several cases, cells also tend to create bridges across the grooves. We have finally studied cell contraction, monitoring Ca2+ cycling at a certain stimulation. Cells seeded on patterned scaffolds present significant responses in comparison to the isotropic ones.
Introduction
The native cardiac tissue is characterised by a high anisotropic architecture that is supported by the parallel alignment of cells. The extracellular matrix (ECM) of the myocardium provides structural and biochemical cues helping cell organisation in a contractile tissue. The anisotropic architecture facilitates the preferential propagation of the electrical signal in one direction and increases the conduction velocity along the tissue. A wide range of soft materials, such as elastomers or hydrogels, was exploited to date for synthesising the artificial ECM, with hydrogels gaining significant interest in cardiac tissue engineering. These materials have characteristic properties and particularly their ability to reversibly tailor their mechanical properties (0.1–100 kPa) by varying mainly the chemical composition. Also, they can be dynamically stimulated by a variety of stimuli, such as electric field, pH, and light, and thus provide excellent prospects for controlling the dynamic extracellular environment that cells feel in vivo.
Polyacrylamide (PAm) has been one of the most exploited gels for studying the mechanotransduction of cardiomyocytes because it is easy to make and control in stiffness. NRVMs maturation on these materials has shown a significant dependency on the hydrogel stiffness. Cells on soft PAm substrates (1–50 kPa) exhibit a mature phenotype, a well-organised cytoskeleton and a reasonable excitation threshold. The magnitude of calcium stored in the sarcoplasmic reticulum and the expression of the sarcomeric calcium pump (SERCA2) were found to be greater on substrates with the elastic modulus of 10 kPa (calcium storage of almost 0.08 mM) in comparison to cells seeded on 1 kPa substrates9 (calcium storage of almost 0.03 mM). Topography has a large influence on cell alignment; cardiac cells are sensitive to both nano- and micro-scale topographies. Heidi Au et al. have demonstrated that cell alignment was greater on 0.5 µm deep grooves than 3 µm deep grooves. Other studies demonstrated an improving into the alignment of cell-seeded on patterned polyethylene glycol (PEG) hydrogels (800 nm width grooves and ridges) in comparison to unpatterned constructs.
Nevertheless, hydrogels have interesting properties for application in cell culturing, cells typically adhere poorly to them, and the functionalization with adhesion proteins is necessary. Patterning synthetic hydrogels are not straightforward. In the particular case of PAm, two main techniques are generally employed for patterning biomolecules: (1) covalently attaching proteins on activated regions and (2) copolymerizing of ECM proteins directly onto the gelvia microcontact printing (µCP). The latter involves the preparation of an elastomeric stamp generally made of polydimethylsiloxane (PDMS) that is directly printed atop of PAm pre-polymer solution. Di Benedetto et al. have demonstrated that this technique is possible to transfer the anisotropic pattern on PAm and have an anisotropic replica with grooves and ridges wide from 2 to 100 µm. However, compared to PDMS, Parylene C is typically preferred for patterning PAm hydrogels for two main reasons. Firstly, Parylene C mould preparation does not require complicated microfabrication steps. Secondly, Parylene C has a lower oxygen permeability than PDMS, and this allows an efficient preparation of PAm, whose polymerisation is inhibited by the presence of free oxygen radicals. A photoresist lift-off patterning method was also recently reported for patterning biomolecules on PAm with high fidelity. Moreover, while this technique allows for the control of the shape and size of epithelial cells, it remains as non-trivial.
In that direction, we recently proposed a simple and versatile method for patterning PAm hydrogel scaffolds either topographically and biochemically using Parylene C masks. Herein, we leverage this approach and demonstrate its use in NRVM culturing. We particularly focus on studying cell elongation, morphology, and orientation on flat PAm uniformly-covered with collagen (FPC) and grooved collagen-patterned PAm (GPC). Overall, we demonstrate that the patterns on GPC scaffolds promote significantly cellular alignment, while an increase of the calcium activity is also recorded.
Materials and Methods
Collagen IV preparation
5 mg of type IV human placenta collagen (Sigma-Aldrich, C7521) was reconstituted in 5 mL of sterile 1 X phosphate buffered saline (PBS) and let mix on a roller shaker for 3 hours. The solution was then split into five aliquots of 1 mL and stored at −20 °C.
Copolymerization of collagen IV on a polyacrylamide gel
Flat polyacrylamide covered with collagen (FPC) and grooved collagen-patterned polyacrylamide (GPC) were compared to demonstrate that the technique showed in a previous work19 can be applied to mimic in the vitro cardiac extracellular environment and promote NRVM alignment. In this work, we describe only the fabrication of FPC since the fabrication of GPC was explained in19. The spacing value of GPC (width of the ridges and grooves and depth of the grooves) was chosen as the optimum pattern for NRVMs based on the literature (i.e., 10 µm width and 1 µm deep grooves).
Briefly, this method relies on the copolymerization of collagen IV into the gel during the direct contact of the acrylamide precursor mix with a protein-activated Parylene C films. Glass coverslips (13 mm in diameter) were washed in acetone, isopropanol, and deionised water and then dried using nitrogen gun. Parylene C films (6–7 µm thick) were then deposited on the coverslips (Fig. 1a) by chemical vapour deposition using a commercially available parylene coater (PDS2010). The silane 3-trimethoxysilylpropyl methacrylate (A174) was used to improve the adhesion of the Parylene C film on the glass. Samples were treated with O2 plasma for 1 min and 40 s using an inductively coupled plasma reactor (ICP, OPT 100 ICP 380, Oxford Instruments Plasma Technology) (Fig. 1b). Plasma was generated at a pressure of 1.33 Pa, flow 100 sccm, 1000 W source power, and 20 W bias generator power. The time of exposure to plasma was identical to the one used for preparing the patterned Parylene C masks with hydrophobic/hydrophilic regions. 10 µl of protein solution was then spread on the activated Parylene C films and masks were let dry under a fume hood for 30 min (Fig. 1c).
Figure 1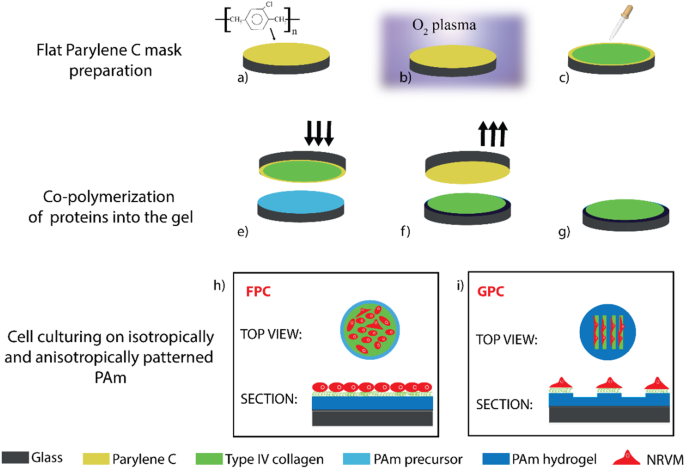
Sketch of the functionalization of flat polyacrylamide hydrogel with collagen (FPC) and cell culture application. Parylene C is placed on glass coverslips (a), treated with oxygen plasma (b) and uniformly coated with collagen (c). PAm pre-polymer solution is gently pipetted on activated glass coverslips and Parylene C mask is put in contact with the solution (e). After hydrogel polymerisation, the mask is removed (f), and FPC samples are stored in PBS (g). In (h) and (i) top and section views of FPC and GPC are shown with cells randomly distributed in FPC and aligned in GPC.
5 mL polyacrylamide hydrogel precursor with a total polymer content of 8.48% (w/v) and crosslinker concentration of 5.66% (w/w) was prepared. The solution was degassed for 1 h to remove all the dissolved gas that could limit the free radical polymerisation. To initiate gelation, 3 μL of 10% w/v ammonium persulfate (APS, Sigma-Aldrich, A3678) was added to 300 μL of gel precursor solution followed by 0.3 μL of N, N, N′, N′-Tetramethylethylenediamine accelerator (TEMED, Sigma-Aldrich, T9281). A 60 μL of gel precursor mix was gently pipetted on activated glass coverslips5 and sandwiched with protein-functionalized Parylene C masks (Fig. 1e). Gels were then left to polymerise at room temperature for one h (Fig. 1f). After polymerisation, masks were then removed and the gels were stored in PBS at 4 °C (Fig. 1g). Constructs were directly transferred in sterile tissue culture petri dish covered with cell culturing medium (Fig. 1h,i).
Contact angle measurements
Parylene C (6–7 µm) was placed as described previously on glass coverslips of 13 mm of diameter. PDMS was instead spin coated at 6000 rpm (~ 8 µm) on glass coverslip of 13 mm of diameter and cured in an oven at 75 °C for 1 hour. Sessile deionised water 10 µl droplets were gradually engaged on the surface of Parylene C and PDMS to measure the static contact angle. A Drop Shape Analysis System (DSA 30 Kruss Co., Germany) was employed for the calculation of the contact angle. A polynomial function was fitted to the two-3-phase sections of the profile in the region of the baseline. One measurement per three samples per each category was performed, and the average values were extrapolated. Samples were blown with nitrogen gun before each measurement. Samples were stored at room temperature (22 °C) and low humidity level (35%).
Topography characterisation
The topography of flat polyacrylamide was visualised using environmental variable-pressure (VP) scanning electron microscopy (SEM) (Zeiss EVO 50XVP). Almost 100 µm thick PAm was fixed on glass coverslips as described above and it was hydrated overnight in deionised water. Samples were speckled gently with Kimwipe and loaded atop SEM stubs using carbon tape. VPSE detector at 20 kV acceleration voltage was used. Measurements were taken in a reasonable time to preserve the gradual loss of water of the gel over time. The topography of Parylene C mask and PAm was evaluated using a stylus profiler (KLA-Tencor) and by using an optical microscope (Zeiss Axio Lab) at 50x magnification. Three measurements on three samples were taken for the statistical analysis.
Mechanical characterisation at the nano-scale
Flat polyacrylamide samples were prepared using the polymerisation between two activated coverslips as described elsewhere5. They were stored either in PBS or water at 4 °C before the nanoindentation tests. Our experimental setup for measuring the mechanical properties is a hybrid system made of a commercial head (SMENA, NT-MDT) with home-built electronics. Hydrogels were tested both in water and in PBS.
A spherical tip of 5 µm of diameter (sQUBE, CP-CONT-BSG-A) was used to minimise the indentation. Cantilever stiffness calibration was done following the work of Sader et al., and it was estimated to be 0.2 N/m with an error of 10%. Samples were placed in a petri dish of 35 mm of diameter filled with liquid. The approaching/retraction rate used was 400 nm/s.
Since the hydrogels showed a negligible adhesion, we have analysed the force-distance curves using the Hertz model. Young’s modulus can be thus deduced from the equation 1 as follows: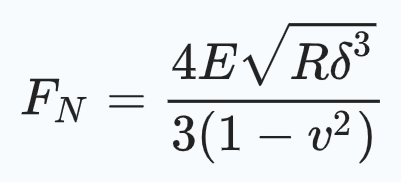
where FN is the maximum force applied, E is Young’s modulus, R is the radius of the spherical tip, the indentation depth is δ = (z − d) where z is the piezo position and d is the cantilever deflection. ν is the Poisson’s ratio equal to 0.48.
NRVM isolation and culture
The study with NRVMs was exempted from formal ethics review. NRVMs were isolated from Sprague-Dawley rats two days after birth in compliance with Schedule 1 methods (Scientific Procedures) Act 1986. The isolation technique has been described previously. Briefly, hexempteart ventricles were minced and enzymatically digested. After the digestion, the tissue was centrifuged to produce a cell suspension which was filtered to remove any non-digested tissue. Cells were then suspended again in 25 ml NRVM medium (67% Dulbecco’s modified Eagle medium (DMEM), 16% Medium 199, 10% Horse serum (Gibco), 4% foetal bovine serum (FBS) (Gibco), 2% HEPES (4-(2-hydroxyethyl)-1- piperazineethanesulfonic acid) buffer and 1% penicillin-streptomycin). The suspension was then plated in T75 flasks for 1 hour at 37 °C to remove fibroblasts. NRVMs were collected and counted using a hemocytometer. NRVMs were plated on FPC and GPC substrates, and they were successively incubated (37 °C, 5% CO2). The NRVM medium was replaced every 2–3 days. All experiments were performed 3–4 days post seeding.
Immunostaining
Monoclonal anti-α-actinin antibody (Sigma, A7811), deoxyribonucleic acid labeled with fluorescent 4′,6-diamidino-2-phenylindole (DAPI) (Invitrogen) staining were used to quantify cell alignment. Fluorescent images were obtained using an inverted Zeiss LSM-780 confocal microscope with x40 oil-immersion lens (Carl Zeiss).
Quantification of cellular alignment, morphology, and orientation
Each cell was approximately fitted with an ellipse whose minor (Dmin) and the major axis (Dmax) was defined as the length and width of individual myocyte. Dmax of each cell was selected relative to the horizontal axis of the image field. Elongation was described through the elongation factor (Dmax/Dmin − 1) that describes the extent of the equimomental ellipse lengthened or stretched out. The values of the elongation factor were determined from each scaffold on almost n = 15 cells randomly selected from each sample.
Cell area and circularity were analysed to study cell morphology using dedicated software, ImageJ (http://rsb.info.nih.gov/ij). Circularity is defined in the equation 2 :
(2) where P is the perimeter and A is the cell area, quantified using ImageJ. Circularity index equal to 1 indicates a non-elongated cell.
The cell orientation angle (θ) was measured manually using an ImageJ software package (http://rsb.info.nih.gov/ij) as the lack of deviation between the major elliptical axis and the reference axis of a single cell. For alignment of cells on grooved substrates, the direction of the pattern (preferential mean axis) was considered as a reference axis, whereas for alignment of cells on the flat substrates an arbitrary axis of alignment was chosen. The minimum alignment value close to 10° denotes parallel alignment with the direction of the pattern, and the maximum value close to 90° represents perpendicular alignment. Cells with an orientation angle of less than 10° were counted as aligned cells. Orientation angles are reported in polar plots obtained using ready-made routines in MATLAB.
Nuclei orientation was quantified as described previously via conversion of the DAPI channel images into binary images using ImageJ to recognise any ellipse (nuclei) present with the size set to 10–50 µm. Alignment was defined as the lack of deviation in the axis of an individual nucleus from the mean axis of all individual nuclei. The ellipses were only counted if they were between the set range to exclude non-nuclei or composite structures from the analysis. At least 90 cells were randomly selected per each category of scaffolds to determine cell shape and orientation. Each analysis was performed on fluorescence images (three images per each scaffold) at the same magnification.
Ca2+ transient measurements
Fluo-4-acetoxymethyl ester (fluo-4 AM) (Invitrogen, ThermoFisher Scientific) was used to visualise the intracellular calcium transients. NRVMs were loaded with 4 μL fluo-4 AM (prepared as 50 µg Fluo-4 AM dissolved in 50 µL DMSO) in 1 mL DMEM and placed in the incubator at 37 °C for 20 min1. The DMEM was refreshed, and the cells were returned to the incubator for a further 20 minutes for de-esterification of the dye. The constructs were mounted on the stage of an upright Nikon Eclipse FN1 microscope or an inverted Nikon Eclipse TE2000 microscope in a glass bottom dish (MatTek Corporation) and observed through a 40x water immersion or 40x oil objective respectively. Ca2 transients in cardiomyocytes were studied by field stimulating the cells at 1 Hz to induce rhythmic depolarisation, and line scans were recording. A custom made MATLAB code was used to calculate the normalized amplitude as f/f0, time to peak (Tp), times to 50% (T50) and 90% declines (T90) in the transients.
Statistical analysis
All the described experiments were repeated at least three times. With regards to topography, nonparametric analysis was carried out among samples to statistically evaluate the significant difference between ridges and grooves of the mask and the gel, respectively. A Mann-Whitney test was also performed to compare the two groups, and the significance was fixed at 1%.
For statistical analysis of cell elongation, morphology and orientation, three different images were acquired per each sample to analyse at least 80 cells for statistical analysis.
Mann-Whitney test was employed for evaluating cell elongation, circularity, and area whereas nuclei alignment and calcium transient were performed using an unpaired t-test. Cell area and circularity are presented as box plots, and each box is composed of whiskers indicating the lower extreme and upper extreme of the data, while the top part and the bottom part of the box are the first and third quartiles. The line inside the box is the median. In the plots, *indicates p < 0.05 and **indicates p < 0.01. The statistical analysis and graphic presentation were performed using OriginPro v.8 SR2 software and Prism 7 software (GraphPad Software Inc.). All data are expressed as a mean ± standard error of the mean.
Results and Discussion
Hydrogel patterning and characterisation
The anisotropic pattern on PAm was obtained using capillary-based approach thanks to capillarity of the pre-polymer solution in hydrophilic vertical channels created in Parylene C masks. Parylene C after plasma oxygen restores its hydrophilicity slower than PDMS. The feature height on the hydrogel strongly depends on the contact angle, the hydraulic radius of the capillary and the viscosity of the pre-polymeric solution. We have monitored the contact angle of flat Parylene C and PDMS with the same thickness (~7 µm) using ICP and reactive ionic etching (RIE). ICP treatment was used to hydrophilize Parylene C for 1 minute and 40 seconds and RIE was used to treat PDMS with oxygen for 15 sec. The time of exposure and the kind of treatment were decided based on the fabrication process that has been employed for the two materials. Figure 2a,b show 10 µl water drop on Parylene C and PDMS immediately after plasma treatment. The contact angle of Parylene C and PDMS before plasma oxygen are 84.2 ± 7.6° is 117.4 ± 2.8° respectively. Parylene C restore its hydrophobicity slower than PDMS, and we found that after 6 days the contact angle for Parylene C and PDMS was 36.07 ± 1.66° and 64.97 ± 6.72° respectively. In Fig. 2c the measurements of the contact angle for six days are shown.
Figure 2
Figure 2. Contact angle measurements. In (a) and (b), images of 10 µl DI water droplets on Parylene C and PDMS at day 0, immediately after the plasma treatment. In (c) the graph reports contact angle measurements as a function of days.
The surface of flat polyacrylamide was obtained avoiding surface aberration, and the native hydrate state of the gel was preserved. In this work, we have used PAm fixed on glass coverslip with a defined formulation to fix the structure and the elasticity of the material5. PAm SEM images generally present pores and voids on the surface because of the failure of the structures during preparation for imaging (e.g., cryo-freeze-dry) and the volume fraction and the distribution of polymeric chains can change accordingly. The hydrogels were fixed on glass coverslips obtaining a uniform film of almost 300 µm of thickness (Fig. 3a.1). The topography of flat PAm prepared with T = 8.48% (w/v), and C = 5.66% (w/w) was checked using SEM as illustrated in Fig. 3a.2, and it results more wrinkled and jagged without evident porosity since the gel was checked immediately after removing it from water and it was almost hydrated.
Figure 3
Figure 3. Surface VP SEM photograph of flat hydrogel surface and an optical micrograph of the patterned hydrogel. The image (a.1), shows a hydrogel fixed on the glass coverslip and (a.2) is a representative SEM image of flat polyacrylamide. In (b) is shown a micrograph (50x objective) of grooved PAm characterised by pitches (p), ridges (r) and grooves (g) after removing the Parylene C mask. (Red scale bar: 1 cm. White scale bar: 20 µm).
The comparison between the topography of the mask and the hydrogel after patterning was also evaluated extending the results already reported in our previous work. Grooves (g), ridges (r) and pitches (p) of the hydrogels in the hydrated state are illustrated in Fig. 3b. The average values of g, r, and p of the masks were here analysed using the profiler, and they were 6.88 ± 0.6 µm, 6.32 ± 0.1 µm and 20.62 ± 0.1 µm respectively. The average height of the grooves of the mask was found to be 0.99 ± 0.04 µm.
The averaged values of the width of g, r and p of the hydrogels were found to be10.1 ± 1.05 µm, 7.8 ± 1.24 µm and 19.7 ± 1.28 µm respectively. The comparison between the ridges of the mask and the grooves of the gels was not significant with p > 0.01. The average height of the grooves of the hydrated hydrogels was evaluated using the profiler (low force of ~1.96 mN), and it was almost 1 µm, close to the height of the grooves of the mask.
Elastic modulus values
Nanoindentation tests were performed on flat PAm samples as illustrated in Fig. 4a. These tests were necessary to quantify Young’s modulus of the substrates, important parameters for cell elongation and function5. They cannot be carried out on the microstructured ones since the radius of the AFM tip was comparable with the width of the grooves. As already mentioned sharper tips would induce plastic deformation on such soft materials. In any case, the contact area between an AFM tip and a steep ridge can never be defined due to the geometry of the system.
Figure 4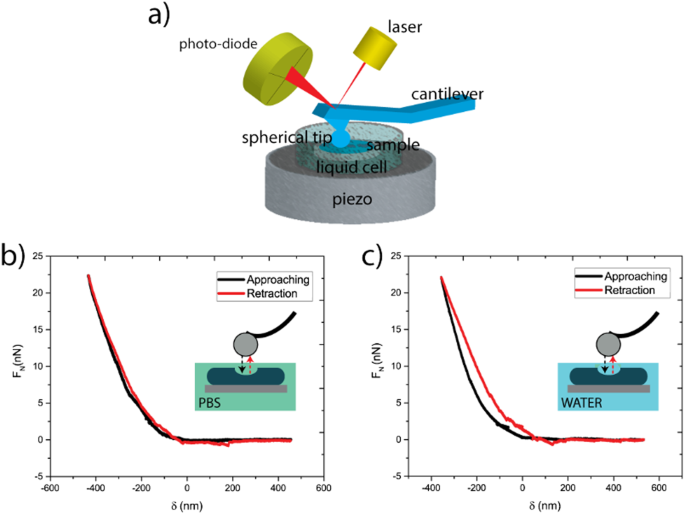
Figure 4 Elastic modulus evaluation. The draw of AFM indentation in liquid (a) and force-indentation curves (b,c) obtained from flat PAm samples underwater (a) and PBS (b).
Typical load-displacement curves for PAm show a region of the negative load in the unloading portion due to the adhesion between tip and sample (Fig. 4b,c). Measurements under water and PBS present negligible adhesion force values. Both curves do not present jump to contact and show a linear elastic behaviour. Thus in both cases, the Hertzian model can be applied. The E value was found to be 37.1 kPa for PAm measured in water, and 22.9 kPa for PAm measured in PBS. The difference might be due to local changes in the gelification process. However, the two values fall in the desired range for our application.
Cell morphology and alignment
In this work, we have applied a method previously reported to functionalize polyacrylamide hydrogel with collagen IV using Parylene C masks. Polyacrylamide without collagen treatment was cytotoxic for NRVMs as reported in Fig. S1 of Supplementary Information. As expected, cells on substrates without adhesion protein display an apoptotic behavior because of non-adhesiveness properties of PAm hydrogel. Therefore, adhesion protein is necessary for improving cell adhesion. With our proposed technique we have previously demonstrated that protein is completely transferred from selectively hydrophilized Parylene C mask onto the hydrogel. In this way, we can obtain a more biocompatible polyacrylamide based scaffolds using a simple and non-toxic technique. In this paper, we supplement our previous findings with the application of this technique towards NRVM culturing.
PAm hydrogels are widely used as a scaffold in cell biology especially for cardiomyocytes since it has mechanical properties close to the extracellular matrix of the heart. However, most of the techniques used to pattern this hydrogel are toxic and not easy to carry out. For this reason, we considered the application of this technique for cardiac tissue engineering creating biomimetic platforms that can be applied in synthetic biology. The comparison between isotropic and anisotropic substrates is made to demonstrate the effects of these platforms on cell morphology, orientation, and activity. For each cell, a best-fitted ellipse was outlined with a minor and major axis. A certain orientation (θ) of the major axis concerning the reference axis was considered as shown in Fig. 5a.
Figure 5
Figure 5. Cell morphometric analysis. Sketch of cell morphology and orientation along the collagen stripe (a). Dmax and Dmin are the long and short axis, θ the angle of orientation of the cells. Cell elongation is quantitatively evaluated through the elongation factor (b). A significant elongation between the two types of samples is evident in (b). Box plots of cell areas (c) and scatter box plots of circularity distributions (d) are shown in the bottom panel. A significant difference was found in cell circularity between cells seeded on FPC and GPC. Notes: *p < 0.005, each box has its ends at the quartiles, and the band within the boxes is the median of the distribution ((c), (d)).
Cellular alignment plays an important role in functional and physical characteristics of many tissues, especially for the heart. To demonstrate the application of our substrates on cell elongation quantitative data were extracted. The elongation factor is commonly used to quantify cellular alignment in tissue engineering. Generally, this parameter assumes 0 value for a perfect circle and 1 for an ellipse with an axis ratio of 1:234. The results shown in Fig. 5b demonstrate the efficiency of GPC scaffolds in promoting the elongation of NRVMs. The elongation factor is significantly higher for cells seeded on GPC with an averaged value of 3.75 ± 1.49 in comparison to cells seeded on FPC that have a lower value (0.70 ± 0.67). These results prove that collagen-patterns have a significant influence on NRVMs behaviour.
Cell area and circularity quantified cell morphology. Figure 5c shows the distribution of cell areas on FPC and GPC. Cell areas on FPC are more positively skewed with more dispersed values. The average area of cells on FPC was found to be 558.04 ± 428.33 µm2 in comparison to the area of cells seeded on GPC (average area: 480.04 ± 160.01 µm2). The evaluation of the cell circularity is reported in Fig. 5d. Cells on FPC were more circular as presented in a whisker plot where data are negatively skewed with an average value of 0.85 ± 0.14. Cells on GPC present a less circular morphology, and data dispersion is narrower and slightly positively skewed with an average value of 0.50 ± 0.12. The distributions of circularity denote a significant decrease when cells are seeded on patterned substrates (p < 0.005).
Cellular orientation alongside the direction of the anisotropic pattern was evident from optical images. We confirmed and quantified the orientation of cells using polar plots to show the difference in orientation of NRVMs on the two type of samples. In the polar plots, the azimuth ranges from −90° to 90°, and the 0° corresponds to the elongation direction of the pattern. A perfectly circular cell would be at the origin, and long and thin cells are far from the origin. Cells on FPC showed a random distribution (Fig. 6a) with more dispersed values close to the origin of the graph as reported in the graph of Fig. 6b, whereas cells on GPC have the preferential orientation alongside the pattern (Fig. 6c). In the polar plot of Fig. 6d, there are not points close to the origin, confirming that cells on GPC are more elongate than cells cultured on flat uniformly collagen-patterned scaffolds. The percentage of cells with angle values 15° < θ < 15° on FPC is 8.64% less than on GPC where it was found to be 77.64%. Also, cells with random distribution in uniform samples are 50.6° ± 23.4°. On collagen-patterned surfaces, the values of angles are 11.69.2° ± 9.9°.
Figure 6
Figure 6 Immunofluorescent staining images, analysis of cell and nuclei alignment on FPC and GPC. Representative immunofluorescence staining of sarcomeric α-actinin (red) and nuclei stained with DAPI (blue) on FPC (a) and GPC (c). Relative polar plots of the orientation angle of cells on FPC (c) and GPC (d) are also reported. In this polar plot the distance from the origin, R, is the elongation factor, each point is a single cell (81 cells for FPC and 85 cells for GPC) and the angle to the horizontal, θ, is the angle the long axis of the cell makes with the reference axis. In (e) is shown the modulus of the angle of nuclei alignment on uniformly covered and collagen-patterned polyacrylamide with **p < 0.01.
The modulus of the angle of nuclei was also measured using DAPI staining. Results reveal that the modulus of the angle of nuclei from the mean axis is smaller for cells seeded on GPC (31.70° ± 4.16°) than cells seeded on FPC (44.75° ± 0.81°) with a considerable alignment to the direction of the pattern as shown by the histogram in Fig. 6e.
The bright field image in Fig. 7a shows the direction of the lines (red arrow) and also the considerable tendency of the cells to follow the pattern. With these results, we also demonstrate that cells alignment is strongly aimed by cell-ECM interaction so effectively that cells follow the ridges functionalized with collagen (Fig. 7b) or the bridge across the ridges (Fig. 7c) to create focal adhesions. Immunostaining for connexin43 (Cx43) showed that gap junctions in sarcomeric α-actinin were aligned along the perimeter of the elongated cardiomyocytes cultured on GPC, resulting in spatial distribution of Cx43 primarily oriented parallel to ridges (Fig. 7d), versus more random distribution in glass control (Fig. 7e). The cx43 expression on cell aligned is indicative of well-formed intracellular contact. In our case, Cx43 also shows random membrane distribution typical of neonatal cardiomyocytes.
Figure 7
Figure 7. Cell tendency to bridge across the anisotropic pattern. Bright field image of NRVMs aligned on GPC (a) and a sketch of cells aligned alongside the features (yellow circle, (b)) and bridges across the lines (green circle, (c)). Immunofluorescence images of cells aligned on GPC and glass control with an expression of connexin43 (green) are shown in (d) and (e) respectively. (White scale bar: 50 µm).
Cell electrophysiology
Different patterning techniques have been employed to improve Ca2+ cycling in NRVMs. It has been shown that microgrooved substrates can increase the diastolic and systolic Ca2+ dynamic properties. Many studies have also revealed that the substrate stiffness can influence the electrophysiology activity of the cardiomyocytes. In this work Ca2+ cycling properties of NRVMs was studied fixing the stiffness of the scaffolds and comparing two groups: unpatterned (FPC) and patterned (GPC) constructs. No significant differences were found in the amplitude (f/f0), time to peak (Tp) and time to 50% transient decay (T50) between cells cultured on flat and grooved substrates (Fig. 8a–c), but there is only a significant increase for the 90% time decay (T90) with p < 0.05 (Fig. 8d). We have shown that fixing the stiffness and improving cell alignment Ca2+ amplitude remains the same (1.03 ± 0.02 in FPC and 1.04 ± 0.02 in GPC), but Ca2+ diastolic decay slightly increases on GPC constructs. Since the amplitude in NRVM is the same, there are no significant changes in the sarcoplasmic reticulum (SR) function and the calcium releasing through ryanodine receptors (RyR). The amplitude and the time to peak can also be attributed to the peak force generated by the cells on the substrates. Since the stiffness of the substrates has been fixed, cells generate the same force on the substrates with Tp equal to 45 ± 15.5 ms for FPC and 45.12 ± 5.9 ms for GPC. The significant decrease of T90 for cells plated on GPC samples (317.98 ± 61 ms) instead suggests that there is an increase in diastolic Ca2+ levels. Slower calcium transients can augment the contraction as myofilaments are exposed to Ca2+ for a longer period.
Figure 8
Ca2+ transient amplitude (f/f0), time to peak (Tp), 50% time to decay (T50) and 90% time to decay (T90) of NRVM cultured on unpatterned (FPC) and patterned (GPC) substrates. In (a) Ca2+ signal is shown as f/f0 with fluorescence intensity, f, normalised to the minimal intensity, f0, measured between 1 Hz contractions. In (b) time to peak of Ca2+ release in FPC and GPC. In (c) and (d) transient decay times (T50 and T90) are shown, *p < 0.05.
Conclusions
Mimicking the native extracellular matrix of the cardiac cells is one of the most important steps to design in vitro models. The goal of this research was to demonstrate the possible application of new polyacrylamide patterned scaffolds via Parylene C masks. We have used a versatile and simple method to fabricate flat and grooved constructs transferring collagen directly from hydrophilic Parylene C to PAm. We have demonstrated that Parylene C is a better mask than the classic PDMS and it can be used for better patterning PAm hydrogel. Flat and grooved surfaces were also characterized showing how the pattern is faithfully transferred onto the hydrogel. NRVMs behavior on isotropic and patterned substrates was quantified. Collected data on cell morphology, elongation and orientation confirm that a significant cell elongation is induced on anisotropic architecture mimicking the distribution of cells in the native cardiac tissue. These results, even if preliminary, are promising for creating simple in vitro platforms necessary to study the effect of drugs for different cardiac pathologies.
Special contribution of atomic force microscopy in cell death research
Ning Li , Li Zhang , Ou Qiao , Xinyue Wang , Linyan Xu and Yanhua Gong
From the journal Nanotechnology Reviews
https://doi.org/10.1515/ntrev-2023-0208
Abstract
Cell death is an important life activity in individual development. Changes in morphological and mechanical properties during cell death are crucial to identify the modes of cell death. However, due to technical limitations, little is known about these characteristics. The emergence of atomic force microscopy (AFM), a nanoscale research tool that integrates imaging and mechanical measurement functions, provides new insights into our understanding of cell death. Based on a brief introduction to the structure, principle, and working modes of AFM, this article elaborates on the contribution of AFM in cell death to detect morphological and mechanical properties, especially in apoptotic cells. Meanwhile, the potential of AFM in distinguishing different cell death modes and visualizing membrane pores (medicated by apoptosis and pyroptosis) is illustrated. In addition, this article states that using single-molecule force spectroscopy by AFM to study the mechanical and adhesive properties of cell death-related molecules. Finally, we discuss the challenges facing and further perspective of AFM.
Graphical abstract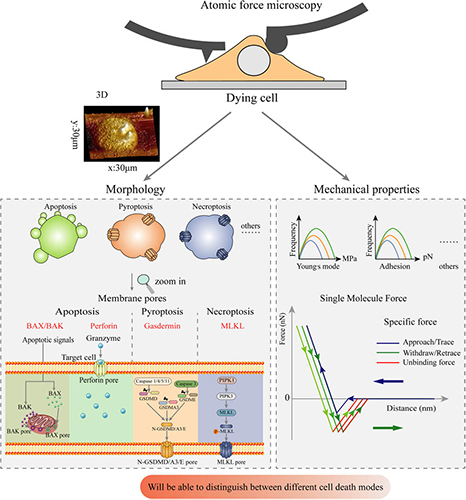
1 Introduction
Cell death is a ubiquitous biological phenomenon in all living organisms and is inseparable from organ development, aging, and the removal of damaged cells. Research on the process of cell death has become a research hotspot in the fields of biology, medicine, and pharmacy. Based on functional differences, cell death can be classified into two types: programmed cell death (PCD) and non-PCD (necrosis). Currently known PCDs mainly include apoptosis, necroptosis, pyroptosis, autophagy, ferroptosis, and so on. The molecular mechanisms/signaling pathways of different death modes have been extensively explored, and meanwhile, morphological and mechanical properties are also particularly important for the characterization of different death modes. Especially in the field of oncology research, alterations in the elasticity and adhesion of individual cancer cells have been recognized as a property that promotes the spread of cancer cells. The morphological characteristics and mechanical properties of classical cell death modes such as apoptosis have been initially explored, but the morphological and mechanical properties of new cell death modes have not been fully analyzed.
Atomic force microscopy (AFM) is a nanoscale research tool that integrates imaging and mechanical measurement functions. Compared with other traditional microscopy techniques, AFM has many advantages. For example, in terms of sample imaging, the imaging environments are diverse, and samples can be imaged under various conditions, such as air, vacuum, or liquid, including dynamic observation of living cells . In addition, the sample is not limited by its conductive properties. Moreover, AFM does not require staining, labeling, or fixing. The possibility to operate in liquid environments and at ambient temperature moved the application of AFM extends from the materials science to the biological science , which needs to overcome many difficulties, including the difference between material samples and biological samples. In general, the preparation of biological samples is more complex, such as the preparation of suspension cell samples, which needs to use diverse methods (such as electrostatic adsorption and microporous membrane filtration) to fix the cells to the substrate (such as Petri dishes, cover slides). During imaging of certain biological samples, such as membrane proteins protruding ∼1 nm from the membrane, the AFM contact mode can provide sub-nanometer resolution (≤1 nm) for imaging individual membrane proteins. Meanwhile, various physical, chemical, and biological parameters can be characterized during imaging. In addition, as a multifunctional tool, AFM is one of the important tools to study the mechanical properties of cells, including the measurements of cell Young’s modulus, adhesion, and viscoelasticity. And AFM can measure the rupture forces between molecules or particles in the piconewton (pN) range, such as analyzing the interaction force of receptor–ligand. Over the past few decades, AFM has been successfully applied to the imaging analysis of various biological systems, including nucleic acids , proteins, cells , and tissues.
At the same time, recent research advances in AFM technology have strengthened its capabilities, such as multiparametric imaging AFM (MP-AFM), and high-speed AFM (HS-AFM) , which enables simultaneous multiparametric imaging in a short time. The extraordinary ability of AFM makes it show a very broad contribution prospect in the field of cell death. It can clearly observe the morphological changes of different cell death methods, including changes in cell size, cell height, cell surface roughness, and the formation of cell membrane pores. In addition, AFM can measure dynamic changes in mechanical properties during cell death. Based on the previous research, this article briefly introduces the basic structure, imaging principle, and working modes of AFM and reviews its contribution in the field of cell death in detail, including the study of morphological and mechanical properties of different cell death modes (Graphical abstract, the curve in the figure is a schematic and does not represent real experimental data). At the end of this article, we also expound on the research status of AFM and discuss its current challenges and future development directions for the shortcomings of AFM.
2 The morphology and mechanisms of different cell death modes
There are multiple cell death modes, such as apoptosis, pyroptosis, necroptosis, and ferroptosis. Apoptosis was first described by Kerr et al. from a morphological point of view to describe the physiological death of cells and named it apoptosis. The main morphological features of apoptotic cells are chromatin condensation, cell shrinkage, cell membrane blebbing, cell budding to form apoptotic bodies, etc. (Table 1). After induction of apoptosis, BAX and BAK are activated and aggregated and inserted on the mitochondrial outer membrane (MOM), undergo conformational rearrangement, oligomerize to form pores, and release pro-apoptotic factors such as cytochrome C and SMAC/DIABLO, etc., thereby initiating the apoptotic program . Then in 2001, Cookson et al. first proposed the definition of pyroptosis, which is described as pro-inflammatory PCD . The main morphological manifestations were DNA breakage, cell swelling, cell membrane pore formation, and release of cell contents. During pyroptosis, gasdermin D (GSDMD) or GSDME is activated by caspase-1/4/5/11 or caspase-3 after cleavage, oligomerization and inserts into the cell membrane to form pyroptotic pores, leading to cell swelling and rupture. Afterward, in 2005, the necroptosis term was first proposed by Degterev et al. . Its main features include cell membrane rupture, autophagosome formation, and significant organelle swelling. RIPK1, RIPK3, and MLKL are key molecules in the process of necroptosis. Researchers found that p-MLKL has the potential to create pores in the plasma membrane resulting in membrane rupture. Ferroptosis as a novel cell death mode was first proposed in 2012 by Dixon et al. The morphological characteristics were cell membrane rupture, increased density, and decreased volume of the mitochondrial membrane.
3 Introduction to AFM structure, principle, and working modes
3.1 AFM structure and principle
AFM was invented by physicist Binnig et al. in 1986. The invention of AFM overcomes the shortcomings of STM in measuring nonconducting samples and expands the detection from conductors and semiconductors to insulators. In addition, AFM has a wide range of applications compared to other microscopes, including working in liquid environments (PBS) as well as soft samples (living cells), combining topographic imaging with force spectroscopy and nanomechanics. AFM mainly consists of the following systems: a laser system for laser generation, a head detection system consisting of a cantilever and a very sharp tip at its end, a laser detection system that receives laser reflection, and a feedback system that processes and transmits feedback signals to the piezoelectric scanner. The working principle of AFM is shown in Figure 1a. When the tip of the probe begin to scan the sample, the weak interaction force (mechanical contact force, van der Waals force, electrostatic force, etc.) between the probe tip and the sample causes the cantilever to swing. The deformation signal is converted into a photoelectric signal and amplified, and the signal of the interaction force between atoms can be obtained. Among them, the interaction force between the tip and the sample is related to the distance between them, which can be simply divided into attractive force and repulsive force, as shown in Figure 1b.
Figure 1
AFM. (a) Schematic diagram of AFM operation. (b) Force–distance curve by AFM. (c) Three working modes are commonly used in AFM.
3.2 AFM working modes
AFM provides three commonly used working modes, namely contact mode, non-contact mode, and dynamic mode (originally called tapping or oscillation mode), as shown in Figure 1c. In the contact mode, the sample and the tip are always in contact (corresponding to segments 1–2 in Figure 1b). In this mode, high-resolution images can be obtained due to the close proximity of the sample to the tip. But also because of this, too close distance may cause contamination and damage to the tip, and the friction force of the tip to the sample will also cause damage to the sample and affect the quality of imaging. Therefore, when applying it to softer biological samples, it is necessary to adjust the force applied to the tip, generally avoiding more than 100 pN, as excessive force may lead to reversible or even irreversible deformation. In the non-contact mode, the microcantilever vibrates near the sample surface (corresponding to segments 3–4 in Figure 1b). In this mode, the tip is not in direct contact with the sample, which makes up for the problems of sample damage and tip contamination in the contact mode. However, compared with the contact mode, the non-contact mode has a lower resolution and is unsuitable for imaging in liquid environments. In the dynamic mode, the cantilever oscillates with a larger amplitude (greater than 20 nm) near the resonance frequency during the scanning process (corresponding to segments 1–4 in Figure 1b). This mode minimizes friction and shear forces between the tip and the sample while maintaining a resolution that is essentially the same as the contact mode. In summary, the dynamic mode is suitable for objects that are more flexible and more brittle and only weakly adsorb to supports, such as DNA, proteins, and fibrils of Tau.
4 Use AFM to detect the dynamic changes of morphological and mechanical properties of different cell death modes
Some caution should be taken into account to reduce the invasiveness degree toward the delicate biological cell samples during AFM technique. The first is sample preparation. In living cells, the position change of the sample caused by the lateral force applied by the AFM probe during scanning imaging should be avoided. For adherent cells, because they can be naturally attached to the substrate (such as Petri dishes, cover slides), they can be directly imaged after adherent. The substrate surface can also be covered with a layer of polylysine to increase the adhesion effect . For suspension cells, appropriate fixation methods (such as electrostatic adsorption and microporous membrane filtration) are needed to adsorb them to the substrate and then image them . The second is the choice of probe. Probe quality and probe parameters will directly affect the final result. Because of its small contact area with the cell, the pyramidal probe can capture the details of the geometric properties of the cell surface and is often used for cell surface topography scanning. The micrometer-sized spherical probe is often used to measure the more holistic mechanical properties of cells because of their stable contact.
4.1 AFM exploring the morphological characteristics of apoptotic cells
Human understanding of cell death has gone through a long process. Prior to the advent of cell staining and microscopy, early studies of cell death largely focused on morphological observations with the naked eye. So far, morphological observation is still one of the important basis for judging different cell death modes. And different death modes show different morphological characteristics. Currently, cell morphology is mainly observed by optical microscopy (OM), transmission electron microscopy (TEM), and scanning electron microscopy (SEM), but these methods all have certain limitations (Table 2). For example, conventional OM suffers from a resolution limit of 200 nm, making it impossible to reveal the nanostructure of cells . Second, the essential advantage of AFM over TEM/SEM is the ability to measure the biophysical properties of biological samples under physiological conditions. In recent years, with the development of microscopy technology, AFM has been gradually applied to the morphological observation of different cell death modes. According to the obtained 2D and 3D topological maps of cells, relevant information such as cell volume, cell height, cell membrane surface roughness, and cell membrane pore formation can be clearly collected, which provides a strong support for further understanding the morphological characteristics of specific cell death modes.
AFM has been used to observe the morphological characteristics of different cell death modes, but existing studies have mainly focused on apoptosis. Previous studies have shown that reduction in cell volume is a prerequisite for the early stages of apoptosis In 2005, Hessler et al. used AFM to observe early morphological changes in human oral epidermoid carcinoma cells (KB cells) apoptosis induced by staurosporine (STS) The images were obtained using the contact mode by silicon nitride cantilevers MSCT-AUNM (cantilever C) at the spring constant of about 0.01 N m−1. AFM data showed a 50% reduction in total cell volume and a 32% reduction in total cell height, and the reduction in apoptotic cell volume preceded other key hallmarks of apoptosis, such as loss of mitochondrial membrane potential . Researches also indicated that there was a significant change in cell volume during the initial stage of apoptosis Cells are generally in the range of an AFM scan, but even the same cell type can vary by up to a few micrometers. Therefore, there are many difficulties that need to be overcome in using changes in cell volume as a marker of early apoptosis. However, it is much more convenient to observe the surface characteristics of the membrane. Moreover, the variation of cell membrane surface roughness is an indication of early apoptosis. AFM morphological imaging allows the extraction of 3D topology-related data of cells, which enables analysis of cell membrane surface roughness. Therefore, to identify apoptosis at an early stage, in 2011, Wang et al. employed AFM to observe changes in the membrane surface roughness of hydrogen peroxide (H2O2)-induced apoptosis in the mouse macrophage cell line RAW264.7. Results showed that the mean roughness increased between 24 and 60 nm with increasing H2O2 concentration . It is worth noting that, although under normal circumstances, with the occurrence of apoptosis, the surface roughness of the cell membrane shows an increasing trend. However, there are some exceptions. For example, when Cai et al. used AFM to observe the apoptotic K562 cells induced by peripheral lymphocytes. The UL20B cantilever whose length, width, and thickness are 115, 30, and 3.5 μm, respectively, was chosen in the contact mode. The oscillation frequency is 255 kHz and the force constant is 0.01 N m−1. And they found that after co-culturing these two type cells, K562 cells showed typical characteristics of apoptosis, but the cell surface roughness was significantly reduced. Furthermore, the formation of cell membrane pores is one of the sources of cell surface roughness, and as the pores become deeper, the cell surface becomes rougher. Therefore, to better describe the morphological characteristics of apoptosis, cell membrane pores are usually observed and analyzed. These studies further reveal morphological changes during apoptosis and deepen our understanding of cell death.
4.2 Advances in AFM measurement of mechanical properties during cell death
Likewise, cell mechanics can be used to describe the state of a cell, where certain changes in mechanical properties occur during cell death. AFM has been shown to be a powerful non-destructive nanotechnology that can be used to obtain dynamic processes related to cellular mechanics, such as elasticity and adhesion. Studies have shown that apoptosis may be associated with changes in cell elasticity. In addition, the adhesion of cell membranes plays a very important role in cell physiology and pathological processes. Hu et al. used AFM measurement and calculated by Hertz model to obtain the Young’s moduli of lymphocytes in three states of resting, activated, and apoptotic, which were 11.2 ± 5.9, 19.7 ± 4.0, and 7.1 ± 4.1 kPa, respectively, indicating that the Young’s modulus of apoptotic cells was significantly reduced. The high values of the Young’s modulus of elasticity reported in this article may be due to the limitations of experimental conditions, such as force profiles measured in air, where humidity, temperature, cell dehydration, or cell drying can have a dramatic effect on the results. For example, in 2014, Jin et al. showed the damaged effect of sodium nitroprusside (SNP) on cell surface adhesion (30% reduction) and elasticity (90% reduction) at the nano level in apoptotic chondrocytes. In this study, the force spectrum experiment was performed at the force loading rate is 1.2 × 10⁵ pN s−1. The mechanical properties of cells have gradually become an important characteristic to distinguish healthy cells from dead cells. Meanwhile, due to the extremely high mechanical resolution of AFM, AFM single-molecule force spectroscopy technology (AFM-SMFS) developed in AFM technology has gradually become an effective tool to measure the intra- and inter-cellular interactions of biological macromolecules at the single-cell level. Future AFM holds great potential for the mechanistic measurement of different cell death modes.
4.3 Use AFM to study the relationship between cell death and cytoskeleton
In the process of studying cell mechanics, the study of the cytoskeleton is an essential part. The cytoskeleton is important for maintaining cell mechanical properties, and cytoskeleton remodeling plays an important role in the process of apoptosis. Importantly, it has been shown that changes in cellular elasticity are inextricably linked to the components of the cytoskeleton in addition to the intrinsic properties of the cell membrane. Actin filaments and microtubules, two major components of the cytoskeleton, are severely damaged in structure, organization, and function, leading to cell death. For example, Jin et al. studied the cytoskeleton of SNP-induced chondrocyte apoptosis, and after SNP treatment, the F-actin and α-tubulin cytoskeleton of chondrocytes reorganized and polymerized. In addition, other researchers have continued to explore how the composition of the cytoskeleton affects cell elasticity. Rotsch and Radmacher found drugs that depolymerized actin filaments could significantly reduce the elastic modulus of cells, while drugs that stabilized microtubules had no significant effect on cell elasticity, suggesting that the actin network primarily determines the elastic properties of living cells. To learn more about the effects of how microtubules and actin filaments affect cytoskeletal mechanical properties during apoptosis. Pelling et al. indicated that cell structure was highly dynamic during the early stages of apoptosis, with F-actin in actin filaments controlling the cell’s initial elastic response, while microtubules appear to control the cell’s viscous relaxation for extended periods. Due to the limitations of AFM imaging, the most common way to monitor cytoskeletal changes is to combine AFM with confocal microscopy to study the dynamic changes of actin filaments and microtubules. However, the study by Henderson et al. showed that AFM could directly image actin filaments in living cells and observe the dynamic changes of actin filaments. Although researchers have a preliminary understanding of the role of the cytoskeleton in maintaining the mechanical properties of cells, the relationship between the cytoskeleton and cell death remains to be further explored.
4.4 Potential of AFM to distinguish different cell death modes
With the development of AFM technology year by year, studies using AFM to observe various cell death modes have emerged in recent years. Meeren et al. tested the differences in morphological and mechanical properties between three different PCD modes: intrinsic and extrinsic apoptosis, necroptosis, and ferroptosis in mouse tumor cell lines (L929sAhFas cell line) . In morphological measurements, the resulting topographic image was obtained using the ATEC-CONT cantilever in a JPK QI® mode using the selected AFM nanowizard 4™ (JPK GmbH Instruments/Bruker). In cell elasticity measurements, all force curves were obtained in a contact mode using a colloidal probe containing a spherical tip of 5 μm diameter (CP-qp-SCONT-BSG, force constant 0.1 N m−1) and using a setpoint of 2 nN at 2 µm s−1. During intrinsic apoptosis, cells shrink and irregular structures are formed (Figure 2a, middle left). During extrinsic apoptosis, cell shrinkage was increased with concomitant apoptotic body generation (Figure 3a, middle right). During necroptosis, cells did not shrink but detached and swelled, and pores of different sizes were formed in the cell membrane (Figure 2b, middle). During ferroptosis, circular protrusions of 1–5 μm were observed to form on the cell membrane surface (Figure 2c, middle). In addition, the data showed that as the cell death process progressed, the cell surface roughness of these three cell death modes increased significantly. And the smallest increase is necroptosis. Overall, the AFM data clearly showed morphological characteristics in different cell death modes. Second, Meeren et al. also used AFM to measure the elasticity of multiple cells in these three PCDs. In the process of intrinsic apoptosis, Young’s modulus decreased rapidly 15 min after induction (Figure 2a, bottom left) and remained basically stable after the decrease. In contrast, for extrinsic apoptosis, Young’s modulus showed a trend of first increasing and then rapidly decreasing 60 min after induction (Figure 2a, bottom right). For both necroptosis and ferroptosis, Young’s modulus showed a continuous decreasing trend (Figure 2b and c, bottom). When comparing the Young’s modulus of these three cell death modes, it was found that the Young’s modulus of apoptosis (intrinsic and extrinsic apoptosis) decreased more rapidly compared with necroptosis and ferroptosis. Therefore, using AFM to study different cell death modes will help us to more clearly understand the dynamic changes of morphological and mechanical properties in the process of cell death.
Figure 2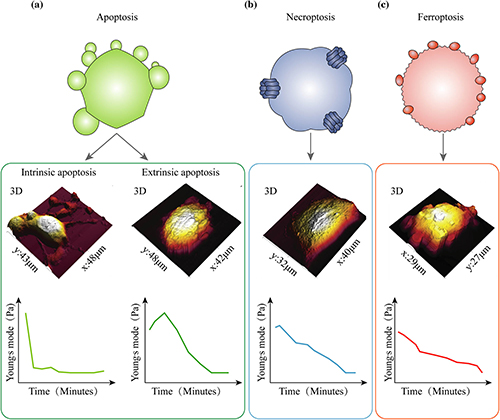
Schematic diagram of different cell death modes morphology (top), AFM imaging 3D topology (middle), and Young’s modulus (bottom). (a) Apoptosis, including intrinsic apoptosis and extrinsic apoptosis; (b) necroptosis; and (c) ferroptosis.
Figure 3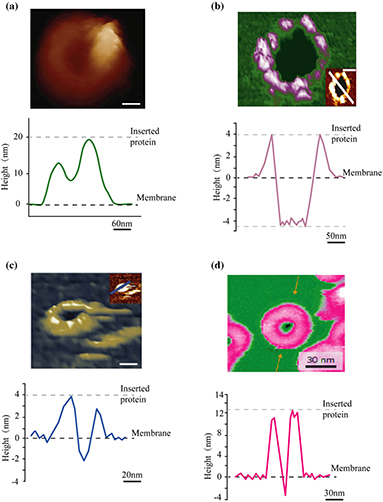
MAC, BAX, BAK, and perforin pore morphological characteristics detected by AFM scanning. AFM imaging 3D topography of the MAC, BAK, BAX, and perforin pore (top of each image). The MAC, BAX, BAK, and perforin molecules around the pore protrude around the membrane plane, as confirmed by the height cross-sections below each image (corresponding to the gray dashed line in the AFM image) (bottom of each image).
5 AFM visualizes membrane pores in different cell death
A membrane pore can be defined as any local membrane perturbation that allows passive flow of molecules [96]. Different types of pores formation in the membrane may lead to different types of cell death. For example, after induction of apoptosis, BAX and BAK will aggregate into pores in the mitochondrial membrane, release pro-apoptotic factors, and start the apoptosis process In addition, during apoptosis, perforin (PFR) released by T/NK cells can also form pores in the cell membrane. Similarly, the gasdermin family (such as GSDMD or GSDME), the ultimate executor of pyroptosis, induces the occurrence of pyroptosis by punching holes in the cell membrane. MLKL is the only known effector molecule associated with necroptosis . Available data suggest that p-MLKL has the potential to create pores in the plasma membrane resulting in membrane rupture . Unfortunately, we are not yet able to understand the structure and topology of MLKL in the cell membrane. In addition, the membrane attack complex (MAC), a terminal pathway common to the three complement activation pathways, can also be assembled by soluble monomeric proteins and form killer transmembrane pores that mediate cell deat. AFM has successfully imaged the morphology of membrane attack complex structures on the cell membrane (Figure 3). Similarly, in the past experiments, SEM, TEM, and other microscopes were mostly used to observe the formed membrane pores. However, because of the harsh imaging environment, it is usually difficult to observe clear membrane pore images and the shape of the formed oligomers. In contrast, AFM, as a microscope that allows the acquisition of native membrane images at sub-molecular resolution, enables a clearer observation of the dynamic assembly process of transmembrane pores. Therefore, we broadly review relevant studies on the dynamic visualization of membrane pore formation mediated by various molecules by AFM. These studies reveal real-time morphology during pore formation and greatly advance our understanding of pore formation-mediated cell death.
5.1 AFM visualization of BAX/BAK and PFR-mediated apoptosis pore formation
BAX and BAK are pro-apoptotic members of the BCL-2 family required for mitochondrial outer membrane permeability (MOMP) and play a key role in apoptosis. Under normal conditions, BAX and BAK are present in healthy cells in inactive forms. After receiving an apoptotic signal, they are activated and oligomerically inserted into the MOM, which is accompanied by an increase in MOMP, and then BAX and BAK form giant pores . However, the mechanism of how BAX and BAK aggregate and form apoptotic pores is still not fully understood. A recent study showed that AFM analysis of supported lipid bilayers (SLBs) prepared from proteoliposomes containing activated BAX monomers revealed that BAX formed linear, arc-shaped, and ring-shaped in SLBs of varying sizes and shapes. In other words, AFM can observe the formation of membrane pores associated with this protein (Figure 3b), which are not uniform in size and shape but are generally circular with diameters between 24 and 176 nm. In the same way, Cosentino et al. observed the structure formed by BAK in SLBs and compared it with the pores formed by BAX. BAK also formed straight lines, arcs, and ring structures in SLBs (Figure 3c), but the pores formed by BAK were smaller and more uniform, and the rings had an average pore radius of about 8.12 nm.
As a pore-forming protein, PFR can form oligomeric pores in target cell membranes, which allow the entry of pro-apoptotic granzymes, thereby causing apoptosis of target cells . Leung et al. visualized the PFR nanopore assembly in real time, where PFR first forms loosely but irreversibly bound, short prepore oligomers on target cell membranes. These short oligomers, after insertion into the membrane, recruit additional prepore oligomers, facilitating further assembly to form larger arc- and ring-shaped transmembrane pores (Figure 3d).
5.2 AFM visualization of gasdermin family protein-mediated pyroptosis pore formation
Gasdermin family proteins, as the final executors of pyroptosis, consist of six members in humans, namely GSDMA, GSDMB, GSDMC, GSDMD, GSDME (DFNA5), and PJVK (DFNB59). Among them, GSDMD, as one of the earliest discovered, most widely studied, and most in-depth members of the gasdermin family, can be activated and cleaved by caspase 1/4/5/11 to form N-GSDMD and C-GSDMD. N-GSDMD acts directly on the cell membrane, forming pores in the membrane and triggering pyroptosis. However, how the N-GSDMD domain assembles the pores and the mechanism of penetrating the plasma membrane remains poorly understood. To address this issue, Mulvihil et al. applied high-resolution and time-lapse AFM to directly image the pore-forming process of N-GSDMD on supported lipid membranes (SLMs) . Results showed that N-GSDMD released from GSDMD cleavage by caspase-1 can assemble into slit-, ring- and few arc-shaped oligomers (Figure 4a). And each oligomer structure occasionally forms transmembrane pores penetrating the SLMs. The structure height of slit- and ring-shaped oligomers protruding from the SLM is about 3.6 nm, indicating that they are almost completely inserted into the membrane. The analytical data also showed that the diameters of the ring-shaped oligomers were widely distributed between 13.5 and 33.5 nm, with an average value of approximately 22.6 nm . These findings are consistent with the study by Sborgi et al. that N-GSDMD binds to lipid membranes and forms arc-, slit-, and ring-shaped oligomers, and the formed arcs and slits may fuse into ring-shaped N-GSDMD oligomers of variable diameter with an average value of 21 nm. On the basis of AFM imaging, it can be speculated that the pathway for N-GSDMD to form pores is roughly as shown in Figure 4b. Furthermore, it is necessary to explore whether the pore-forming activity of GSDMD-N is also present in other gasdermin family members. Mari et al. characterized the pore-forming activity of mouse GSDMA3 by high-resolution time-lapse AFM. It was found that GSDMA3 oligomers assemble on the SLMs and remain in a mobile or attached state. And once inserted into the membrane, it oligomerizes to form arc-, slit-, and ring-shaped oligomers, each of which also forms transmembrane pores, the pathway of N-GSDMA3 to form pores is shown in Figure 4b. In addition, Liu et al. visualized the pore-forming process of GSDME on the cell membrane by AFM. Overall, these studies collectively suggest that the gasdermin family proteins are the direct and ultimate executor of pyroptosis. The high-resolution information of the pyroptotic pores shows the unique value of AFM in the study of pyroptosis.
Figure 4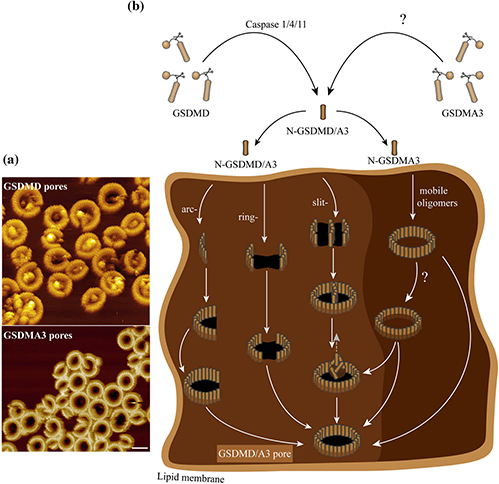
GSDMD/A3 pore formation diagram. (a) AFM images of arc-, slit-, and ring-formed by N-GSDMD/A3 and (b) model of N-GSDMD/A3 oligomerization and pore formation.
5.3 Problems with AFM visualization of membrane pores
To date, AFM has made great progress in visualizing membrane pore formation, but most studies have imaged pores on artificial liposomes or SLMs , and only a few studies have imaged membrane pores on real living cells . This could be due to the strict requirements of high-resolution imaging (nanoscale) and sample preparation problems, imaging in real cell membrane pores is difficult and complicated. Because cell membranes are mainly composed of membrane proteins and phospholipids. Artificial lipid bilayers model (artificial membranes) can simulate cell membranes and keep their function intact . Therefore, the artificial membranes are good alternative to cell membranes. It provides a lot of information about the morphology and properties of a phospholipid bilayer. However, there are still some limitations in the use of artificial liposomes and SLMs for pore visualization, including the lack of a membrane protein-intrinsic cytoskeleton, leading to possible discrepancies among pores in liposomes and SLMs and the actual cell membrane, generating possible errors in observing the dynamics of pore formation . For example, related studies have shown that in real cells, PFR-induced pore size is about 200 nm, much larger than that detected from SLMs (about 10–20 nm) . In addition, the size of pores formed by GSDMD proteins in real cell membranes and SLMs is also inconsistent . Therefore, the results obtained using artificial liposomes and SLMs as research subjects may not reflect the relationship between cell membrane pore formation and cell death. To make a better connection between the formation of membrane pores and cell death, the study of real cell membrane pore formation using AFM should be accelerated. However, there is another problem with the visualization of membrane pores by AFM. Although studies are comparing the membrane pores depth with the cytoplasmic membrane thickness to confirm that the membrane pores imaged by AFM are real cell membrane pores and not from membrane depression or folds. We still do not know how to exclude that only hollows were formed as the AFM tip cannot probe the inner part of the cell nor the underneath part of a supported lipid layer.
6 Study of cell death-related molecules using AFM-SMFS
The reasons for different cell death modes are not the same, it has been described above that the changes in morphological and mechanical properties of different cell death modes induced by different substances can be directly detected by AFM. However, as with other imaging techniques, we cannot obtain quantitative information on intermolecular or intramolecular interactions from AFM images, which also leads us to be unable to fully determine that cell death is induced by a specific substance. And the single-molecule force spectroscopy technique of atomic force microscopy (AFM-SMFS) is a good solution to this problem . Since this technique requires tip-sample interaction, we can achieve this by functionalizing the AFM tip with particular chemical groups/ligands/antibodies. The main methods for attaching specific molecules to the AFM tip include physical adsorption, specific interaction, and chemical coupling (silanization, covalent coupling). In the experimental process, according to the nature of the sample, different connection methods can be used. After functionalization, AFM-SMFS allows the measurement of the adhesion and mechanical strength of specific bonds formed between the tip and individual sample molecules. Therefore, AFM can not only be used for imaging but has also become an indispensable measurement tool for studying biological macromolecular interactions.
The rapid development of AFM-SMFS has made it successfully applied to the analysis of single-molecule mechanical properties and intermolecular interactions, including DNA melting and dynamic structural changes , the dissociation mechanisms of DNA duplex , protein folding and unfolding , and interactions between biological macromolecules (protein–protein interaction, protein–nucleic acid interaction, protein–ligand interaction, etc.) . However, past studies have typically used only one biomolecule to functionalize the AFM tip when applying single-molecule force spectroscopy, but Pfreundschuh et al. further developed this technique . Pfreundschuh et al. functionalized the AFM tip with two different ligands to map the two binding sites of human G protein-coupled receptors . It can be seen that AFM-SMFS has great prospects in the field of biological research. Therefore, in recent years, AFM-SMFS has also been gradually applied in the field of cell death. pf-80 is an anti-PFR monoclonal antibody that recognizes PFR epitopes without interfering with plasma membrane binding of PFR . In studying PFR-induced apoptosis in bulk tumor cells and tumor-repopulating cells (TRC, low flexibility prevents membrane pore formation caused by PFR released by cytotoxic T cells), they attached pf-80 to the AFM tip and examined the adhesion between pf-80 and PFR (Figure 5a, left) . The results showed that in bulk tumor cells, the adhesion between pf-80 and PFR was very high. But in TRC cells, the adhesion between pf-80 and PFR was very low, which may be due to the decreased expression of MYH9 (a motor protein that interacts with PFR) in TRC, which has the function of cross-linking and hardening F-actin. Its reduced expression may lead to a decrease in the interaction force between stable pf-80 and PFR, which ultimately leads to less adhesion between pf-80 and PFR in TRC cells . Epidermal growth factor receptor (EGFR) is a cell transmembrane protein whose overexpression is common in many cancers, which can be activated by binding to epidermal growth factor (EGF). In other words, low expression of EGFR can induce tumor cell death. Resveratrol, as an anti-tumor drug, can inhibit the activity of EGFR, thereby inducing tumor cell death . Zhang et al. used EGF-functionalized AFM probes to study the cell surface EGFR expression changes after treatment with different resveratrol concentrations (Figure 5a, right) . The results showed that there was no significant change in the unbinding force of the low-dose resveratrol-treated group (up to 20 μg ml−1) compared with the untreated group. However, when cells were treated with 40 μg ml−1 resveratrol, the unbinding force was significantly reduced. Furthermore, they also demonstrated that when EGF (100 mg ml−1) is added gently to untreated MCF-7 cells, the interaction forces between EGF and EGFR were specifically blocked (Figure 5b) . Thus, can we apply a similar idea to other cell death processes (Gasdermin family-mediated pyroptosis, MLKL protein-mediated necroptosis) using single-molecule force spectroscopy? This will help us to understand the dynamic changes and mechanisms of single molecules in the process of inducing cell death.
Figure 5
The specific recognition and detection of the molecule related to cell death by single-molecule force spectroscopy technique of atomic force microscopy (AFM-SMFS). (a) Schematic diagram of measuring the interaction between perforin and its monoclonal antibody pf-80, epidermal growth factor (EGF) and its receptor EGFR on the cell membrane by AFM-SMFS technology. (b) Typical force curve of EGF and EGFR interaction with specific unbinding peaks on cancer cells.
7 Discussion and further perspective
Clearly, AFM has emerged as a powerful imaging tool capable of imaging biological systems at high resolution (nanoscale). AFM topography can be used to characterize the morphological characteristics of different cell death modes. Analysis of cell biomechanical properties can detect the early onset of cell death and the dynamic changes in mechanical properties during death, thereby distinguishing different cell death modes . Notably, AFM is currently the only force measurement technique that can map the nanoscale lateral distribution of individual molecular recognition sites on biological surfaces, which is beyond the reach of traditional biochemical methods . And in recent years, great progress has been made in enhancing the function of AFM, including the development of different AFMs such as multiparametric AFM (MP-AFM) , molecular recognition AFM (MR-AFM) , multifrequency AFM (MF-AFM) , high-speed AFM (HS-AFM) , and fluidic force microscopy (FluidFM) . At the same time, to better image and identify the complex structure of some biological systems, AFM can also be combined with other complementary techniques, including OM, fluorescence microscopy, confocal microscopy, super-resolution microscopy, etc. The most commonly used combination of AFM is fluorescence microscopy or confocal microscopy . For example, in addressing the limitations of AFM imaging on the cell surface, a study combined AFM with confocal microscopy to directly penetrate the cell membrane and localize to the nucleus through the AFM tip to measure the elasticity of the nucleus . Obviously, this has become a hot spot of current AFM research and a trend of future AFM development. The combination and development of these technologies and functions have greatly enhanced the roles of traditional AFM, but the application of AFM still faces some challenges.
First, how to further improve the spatiotemporal resolution of AFM. At present, conventional AFM is only used to take static snapshots or very slow dynamic processes, because it takes up several minutes to acquire an image of each sample, which is far more than the time required for normal cellular physiological activities. Although high-speed atomic force microscopes with high temporal resolution in the subsecond range have been developed in recent years. However, due to the limitations of its high-speed imaging, this technique is currently only used for imaging small and relatively flat biological samples, such as single proteins and DNA molecules. But, for some large biological systems, the spatial resolution of AFM imaging becomes another challenge. For example, the resolution of current AFM imaging of mammalian cells is limited to 50–100 nm, which makes it impossible to observe the individual components of cell-surface machinery. The imaging resolution of microbial cells is slightly higher, but only about 10 nm. So, next, we should consider how AFM can maintain its high temporal resolution and high spatial resolution at the same time when imaging different biological samples.
Second, AFM is low throughput and labor intensive. Current AFM experiments are manual rather than automated. Meanwhile, the traditional AFM takes several minutes or even longer to process one sample, and the next one can only be processed after one sample is processed, which makes the entire operation very time-consuming and labor-intensive. In addition, when measuring the mechanical property changes during cell death based on the force-distance curve, it is usually necessary to measure and analyze thousands of force curves, which will undoubtedly further increase the time and labor consumption. In response to this problem, Chopinet et al. provide a novel modality called quantitative imaging™ (QI™), which overcomes the data processing problems associated with acquiring thousands of force curves . However, since this model has not yet been popularized, further researches are needed on related issues. Furthermore, the technical requirements for operators during AFM operation are very strict, especially for dynamic monitoring of living cells, which requires operators to have rich experience and good patience. Therefore, it is imminent to study the AFM of automated operation and simplified operation of data processing systems.
Finally, AFM does not need to be marked to be a double-edged sword. AFM does not need to mark the sample when observing the sample, which is one of the advantages of AFM. However, as the research system becomes more complex, this will turn into a weakness of AFM. For example, many proteins do not exhibit distinct morphologies, which are difficult to distinguish using AFM. Although the existing technology has been able to functionalize the AFM probe, using the tip with specific molecular modification to specifically recognize the sample molecule. However, this technique is complicated and time-consuming in the molecular modification process, the experimental process is difficult to standardize, and the damage to the tip is unavoidable . Therefore, further development of techniques that allow molecular-specific recognition by AFM is critical for imaging complex biological systems.
Generally speaking, the powerful functions exhibited by AFM make its research prospects in cell death immeasurable. However, as mentioned above, AFM still has many deficiencies in studying the physiological process of cells. Although some novel AFMs have been developed under the joint efforts of experts in multidisciplinary fields, the underlying problems remain unsolved. We expect a new and more powerful AFM that integrates multi-mode, multi-parameter, multi-frequency, and high-speed modes in the future. Coupled with the advancement of various complementary technologies, this will allow us to more clearly explore the unsolved problems of the cell death process and the entire field of biology.
# These authors contributed equally to this work and should be considered first co-authors.
Funding information: This work was supported by the National Natural Science Foundation of China (No. 82273998), the Ministry of Science and Technology of China (National Key R&D Program of China, 2021YFC3002203), and the Funding of Thinkingbiomed Biotechnology (Beijing) Co., Ltd (2022GKF-0667) to Prof. Yanhua Gong.
Author contributions: Ning Li: conception and design of study, investigation, visualization, writing – review and editing, supervision. Li Zhang: investigation, visualization, writing – original draft. Qiao Ou: visualization. Xinyue Wang: visualization. Linyan Xu: visualization. Yanhua Gong: conception and design of study, writing – review and editing, supervision, funding acquisition. All authors have accepted responsibility for the entire content of this manuscript and approved its submission.
Conflict of interest: The authors state no conflict of interest.
Design of an Azopolymer for Photo-Switchable Adhesive Applications
Design of an Azopolymer for Photo-Switchable Adhesive Applications
by David Siniscalco,Laurence Pessoni ,Anne Boussonnière ,Anne-Sophie Castanet ,Laurent Billon,Guillaume Vignaud and Nicolas Delorme
Coatings 2024, 14(3), 275; https://doi.org/10.3390/coatings14030275
Submission received: 19 January 2024 / Revised: 19 February 2024 / Accepted: 20 February 2024 / Published: 24 February 2024
Abstract
Significant research endeavors have been devoted to developing adhesives with reversible switching capabilities, allowing them to activate adhesion in response to diverse environmental stimuli. Among these, photo-switchable adhesives stand out as particularly promising. The presence of a photo-reversible solid-to-liquid transition, characterized by a transition temperature (TSL), in certain azobenzene-containing polymers offers a compelling avenue for creating such adhesives. The development of a method based on Atomic Force Microscopy to measure both the glass transition temperature (Tg) and TSL provided an opportunity to investigate the impact of various structural parameters on the solid-to-liquid transition of azopolymers. Our findings revealed that increasing the molecular weight (Mn) from 3400 to 8100 g/mol needed to achieve a highly cohesive adhesive resulted in an elevation in TSL (>10 °C), making the solid-to-liquid transition at room temperature more challenging. However, incorporating a highly flexible substituent at the para position of the azobenzene group proved effective in significantly reducing the TSL value (from 42 °C to 0 °C). This approach allows for the creation of photo-switchable adhesives with intriguing properties. We believe that our results establish a pathway toward developing a robust room-temperature photo-switchable adhesive.
1. Introduction
While advancements in adhesion technology have been noticeable in recent decades, creating materials with on-demand stickiness continues to pose a challenge. Extensive research efforts have been dedicated to the creation of switchable adhesives featuring an adjustable and reversible bonding–debonding process that can be activated in response to various environmental stimuli. Among them, light is regarded as a highly promising external stimulus due to its benefits, including athermal operation, precise control, and environmental friendliness. Despite advancements in switchable adhesives, enhancing adhesion strength and reusability remains a formidable challenge.
It is widely acknowledged that the three main properties for characterizing the nature of an adhesive are tack (initial adhesion), adhesion (interaction with the substrate), and cohesion (intermolecular interactions), which all depend on the thermo-mechanical properties of the polymeric material. Consequently, opting for materials capable of controlled solid–liquid phase transitions holds promise for the development of improved switchable adhesives. Because light can induce a reversible change in the mechanical properties of the material called a solid-to-liquid phase transition, azobenzene-functionalized polymers, the so-called azopolymers, generate a strong enthusiasm for elaboration of photo-switchable adhesives. Until recently, the characterization of the photo-reversible solid-to-liquid transition of azopolymer was made in almost all situations in a qualitative way. Typically, optical microscopy was used for bulk materials. While convenient, this method proves unsatisfactory for the precise determination of transition conditions. In a recent article, we demonstrated for the first time that the photo-reversible solid-to-liquid transition can be characterized by a transition temperature (TSL). By using a method based on Atomic Force Microscopy (AFM), this temperature can be accurately measured, allowing us to propose a mechanism for the photo-reversible solid-to-liquid transition.
In the present article, the AFM method is used to measure both TSL and Tg on thin coatings composed of various azopolymer architectures. By correlating the TSL value with the chemical structure of the azopolymer, we gain insights into the chemical parameters governing the photo-reversible solid–liquid transition. Based on these findings, the selection of an optimized azopolymer architecture for the formulation of a room-temperature photo-switchable adhesive is performed and its properties are tested.
2. Materials and Methods
2.1. Azopolymer Synthesis
To synthesize the different azopolymers, we used Nitroxide-Mediated Polymerization (NMP). All the azopolymers synthesis details and characterization can be found in . Size exclusion chromatography was used in THF as an eluent to check the molecular weight and the dispersity values of polymers. The chemical formula of azopolymers based on acrylate or the methacrylate polymerizable group and their main properties are presented in Table 1. Number-average molar mass (Mn) was calculated from a calibration derived from polystyrene standards. All the synthesized polymers present a dispersity between 1.2 and 1.3. Once purified, the polymers were kept in the dark at a low temperature (3 °C).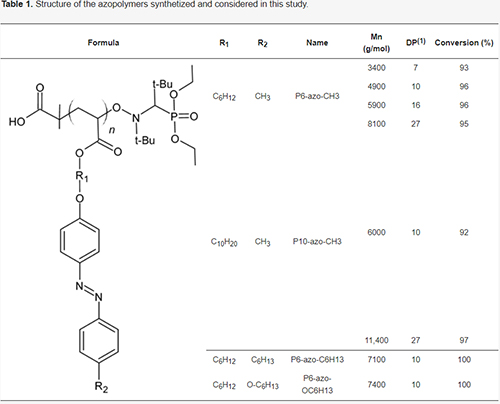
2.2. Azopolymer Coating
Azopolymer coatings were applied onto a meticulously cleaned microscopic glass slide. The cleaning procedure involved immersing the slide in a mixture of methanol and hydrochloric acid (in an equal volume ratio) for 30 min. Subsequently, the glass was thoroughly rinsed with ultrapure water, dried, and subjected to a 15-min treatment in a UV-ozone cleaner (Novascan PSD-UVT, Ames, IA, USA). For film preparation, a 10 g/L solution of azopolymer in dichloromethane (CH2Cl2) was slowly deposited onto a heated plate at 40 °C. The resulting films are homogeneous with a thickness ranging from 1 to 1.2 µm and an RMS roughness of 10 to 20 nm, as measured by AFM.
2.3. Atomic Force Microscopy (AFM)
AFM measurements were conducted using an Agilent 5500 equipped with an environmental chamber. Temperature control was achieved using a PID controller (Lakeshore-Westerville, OH, USA) coupled with a heating plate. Experiments covered a temperature ranging from −20 °C to 200 °C with an accuracy of 0.1 °C, facilitated by a Peltier and a heater stage. Stage temperature calibration was performed using different standard fusion point solids to cover the experimental temperature range. Force–distance measurements were obtained using CP-FM-SiO-B tips (NanoandMore, Paris, France) featuring a silica sphere (R = 3.5 µm). The spring constant, ranging from 0.5 to 1.2 N.m−1, depending on the tip, was determined using the thermal noise method. A calibrated z-close loop scanner (90 × 90 µm2) controlled the indentation depth and maximum load on films to prevent any deterioration. For each temperature, a 4 × 4 mapping on a 2 × 2 µm2 surface was generated, with each pixel averaging 10 force-distance curves acquired at 1 Hz. Pull-off force intensities, Young moduli (JKR model, Poisson ratio of 0.33), and uncertainties were extracted from these measurements using Atomic J. Relative pull-off force was calculated by dividing all the pull-off forces by the minimum pull-off force value.
2.4. Ellipsometry
Ellipsometry measurements were carried out using a Horiba spectroscopic ellipsometer. This instrument consists of a xenon source covering a wide spectral range from far infrared to ultraviolet (250–1700 nm), as well as a polarizer, an analyzer, and a monochromator responsible for managing dispersion and selecting wavelengths for a photomultiplier. The ellipsometer was equipped with a heating plate (LinKAM® TMS600—London, UK) to control thermal variations (30–145 °C) and transitions in the azopolymer films. Measurements for each sample were taken at 3 °C intervals between 25 and 106 °C, preceded by a 2-min equilibration period at a fixed temperature. The heating rate between the two measurements was set at 1°/min. To confirm the reproducibility of the measurements, at least three measurements were carried out on several samples. The thermal transitions of the trans isomer were assessed by introducing a UV filter (Longpass OD4—Edmund Optics, Villeurbane, France) that blocks UV radiation below 400 nm from the incident beam. This precautionary measure was taken to avoid any bias toward the cis state of the azopolymer. To analyze ellipsometry measurements, it is normally necessary to define a model representing the internal structure of the film in order to fit the curves. The limitations of this approach are that it can be difficult to define the most appropriate model, for example, the number of layers needed to perfectly describe the film morphology, etc. The choice of model can influence the adjustments and, therefore, the results obtained. Another analysis method consists of observing the behavior of the raw data as a function of temperature, without modeling and adjustment. In this way, it is possible to detect transitions that would be less visible by choosing a model.
2.5. Adhesion Strength Measurement
Initially, two polycarbonate (PC) substrates, measuring 20 mm in length, 10 mm in width, and 3 mm in thickness, were manually polished for 15 s using 400 mesh sandpapers (resulting in RMS roughness = 100 nm). Subsequently, they were washed with ethanol and allowed to air dry. Next, approximately 1–2 mg of the selected azopolymer was placed on the rough surface of one PC substrate, followed by exposure to UV irradiation for 30 s (365 nm, 300 mW.cm−2). This UV treatment aimed to reach the TSL of the azopolymer, ensuring it became fully molten. Afterward, another rough-surfaced PC substrate was manually pressed onto the molten azopolymer for 30 s. Upon cooling to room temperature, an azopolymer specimen was obtained with an approximate bonding area of 100 mm2. Subsequently, the specimen was affixed to the grips of a universal tensile test machine (Mecmesin®-, London, UK) and subjected to stretching at a rate of 2 mm.min−1 to generate the force–elongation curve.
2.6. Reversible Bonding–Debonding Experiment
Polyethylene Naphthalate (PEN), Polycarbonate (PC), and Polyethylene Terephthalate (PET) strips with dimensions of 10 cm (length) × 5 mm (width) × 0.3 mm (thickness) were used. First, 1–2 mg of azopolymer was placed on one end of the strip. After 2 min of UV irradiation, the azopolymer was molten and was then glued (by thumb pressure for 30 s) with the other end of the stripe to acquire a ring. The ring was again submitted to UV light (365 nm, 300 mW.cm−2) for the debonding process.
3. Results
3.1. Measurement of Tg and TSL
The comprehensive experimental methodology for measuring TSL on the azopolymer coating has been thoroughly elucidated in earlier publications. In summary, by performing pull-off force measurement between the AFM tip and the surface of an azopolymer coating as a function of the film temperature, different transition temperatures can be detected. As seen in Figure 1a for P6-azo-CH3 azopolymer (Mn = 8100 g/mol), the glass temperature transition (Tg) for both trans (Tg(trans) = 54(2) °C) and cis (Tg(cis) = 32(2) °C) isomers are identified as the first slope breakage of the pull-off force vs. the temperature curve. We also demonstrated in our previous articles that the position of the maximum pull-off force (i.e., Tmax) corresponds to a solid-like to liquid-like transition [17,20]. For P6-azo-CH3 azopolymer with Mn = 8100 g/mol, we measured Tmax(trans) = 90(2)° and Tmax(cis) = 42(2) °C.
All these temperature transitions were also detected on azopolymer coatings by multiwavelength ellipsometry. Figure 1b shows the quantity IS extracted from the output signal by harmonic analysis (synchronous detection at the modulator frequency) and related to the ellipsometric angles. Its behavior as a function of temperature is entirely consistent with the AFM measurements. These earlier investigations have contributed to the understanding of the photo-reversible solid-to-liquid transition mechanism. As shown in Figure 1b, the trans-to-cis isomerization of the azopolymer coating by UV irradiation is not sufficient to reach the solid-to-liquid transition. A greater irradiation intensity (or external heating) is required to surpass Tmax(cis). Reversibility is achieved either through storage of the material in the dark or exposure to green light irradiation. Consequently, TSL and Tmax(cis) represent the same transition temperature. With the ability to accurately measure Tg and TSL, we are able to study the influence of the polymer architecture on the photo-reversible solid-to-liquid transition.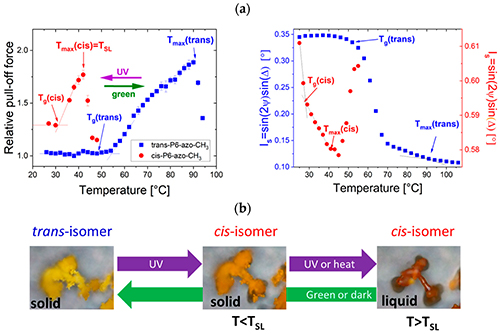
Figure 1. (a) (left) Relative pull-off force vs. the temperature curve and (right) raw ellipsometry data vs. temperature at an energy of 1.2 eV, for trans- and cis-P6-azo-CH3 (Mn = 8100 g/mol) (for the cis experiment, irradiation with a UV lamp: λmax = 365 nm, Ee = 300 mW.cm−2, t = 30 s). (b) Optical microscopy images (350 µm × 264 µm) of P6-azo-CH3 grains as a function of the irradiation and temperature conditions.
3.2. Influence of Azopolymer Chain Length
In 2020, Chen et al. synthesized azopolymers with the same chemical structure as P6-azo-CH3. They measured an increase in Tg(trans) from 48 to 80 °C for a molecular weight (Mn) from 5000 to 100,000 g/mol . In this work, pull-off force vs. temperature experiments were performed on P6-azo-CH3 with Mn = 3400 to 8100 g/mol in order to measure the evolution of both Tg and TSL with Mn. The extracted Tg and TSL values from the pull-off force vs. temperature curves are plotted as a function of Mn in Figure 2. At first, it can be seen that Tg(trans) is always measured above Tg(cis). This may be explained by the conformation of the azomolecule substituent. Indeed, the trans-to-cis photo-isomerization leads to a modification of the geometry of the azomolecule substituent, which passes from a rod-like shape favoring good packing with adjacent azomolecules to a banana-like shape increasing the free volume of the polymer material. Although the measured Tg(trans) values of the P6-azo-CH3 azopolymers are in agreement with those measured by Chen et al., here, we demonstrate that both Tg(trans) and Tg(cis) increase with Mn. This evolution, expected for linear polymers with low Mn, follows the Fox–Flory equation, is a parameter that can be associated with the glass transition for an infinity high Mn and K is a material dependent parameter. The fitting parameters are available in and show a similar K parameter (K~72,000–73,000 g/mol) for both the trans and cis isomers, which is closed from the calculated critical entanglement molecular weight (i.e., Mc = 68,000 g/mol) for this azopolymer. Finally, we can observe that for this polymer architecture, whereas Tmax(trans) increases with Mn, TSL seems to saturate for Mn greater than 5000 g/mol. At present, the absence of theoretical work concerning the solid-to-liquid transition hinders drawing any definitive conclusions about this evolution.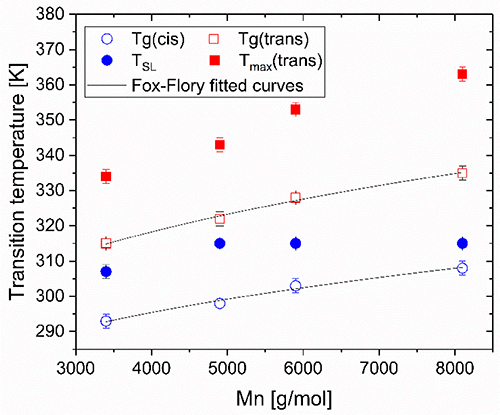
Figure 2. Evolution of Tg and TSL measured by AFM for both the trans and cis isomers as a function of the molecular mass of the P6-azo-CH3 azopolymers.
3.3. Influence of the Alkyl Length Ligand
For acrylate azopolymers, Weiss et al. observed that the solid-to-liquid transition is impacted by the alkyl spacer length since the transition was only observed for n = 6 and n = 12 (with n the number of carbon atoms). Here, we compare azopolymers with alkyl spacer lengths of n = 6 (P6-azo-CH3) and n = 10 (P10-azo-CH3) with two different Mn.
When comparing azopolymers with different linker lengths but similar Mn, it can be seen (Table 2) on one side that Tg(trans) and Tmax(trans) are close and thus fairly impacted by the linker length. On the other side, an increase in the linker length leads to a strong decrease (ΔT < −20 °C) of both Tg(cis) and TSL. For a similar Mn (i.e., 8600 g/mol), Weis measured Tg(cis) = −14 °C on powder for the n = 12 linker, which is in agreement with the evolution observed here. These results may indicate that the linker length has a stronger impact on the thermo-mechanical properties of the cis form than on those of the trans form. The molecule packing of the trans rod-like shape azomolecule may be fairly impacted by the linker length, whereas in the cis conformation, the banana shape with a higher linker length may create a consequent excess of free volume and thus a strong decrease in the transition temperatures.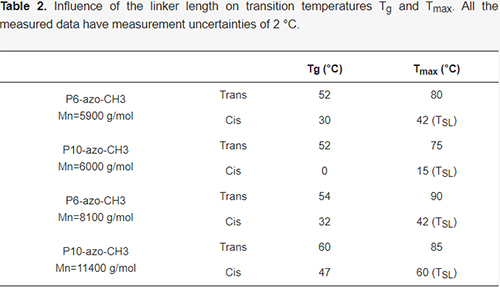
Table 2. Influence of the linker length on transition temperatures Tg and Tmax. All the measured data have measurement uncertainties of 2 °C.
3.4. Influence of the Substituent Nature
In order to study the influence of the azobenzene chemical structure, we compared the values of Tg and TSL for three azopolymers, namely, (P6-azo-CH3, P6-azo-C6H13, and P6-azo-OC6H13). These azopolymers have similar Mn and the same alkyl linker length (n = 6) but a different substituent on the para position of the azobenzene group.
When comparing P6-azo-CH3 and P6-azo-C6H13 (Table 3), we can see that the increase in the alkyl tail of the substituent leads to a net decrease in all the transition temperatures. Our results agree with the work of Liang et al, who measured Tg(trans) = 68 °C and Tg(cis) = −27 °C for n = 10, and with Li et al., who studied the effect of substituents length on the transition temperature of alkyl on poly(n-alkyl-acrylate) polymer and demonstrated that Tg decreases with the substituent length, reflecting the greater side chain mobilities of long alkyl substituents.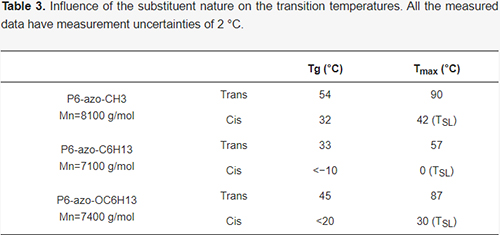
Table 3. Influence of the substituent nature on the transition temperatures. All the measured data have measurement uncertainties of 2 °C.
Whereas P6-azo-C6H13 and P6-azo-OC6H13 have comparable substituent lengths, they show different behavior. Indeed, both the Tg and Tmax transition temperatures of P6-azo-OC6H13 are much higher. Compared with P6-azo-C6H13, the presence of the oxygen group in P6-azo-OC6H13 may, via a mesomeric effect with the azobenzene group, lead to a higher rigidity of the substituent. This loss of flexibility may explain the observed increase in both Tg and Tmax. This outcome illustrates that the crucial factor in adjusting TSL may not be the length of the substituent but rather its flexibility.
3.5. Photo-Switchable Adhesive
Hot melt adhesives (HMAs) are widely used in the industry because they are solvent-free, they form a strong bond quickly, simply by cooling, are compatible with most materials, and are clean and easy to handle. Such adhesives undergo a phase transition into a liquid state when heated, facilitating their application between two substrates. Upon cooling, the adhesive solidifies via physical crosslinks and creates a bond between the substrates. For photo-switchable adhesives, the goal is to replace the heating/cooling step of the HMA with light irradiation. As a consequence, a good candidate should present (1) a temperature of solid–liquid transition (TSL) slightly above the operating temperature. This is essential because, during the bonding process, the liquid form can be rapidly achieved using moderate UV irradiation. Subsequently, reversible debonding can be accomplished by UV irradiation of the assembly (cis liquid form and loss of adhesive cohesion). (2) The glass transition temperature of the trans state (Tg trans) should surpass the operating temperature, and (3) Mn should be high. These two last conditions ensure that after the bonding process, a solid form can be attained with thermal cis-to-trans isomerization and that physical crosslink may append both enhancing the cohesion of the adhesive. As a consequence, in order to prepare an adhesive with an operating temperature of 20 °C, the selected formulation should fulfill the following conditions: (1) TSL ≤ 35 °C; (2) Tg(trans) > 20 °C; and (3) high Mn. Even if high Mn azopolymers could not be obtained in this study, among the synthesized azopolymers, only two fulfill these conditions: P6-azo-C6H13 and P6-azo-OC6H13.
At first, the adhesion strengths were investigated by lap shear strength tests using polycarbonate substrates to determine the best adhesive candidate. The stress−strain curves of P6-azo-C6H13 and P6-azo-OC6H13 are shown in Figure 3. The bonding shear strengths of the two adhesives were 3.3 MPa and 6.1 MPa, respectively. Even though the absolute values of adhesive strength have to be taken with caution because they are related to the condition of the bonded substrate, the measured values are comparable with the ones measured by Lee et al. and are higher than Li et al.. It is clear that P6-azo-OC6H13 shows a higher adhesive strength than P6-azo-C6H13 in the trans state. This can be explained by the difference in Tg(trans). Indeed, the Tg(trans) of P6-azo-C6H13 is lower than the Tg(trans) of P6-azo-OC6H13 and much closer to the ambient temperature. As a result, the mechanical properties at 20 °C (i.e., modulus, cohesive energy…) of P6-azo-C6H13 are lower than P6-azo-OC6H13.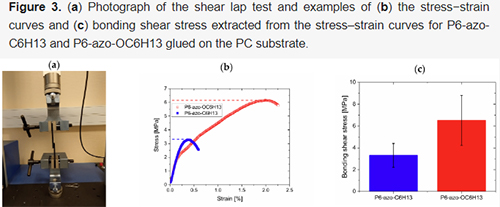
Figure 3. (a) Photograph of the shear lap test and examples of (b) the stress−strain curves and (c) bonding shear stress extracted from the stress–strain curves for P6-azo-C6H13 and P6-azo-OC6H13 glued on the PC substrate.
Based on the good adhesive strength of the two candidates, the reversible opening and closing of a plastic ring were successfully achieved (Figure 4). After the deposition of azopolymer powder on one end of the strip, the powder was UV irradiated for 30 s (365 nm, 100 mW.cm−2) in order to cause the trans–cis isomerization and the reaching of TSL where the solid-to-liquid transition occurs. The polymer strip was then pressed end-to-end under room light to acquire a ring. We checked that the pressing time of t = 30 s was enough for the back cis–trans isomerization to proceed. Debonding of the ring can be performed upon UV irradiation, where the ring opens within 30 s. The opening and closing of the ring could be reversibly achieved when the adhesive position was exposed to alternating UV and pressure. Different polymer film substrates were tested as a ring strip either with P6-azo-OC6H13 or P6-azo-C6H13 glue. To compare the different assemblies, the time for the ring to self-debond when kept at room temperature was measured. The results presented in Figure 4b show that whatever the substrate, P6-azo-OC6H13 is a stronger adhesive than P6-azo-C6H13, indicating that P6-azo-OC6H13 seems to be a good candidate for a photo-switchable adhesive.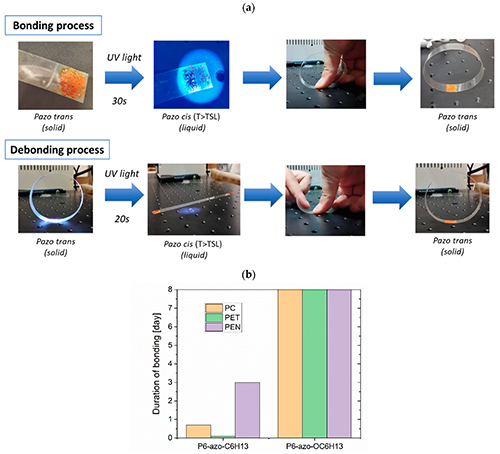
Figure 4. (a) Schematic illustration and photographs showing the light-induced reversible opening and closing of a polymer ring glued with the P6-azo-OC6H13 azopolymer. (b) Duration of bonding of the ring glued with either P6-azo-C6H13 or P6-azo-OC6H13 when rings are kept at room temperature for a total duration of 8 days.
4. Conclusions
In summary, the possibility of using the pull-off force vs. temperature method to measure both Tg and TSL gave us the opportunity to study the effect of different structural parameters on the solid-to-liquid transition of azopolymers. Our study has demonstrated that the increase in Mn needed to have high cohesive adhesive led to an increase in TSL, rendering the solid-to-liquid transition more difficult to access. However, the use of a highly flexible substituent on the para position of the azobenzene group gives the opportunity to strongly decrease the value of TSL and obtain photo-switchable adhesives with interesting properties. Upon alternating UV light exposure, the adhesive showed reversible debonding and bonding, which was applicable to various substrates. The result indicates that P6-azo-OC6H13 had superior adhesive performance and reusability, which may be applicable in the near future. We believe that our results pave the way for the route toward a robust photo-switchable adhesive.
Supplementary Materials
The following supporting information can be downloaded at: https://www.mdpi.com/article/10.3390/coatings14030275/s1, Figure S1: Optical profilometry image of the surface of the P6-azo-CH3 (Mn = 5900 g/mol) coating; Figure S2: UV–visible absorption spectrum for a film of trans-P6-azo-CH3 (Mn = 8100 g/mol) before and after UV irradiation (λmax = 365 nm, Ee = 300 mW.cm−2) and after keeping the film in the dark for 10 h; Figure S3: Relative pull-off force vs. temperature curves for both trans and cis-P6-azo-CH3 for Mn = 3400, 4900, 5900, and 8100 g/mol; Table S1: Fox Flory equation and resulting fitting parameters for the variation in Tg with Mn of both trans and cis P6-azo-CH3; Figure S4: Relative pull-off force vs. temperature curves for both trans and cis-P10-azo-CH3 for Mn = 6000 and 11,400 g/mol; Figure S5: Relative pull-off force vs. temperature curves for both trans and cis-P6-azo-C6H13 and P6-azo-OC6H13.
Author Contributions
AFM measurements and analysis, writing, and reviewing, D.S.; polymer synthesis and reviewing, L.P. and L.B.; azomolecules synthesis and reviewing, A.B. and A.-S.C.; ellipsometry, thin films, and reviewing, G.V.; AFM analysis, writing, reviewing, and funding, N.D. All authors have read and agreed to the published version of this manuscript.
Funding
This research was funded by ANR, ANR-20-CE06−0014.
Data Availability Statement
The data that support the findings of this study are available from the corresponding author, upon reasonable request.
Acknowledgments
The authors acknowledge the trainee Gustave Strubel (IUT Le Mans) for the bonding-detachment experiments, Constance Fleurant (Master of chemistry—Le Mans University) for the characterization of the azopolymers, and Mehdi Oujanba (Master of physics—Le Mans University) for the ellipsometry measurements.
Conflicts of Interest
The authors declare no conflicts of interest. The funders had no role in the design of this study; in the collection, analyses, or interpretation of data; in the writing of this manuscript; or in the decision to publish the results.
Biphasic regulation of epigenetic state by matrix stiffness during cell reprogramming
Yang Song, Jennifer Soto, Sze Yue Wong, Yifan Wu, Tyler Hoffman, Navied Akhtar, Sam Norris, Julia Chu, Hyungju Park, Douglas O. Kelkhoff, Cheen Euong Ang, Marius Wernig, Andrea Kasko, Timothy L. Downing, Mu-ming Poo, and Song Li
Science Advances,14 Feb 2024, Vol 10, Issue 7. DOI: 10.1126/sciadv.adk0639
Abstract
We investigate how matrix stiffness regulates chromatin reorganization and cell reprogramming and find that matrix stiffness acts as a biphasic regulator of epigenetic state and fibroblast-to-neuron conversion efficiency, maximized at an intermediate stiffness of 20 kPa. ATAC sequencing analysis shows the same trend of chromatin accessibility to neuronal genes at these stiffness levels. Concurrently, we observe peak levels of histone acetylation and histone acetyltransferase (HAT) activity in the nucleus on 20 kPa matrices, and inhibiting HAT activity abolishes matrix stiffness effects. G-actin and cofilin, the cotransporters shuttling HAT into the nucleus, rises with decreasing matrix stiffness; however, reduced importin-9 on soft matrices limits nuclear transport. These two factors result in a biphasic regulation of HAT transport into nucleus, which is directly demonstrated on matrices with dynamically tunable stiffness. Our findings unravel a mechanism of the mechano-epigenetic regulation that is valuable for cell engineering in disease modeling and regenerative medicine applications.
INTRODUCTION
Biophysical factors such as the mechanical property and microtopography of cell adhesive substrates have been shown to regulate a variety of cellular functions such as migration, proliferation, and differentiation, which, in turn, can modulate wound healing, tissue remodeling, and tumor growth. There is also accumulative evidence that biophysical cues can be engineered to improve cell reprogramming efficiency, as exemplified by the effects of micro/nanotopography and nuclear deformation on the conversion of fibroblasts into induced neuronal (iN) cells. However, how matrix stiffness regulates the epigenetic state during cell reprogramming is not well understood. A better understanding of the epigenetic changes that occur during cell reprogramming in response to matrix stiffness would enable the engineering of biomaterials that can promote cell reprogramming, with the derived cells offering great potential for disease modeling, drug discovery, and tissue engineering applications.
Cell reprogramming involves extensive epigenetic changes to activate lineage-specific genes in heterochromatin and reorganize the chromatin structure, which is essential to change the cell memory and identity. Although the roles of biological and chemical factors in epigenetic changes during cell reprogramming have the widely studied, the effects of biophysical cues on cell reprogramming and the mechanotransduction to the nucleus are less well understood. While recent studies have reported the effects of stiff and soft matrix on epigenetic changes in various cell types, the mechanotransduction mechanism from cell surface to nucleus is not clear. The actin cytoskeleton plays an important role in sensing and transducing extracellular biophysical signals to modulate intracellular signaling and cell functions. Actin filaments can transmit mechanical signals to the nucleus to modulate gene expression and chromatin organization. On the other hand, actin polymerization/depolymerization can regulate G-actin–mediated transport of transcriptional factors such as myocardin-related transcription factor (MRTF) into the nucleus, and actin force generation has been reported to modulate nuclear pore size and Yes-associated protein (YAP) translocation. However, whether the transport of epigenetic enzymes that modulate histone acetylation, histone methylation, and DNA methylation is regulated by mechanisms similar to these transcriptional factors remains to be determined. Moreover, most studies of stiffness effects assume that stiffness regulation of cell functions are monotonic, leading to the simplification of experiments to compare two conditions (stiff versus soft) as representatives, which awaits further investigations.
In this study, we investigated the effect of matrix stiffness on the epigenetic state during iN reprograming by using polyacrylamide (PAAm) hydrogels, which are composed of a crosslinked acrylamide network where the stiffness of the hydrogel can be tuned by adjusting the amount of bis-acrylamide crosslinker and the acrylamide monomers during fabrication. In addition, PAAm hydrogels offer several advantages such as these hydrogels are easy to fabricate, biologically inert, allow for precise control and tuning of the stiffness during fabrication, offer a range of stiffness that covers most soft tissues, and have been extensively used by many researchers to study the effect of matrix stiffness on cell functions. We reveal a role of matrix stiffness as a biphasic (instead of monotonic) regulator of epigenetic state and cell reprogramming through actin-mediated histone acetyltransferase (HAT) translocation into the nucleus, with the highest iN reprogramming at an intermediate stiffness, which is distinguishable from the soft surface known to facilitate neural differentiation.
RESULTS
Matrix stiffness enhances iN reprogramming efficiency in a biphasic manner
To investigate the role of matrix stiffness on iN reprogramming, adult mouse fibroblasts were transduced with doxycycline-inducible lentiviruses containing the three reprogramming factors Ascl1, Brn2, and Myt1l (BAM) and then seeded onto fibronectin-coated PAAm gels of various stiffness (40, 20, and 1 kPa) that mimic the physiological stiffness of the microenvironment where fibroblasts and neuronal cells typically reside in vivo (Fig. 1A). In addition, this stiffness range has been reported to regulate various cell functions and can be used to engineer cell behavior and reprogramming ex vivo. Glass coverslips coated with the same extracellular matrix (ECM) protein were used as a rigid surface control. We first confirmed that elastic modulus of the PAAm gels was in the desired range and found no major difference in the structural features or pore size of the gels upon examination with scanning electron microscopy. These substrates were nontoxic as there were no detrimental effects on cell viability when fibroblasts were cultured on the various surfaces. As shown in figs. S4 to S7, both the cell spreading area and nuclear volume of fibroblasts decreased with the stiffness of the PAAm gel, which appeared to correlate with a decrease in focal adhesions, e.g., paxillin-positive puncta. After fibroblasts were seeded on PAAm gels for 48 hours, the number of cells in the S phase of the cell cycle also decreased with matrix stiffness. These results suggest that matrix stiffness significantly affects fibroblast spreading and proliferation.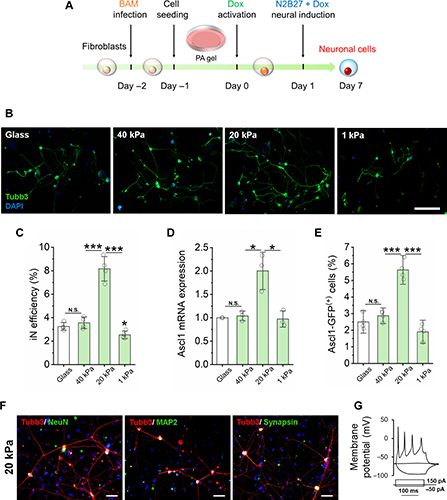
Fig. 1. Substrate stiffness-induced biphasic enhancement of iN reprogramming efficiency.
(A) Experimental timeline for substrate stiffness-induced iN reprogramming. (B) Immunofluorescent mages of Tubb3+ iN cells derived on glass or PAAm gels of varying stiffness on day 7. Scale bar, 200 μm. DAPI, 4′,6-diamidino-2-phenylindole. (C) Reprogramming efficiency of BAM-transduced fibroblasts that were cultured on glass and PAAm gels of varying stiffness (n = 4 independently prepared gel surfaces). On day 7, the cells were fixed and stained for Tubb3, followed by immunofluorescence microscopy to quantify Tubb3+ iN cells. (D) Relative Ascl1 mRNA expression in BAM-transduced fibroblasts seeded on glass and PAAm gels of varying stiffness at day 1 following Dox activation (n = 3). (E) Fibroblasts transduced with BAM and an Ascl1 promoter–GFP construct were seeded on glass and PAAm gels of varying stiffness for 24 hours and activated by Dox for another 24 hours. The cells were fixed and observed by immunofluorescence microscopy, showing that 20-kPa PAAm gel induced more Ascl1 promoter–GFP+ cells at day 1, as quantified in the bar graph (n = 3). (F) Representative images of Tubb3+ cells expressing mature neuronal markers, NeuN, MAP2, and synapsin at 21 days after cells were cultured on 20-kPa gels. Scale bars, 100 μm. (G) Representative trace showing spontaneous changes in membrane potential in response to current injection from iNs derived on 20-kPa gels. In (C) to (E), statistical significance was determined by a one-way analysis of variance (ANOVA) and Tukey’s multiple comparison test (N.S.: not significant, *P ≤ 0.05 and ***P ≤ 0.001). In (C) to (E), bar graphs show means ± SD.
To determine the effect of matrix stiffness on the direct conversion of fibroblasts into neurons, BAM-transduced fibroblasts were cultured on glass and PAAm gels of varying stiffness. After 7 days, cultures were fixed and immunostained for neuronal marker, neuron-specific class III β-tubulin (Tubb3) to identify iN cells and determine the reprogramming efficiency by counting Tubb3+ cells with a neuronal morphology (Fig. 1, A and B). Matrices of intermediate stiffness at 20 kPa significantly enhanced the reprogramming efficiency, while stiffer (40 kPa, glass) or softer (1 kPa) surfaces had modest effects (Fig. 1C). In addition, this biphasic enhancement of iN conversion at the intermediate stiffness is independent of ECM protein components (Fig. 1C). Intermediate stiffness (~20 kPa) significantly enhanced the mRNA level of pioneer factor Ascl1 compared to glass, 40- and 1-kPa gels (Fig. 1D). To determine whether matrix stiffness could modulate the activation of endogenous Ascl1, fibroblasts were transduced with an Ascl1 promoter–driven green fluorescent protein (GFP) construct and reprogrammed for 2 days. We found a significant increase in the number of Ascl1 promoter–GFP+ cells in the intermediate stiffness group compared to glass and other stiffness groups (Fig. 1E). Further characterization of the derived cells by immunostaining and electrophysiology (patch clamp) analysis revealed that mature iN cells were obtained on PAAm gels with various stiffness (Fig. 1, F and G). Higher density of iN cells on 20 kPa surfaces also resulted in higher frequency of spontaneous excitatory postsynaptic currents (sEPSCs). Together, these results suggest that an intermediate matrix stiffness promotes endogenous Ascl1 expression that may enhance iN reprogramming.
Intermediate stiffness increases chromatin accessibility and histone acetylation for iN conversion
We postulated that matrix stiffness modulated the epigenetic state and, thus, the reprogramming process. To directly determine whether matrix stiffness altered chromatin accessibility, we performed assay of transposase accessible chromatin sequencing (ATAC-seq) in fibroblast in the absence of BAM reprogramming factors and found that cells on matrices with different stiffness (1 kPa, 20 kPa, and glass) had distinguishable chromatin accessibility regions (Fig. 2A). Principal components analysis indicated that the independent samples of fibroblasts cultured on the same stiffness were similar as they were clustered together. Moreover, the genomic distribution of ATAC peaks across the conditions tested were similar, with most of the peaks corresponding to promoter, intron, and distal intergenic regions. Soft surfaces (20 and 1 kPa) increased the percentage of peaks annotated to promoter regions compared to stiff (glass) substrates. Volcano plots showed that an intermediate stiffness of 20 kPa increased chromatin accessibility at numerous genomic loci when compared to 1 kPa and glass, respectively (Fig. 2A). In addition, although the intermediate matrix stiffness of 20 kPa could decrease the accessibility of certain regions when compared to glass, there appeared to be less reduction in chromatin accessibility compared to soft surfaces (Fig. 2A). To determine how these accessibility differences might be relevant to iN reprogramming, we integrated our ATAC-seq results with previously published Ascl1 chromatin immunoprecipitation sequencing (ChIP-seq) data and found that soft surfaces (both 20 and 1 kPa) increased the accessibility of genomic regions of Ascl1-target genes (Fig. 2B); in comparison to 1 kPa and stiff surfaces, the intermediate stiffness of 20 kPa had the highest accessibility at the promoter regions of these neuronal genes (Fig. 2B).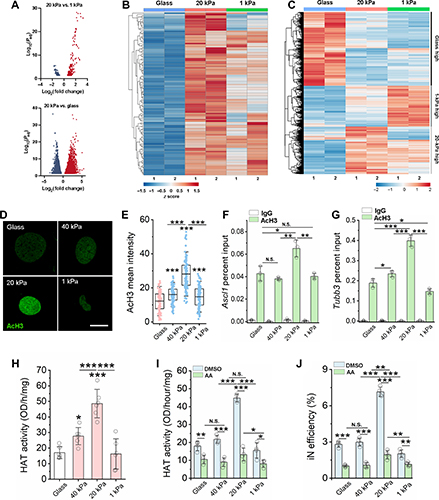
Fig. 2. Matrix stiffness modulates chromatin accessibility, gene expression, HAT activity, and histone acetylation.
(A) Volcano plot showing differential accessible regions. Red and blue dots indicate regions with increased or decreased chromatin accessibility, respectively. (B) Heatmap representation of differentially accessible regions that overlap with Ascl1 ChIP-seq peaks (GSE43916: SRX323557). Each row represents a differential region; each column is one biological replicate of the indicated condition. (C) Heatmap representation of differentially expressed genes at day 3. (D) Immunofluorescent images of AcH3 in non-transduced fibroblasts at day 2. Scale bar, 10 μm. (E) Quantification of AcH3 intensity based on experiments in (A) (n ≥ 116). (F and G) ChIP-qPCR analysis shows the percent input of AcH3 at the promoter regions of Ascl1 (F) and Tubb3 (G) in BAM-transduced fibroblasts at day 3 (n = 3). (H) Quantification of HAT activity at day 2 (n = 6). (I) Quantification of HAT activity in fibroblasts cultured on various substrates for 1 day followed by treatment with vehicle control [dimethyl sulfoxide (DMSO)] or a HAT inhibitor [anacardic acid (AA)] for 24 hours (n = 4). (J) Reprogramming efficiency of BAM-transduced fibroblasts cultured on matrices of varying stiffness and pre-treated with anacardic acid for 24 hours before adding Dox (n = 4). In (E) to (J), statistical significance was determined by a one-way ANOVA and Tukey’s multiple comparison test (*P ≤ 0.05, **P ≤ 0.01, and ***P ≤ 0.001). In (E), box plots show the ends at the quartiles, the mean as a horizontal line in the box, and the whiskers represent the SD. In (F) to (J), bar graphs show means ± SD.
To determine whether matrix stiffness altered gene expression in the absence of BAM reprogramming factors, we performed bulk RNA sequencing and found that cells on matrices of varying stiffness (glass, 20 kPa, and 1 kPa) had discernible gene expression patterns (Fig. 2C). We found that different subsets of genes had highest expression levels on surfaces with different stiffness (Fig. 2C). Gene Ontology (GO) analysis revealed that an intermediate stiffness of 20 kPa could promote genes related to synapse organization and axonogenesis, which was not evident for glass or 1-kPa samples. On the other hand, a stiff surface (glass) enhances cell cycle genes and actin-related genes. It is worth noting that many of these changes of gene expression are related to the regulation of genes in euchromatin and may not be attributed to epigenetic changes. It is possible that both the gene expression changes and epigenetic changes may contribute to the reprogramming process when BAM are introduced.
Previous studies have reported that epigenetic modifications, such as histone methylation, histone acetylation, and DNA methylation, regulate chromatin accessibility and play an important role in cell reprogramming. To determine whether matrix stiffness may modulate iN reprogramming through global histone modifications, we performed immunostaining of euchromatin marks histone H3 acetylation (AcH3), histone H4 acetylation (AcH4), acetylated histone H3 on lysine-27 (H3K27ac), and tri-methylated histone H3 on lysine-4 (H3K4me3), and heterochromatin marks tri-methylated histone H3 on lysine-9 (H3K9me3), tri-methylated histone H3 on lysine-27 (H3K27me3), and tri-methylated histone H4 on lysine-20 (H4K20me3) in nontransduced fibroblasts cultured on gels of various stiffness. As shown in Fig. 2 (D and E) and fig. S17, an intermediate stiffness of 20 kPa induced higher AcH3 and AcH4 levels compared to stiffer and softer surfaces. On the other hand, no change was apparent in heterochromatin and other euchromatin marks examined. These results suggest that an intermediate stiffness may induce a more open chromatin structure via AcH3 to facilitate cell reprogramming.
To determine whether there is an increase of AcH3 at the promoter of neuronal genes, we performed ChIP–quantitative polymerase chain reaction (qPCR) at day 3 and found an increase in AcH3 at the promoter regions of Ascl1 and Tubb3 in cells on 20-kPa surface, suggesting that an intermediate matrix stiffness can promote neuronal gene expression by modulating site-specific epigenetic changes (Fig. 2, F and G).
HAT mediates matrix stiffness-modulated AcH3
HATs are chromatin-modifying enzymes that regulate the acetylation of histone proteins, resulting in a loosely packed chromatin structure that allows for the binding of transcription factors. To elucidate how intermediate matrix stiffness promotes a more open chromatin state, we analyzed the activity of HAT in fibroblasts cultured on PAAm of varying stiffness for 2 days. Quantification of HAT activity revealed that gels of intermediate stiffness increased HAT activity compared to stiffer and soft surfaces (Fig. 2H). On the other hand, the activity of histone deacetylase (HDAC) in fibroblasts increased monotonically with the decrease of matrix stiffness. In addition, fibroblasts cultured on glass had significantly higher DNA methylation levels than cells cultured on PAAm gels with varying stiffness. We then used chemical inhibitors to test the relative contributions of these epigenetic regulators to iN conversion. Inhibition of HAT activity by anacardic acid inhibited the biphasic enhancement of HAT activity and the reprogramming efficiency (Fig. 2, I and J). However, inhibition of HDAC activity by valproic acid (VPA) only slightly increased HAT activity and iN conversion efficiency of fibroblasts cultured on stiff gels (40 kPa) and glass but had no effect on cells cultured on soft and intermediate stiffness gels. Furthermore, inhibition of H3K9 and DNA methyltransferase activity using Bix01294 and RG108, respectively, had no notable effect on the biphasic enhancement in cell reprogramming. These results suggest that HATs play a major role in matrix stiffness-enhanced iN conversion.
Actin polymerization mediates the effect of matrix stiffness on HAT translocation into nucleus
There is accumulating evidence that biophysical signals can be transmitted through the actin cytoskeleton to the nucleus to elicit changes in gene expression; in addition, actin polymerization/depolymerization can regulate G-actin–mediated transport of transcriptional factors into the nucleus. To determine whether actin plays a role in intermediate stiffness-mediated HAT activity, HAT1, a specific type of HAT, was costained with F-actin and β-actin, respectively. As shown in Fig. 3A, cells cultured on soft surfaces had less polymerized actin (F-actin). HAT1 and β-actin had a pronounced nuclear colocalization when cells were cultured on 20-kPa gels (Fig. 3A), suggesting that substrate stiffness modulates the nuclear translocation of actin and HAT1. Western blotting analysis of G-actin and F-actin content showed that F-actin decreased with matrix stiffness, whereas the opposite trend was observed for G-actin (Fig. 3, B and C), which could make more actin monomer available for nuclear translocation on soft surfaces.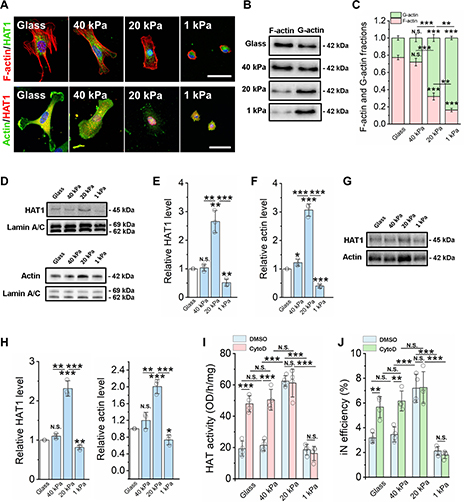
Fig. 3. Matrix stiffness modulates the nuclear translocation of HAT via actin assembly.
(A) Immunofluorescent images of fibroblasts cultured on glass and PAAm gels of various stiffness for 2 days and stained for F-actin (phalloidin, red), HAT1, and β-actin (green). Scale bars, 50 μm. (B) Western blotting analysis shows F-actin and G-actin levels in fibroblasts cultured on glass and PAAm gels for 2 days. (C) Quantification of F-actin and G-actin fractions from Western blots (n = 3). (D) Western blotting analysis shows HAT1 and β-actin levels from nuclear fractions of fibroblasts cultured on glass and PAAm gels of varying stiffness for 2 days, where lamin A/C serves as a housekeeping protein. (E) Quantification of HAT1 level from Western blots (n = 3). (F) Quantification of actin level from Western blots (n = 3). (G) Co-immunoprecipitation of HAT1 and actin from nuclear fractions of fibroblasts on glass or varying matrix stiffness. (H) Quantification of HAT1 and actin levels from co-immunoprecipitation Western blot (n = 3). (I) Quantification of HAT activity in fibroblasts cultured on various substrates for 1 day, followed by treatment with vehicle control (DMSO) or an actin polymerization inhibitor [cytochalasin D (CytoD); 0.5 μM] for 24 hours (n = 4). (J) Reprogramming efficiency of BAM-transduced fibroblasts cultured on various substrates and pretreated with cytochalasin D (0.5 μM) for 24 hours before adding Dox (n = 4). In (C), (E), (F) and (H) to (J), statistical significance was determined by a one-way ANOVA and Tukey’s multiple comparison test (*P ≤ 0.05, **P ≤ 0.01, and ***P ≤ 0.001). In (C), (E), (F) and (H) to (J), bar graphs show means ± SD.
To further determine whether matrix stiffness regulated the translocation of actin and HAT1, Western blotting analysis was used to detect actin and HAT1 levels in nuclear fractions and whole-cell lysates. As shown in Fig. 3 (D to F), β-actin and HAT1 were significantly higher in nuclear fractions of cells cultured on 20-kPa surfaces compared to other substrates but did not show significant changes at the whole-cell level in fibroblasts cultured on glass and gels of varying stiffness. This finding could be extended beyond HAT1 as an intermediate stiffness of 20 kPa also promoted the translocation of p300/CBP-associated factor (PCAF), another HAT, into the nucleus, compared to soft and stiff surfaces. Immunoprecipitation of nuclear actin demonstrated that, on the surface with an intermediate stiffness of 20 kPa, there was the highest HAT1 and actin association within the nucleus (Fig. 3, G and H), coinciding with the nuclear localization of actin and HAT1. Furthermore, the inhibition of actin polymerization using cytochalasin D significantly increased HAT activity (Fig. 3I) and reprogramming efficiency on stiff gels (40 kPa) and glass but had no effect on cells cultured on softer gels (20- and 1-kPa gels) (Fig. 3J). These results suggest that actin depolymerization may mediate matrix stiffness-induced HAT1 activity and iN reprogramming, but it is not clear why the translocation of HAT1 and actin was limited on 1-kPa surface.
Cofilin serves as a cotransporter of actin/HAT translocation into nucleus
Cofilin, an actin-binding and depolymerization protein, has a nuclear localization signal (NLS) domain and is required to shuttle actin into the nucleus through importin-9. Recent studies suggest that nucleocytoplasmic transport plays a role in mechanotransduction, whereby mechanoresponsive transcription factors transduce mechanical signals to the nucleus via their transport through nuclear pore complexes. Moreover, cofilin-1 has been recently identified as a mechanosensitive regulator of transcription, suggesting that biophysical cues can potentially modulate cofilin and actin transport to control cell fate and function. Therefore, cofilin expression and localization was determined by immunostaining and Western blot analysis. As shown in Fig. 4 (A and B), consistent with actin and HAT1, cofilin also had a pronounced nuclear localization and was significantly higher in nuclear fractions of cells on gels of intermediate stiffness (20 kPa) compared with the other groups. In addition, upon performing actin immunoprecipitation of nuclear fractions followed by cofilin analysis, we found that cells on an intermediate matrix stiffness had the highest cofilin-actin association within the nucleus (Fig. 4, C and D), which coincides with nuclear actin-HAT1 association and cofilin nuclear localization.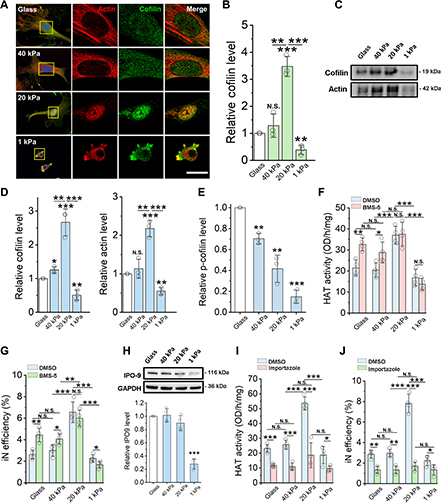
Fig. 4. Matrix stiffness regulates cofilin and actin nuclear translocation to modulate HAT activity.
Fibroblasts were cultured on glass or PAAm gels of various stiffness. (A) Immunofluorescent images of actin (red) and cofilin-1 (green) at day 2. Scale bar, 5 μm. (B) Cofilin level in nuclear fractions of fibroblasts at day 2, normalized by lamin A/C level (n = 3). (C) Co-immunoprecipitation of cofilin and actin from nuclear fractions of fibroblasts. (D) Quantification of cofilin and actin levels from co-immunoprecipitation Western blots (n = 3). (E) Phospho-cofilin (Ser3) level at day 2, normalized to cofilin level (n = 3). (F) HAT activity in fibroblasts cultured for 1 day followed by treatment with vehicle control (DMSO) or a LIMK inhibitor (BMS-5) for 24 hours (n = 4). (G) Reprogramming efficiency of BAM-transduced fibroblasts treated with BMS-5 for 24 hours before adding Dox (n = 4). (H) Western blotting analysis of importin 9 (IPO-9) levels in whole-cell lysates of fibroblasts, normalized by glyceraldehyde-3-phosphate dehydrogenase (GAPDH) level (n = 4). (I) HAT activity in fibroblasts cultured on various substrates for 1 day, followed by treatment with DMSO or a nuclear import inhibitor (importazole) for 48 hours (n = 4). (J) Reprogramming efficiency of BAM-transduced fibroblasts treated with importazole before adding Dox and during the reprogramming process (n = 4). In (B) and (D) to (J), bar graphs show means ± SD. Statistical significance was determined by a one-way ANOVA and Tukey’s multiple comparison test (*P ≤ 0.05, **P ≤ 0.01, and ***P ≤ 0.001).
Because cofilin phosphorylation at Ser3 can inhibit the activity of cofilin during actin depolymerization, we further analyzed phospho-cofilin (Ser3) level in fibroblasts cultured on different matrix stiffness. Western blotting analysis showed that the level of p-cofilin decreased with matrix stiffness (Fig. 4E), consistent with our finding that the F-actin decreases with matrix stiffness (Fig. 3, B and C). To determine whether cofilin phosphorylation plays a role in regulating HAT activity and, therefore, iN reprogramming, we treated the cells with BMS-5, a LIM kinase (LIMK)–1/2 inhibitor that inhibits the phosphorylation of cofilin by LIMK. As shown in Fig. 4 (F and G), pretreatment with BMS-5 significantly increased HAT activity and iN reprogramming efficiency of fibroblasts on glass and 40-kPa gels. However, there was no apparent difference for fibroblasts cultured on 20- or 1-kPa gels (Fig. 4, F and G) as cofilin phosphorylation was already low in the absence of BMS-5. As free cofilin and G-actin increased with the disassembly of actin filaments on soft surfaces (Fig. 3, B and C), presumably the transport of HAT1 and cofilin/actin should increase with decreasing matrix stiffness, yet the nuclear translocation of cofilin on 1 kPa was low (Fig. 4, A to C). Therefore, it is likely that other cellular changes on soft matrices might limit HAT activity and the reprogramming efficiency.
To directly test the role of actin polymerization, we used cytochalasin D at various concentrations to induce different extents of F-actin depolymerization that did not notably affect cell viability. As shown, cofilin and HAT1 translocated into the nucleus in a dose-dependent manner when the cytochalasin D concentration increased from 0.25 to 0.75 μM, thereby increasing HAT activity and iN reprogramming. However, treating the cells with higher doses of cytochalasin D (i.e., from 1.5 to 3 μM) suppressed cofilin and HAT1 translocation, HAT activity, and iN reprogramming, consistent with the low level of HAT1 translocation into nucleus on 1-kPa surfaces.
To look for other factors accounting for the low translocation level of HAT and actin on soft surface of 1 kPa, we investigated whether nuclear import was modulated by matrix stiffness. The analysis of nuclear pore protein expression revealed that importin-9 levels significantly decreased on soft substrates (1 kPa) when compared to stiff and intermediate surfaces (Fig. 4H), and this appears to be specific to importin-9 as we observed no apparent difference in nuclear pore complex protein levels across the various matrix stiffness examined. To further determine whether cofilin translocation via importin-9 plays a role in nuclear actin transport of HAT1 and, thus, iN reprogramming, importazole was used to block the importin-9 nuclear receptor, which is responsible for the nuclear translocation of actin-cofilin complexes. As expected, inhibiting the importin-9–mediated nuclear transport impaired the biphasic enhancement in HAT activity and iN reprogramming efficiency of fibroblasts cultured on intermediate stiffness gels and significantly decreased both HAT activity and iN reprogramming efficiency across all the surfaces tested (Fig. 4, I and J). These results demonstrate a potential mechanism of how the softest surface (1 kPa) limits nuclear translocation of cofilin-actin-HAT complexes (Fig. 4, C and D).
The dynamic change of matrix stiffness modulates HAT translocation
Moreover, to directly determine how matrix stiffening can regulate cofilin and HAT1 nuclear translocation, we sought out a tunable hydrogel system that would allow for matrix stiffening in response to a stimulus, such as light. Because a commercially available PAAm gel system that can be dynamically stiffened does not currently exist, tunable methacrylated hyaluronic (MeHA) hydrogels were prepared to dynamically increase the surface stiffness from 2 to 20 kPa and from 20 to 45 kPa upon exposure to ultraviolet (UV) light. When matrix stiffness was increased from 2 to 20 kPa, cofilin and HAT1 translocated from the cytoplasm to the nucleus, and HAT activity significantly increased after 6 hours of matrix stiffening (Fig. 5, A to C). On the other hand, when matrix stiffness increased from 20 to 45 kPa, cofilin and HAT1 relocated from the nuclei to the cytosol, and HAT activity significantly decreased 12 hours after surface stiffness was increased to 45 kPa (Fig. 5, D to F). Similarly, when matrix stiffness was softened from 8 to 2 kPa using tunable ortho-nitrobenzyl (o-NB) PAAm gels that have an o-NB-bis-acrylate crosslinker that cleaves and leads to gel softening after exposure to light, cofilin was translocated from the nucleus to the cytoplasm and HAT activity significantly decreased 6 hours after inducing matrix softening (Fig. 5, G to I). These results directly demonstrate that an intermediate level of substrate stiffness (~20 kPa) is optimal to promote HAT1 translocation into the nucleus to increase HAT activity.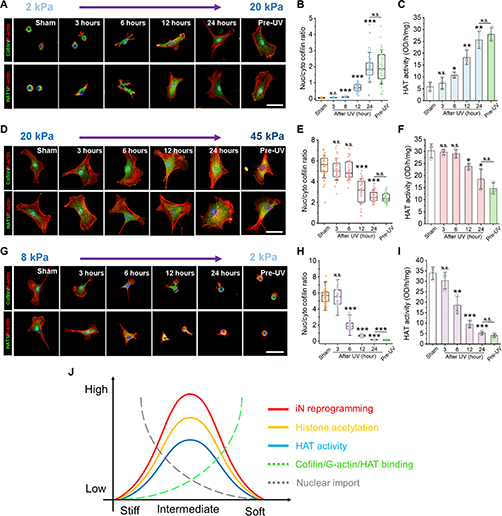
Fig. 5. Actin assembly, HAT translocation, and HAT activity are modulated by dynamically tunable gels.
(A) Representative immunofluorescent images of F-actin, cofilin, and HAT1 in fibroblasts at the indicated time points after UV radiation to stiffen the gels (from 2 to 20 kPa). Scale bar, 50 μm. (B) Nuclear to cytoplasmic ratio of cofilin based on images in (A) (n = 30 cells). (C) HAT activity in fibroblasts cultured on dynamically stiffening gels (2 to 20 kPa) at the indicated time points after UV radiation (n = 3). (D) Images of F-actin, cofilin, and HAT1 in fibroblasts at the indicated time points after UV radiation to stiffen the gels (20 to 45 kPa). Scale bar, 50 μm. (E) Nuclear to cytoplasmic ratio of cofilin based on images in (D) (n = 30 cells). (F) HAT activity in fibroblasts cultured on dynamically stiffening gels (20 to 45 kPa) after UV radiation (n = 3). (G) Images of F-actin with cofilin or F-actin with HAT-1 in fibroblasts at the indicated time points after UV radiation to soften the gels (from 8 to 2 kPa). Scale bar, 50 μm. (H) The nuclear to cytoplasmic ratio of cofilin based on images in (G) (n = 30 cells). (I) HAT activity in fibroblasts cultured on dynamically softening gels (8 to 2 kPa) after UV radiation (n = 3). (J) Summary of hypothesis for matrix stiffness-mediated iN reprogramming. In (B), (C), (E), (F), and (H) to (I), statistical significance was determined by a one-way ANOVA and Tukey’s multiple comparison test (*P ≤ 0.05, **P ≤ 0.01, and ***P ≤ 0.001).
DISCUSSION
Our work demonstrates a biphasic dependence of cell reprogramming on matrix stiffness through the regulation of the epigenetic state and suggests that matrix stiffness can regulate actin assembly and nuclear transport, which, in turn, modulates HAT activity and histone acetylation. These changes in the epigenetic state, especially on surfaces of intermediate stiffness (~20 kPa), promote a more open chromatin structure that facilitates neuronal gene induction and, thus, an enhancement in iN reprogramming. On the basis of the effects of matrix stiffness on actin polymerization and nuclear transport of cofilin/actin/HAT, we propose a two-factor hypothesis (Fig. 5J) to explain the biphasic regulation of epigenetic state and cell reprogramming by matrix stiffness. On the one hand, cells on a stiff matrix (40 kPa or higher) have a limited amount of cofilin and G-actin to mediate HAT translocation into the nucleus, although nuclear importer such as importin-9 is available, resulting in low levels of histone acetylation and iN reprogramming. On the other hand, cells on soft matrices (1 kPa) have low levels of actin polymerization and higher levels of cofilin and G-actin, which would facilitate HAT translocation to nucleus; however, the down-regulation of nuclear transporters such as importin-9, especially on 1-kPa surface, may limit the nuclear transport of cofilin/actin/HAT, resulting in a low iN reprogramming efficiency. Therefore, when cells are cultured on an intermediate matrix stiffness, the formation of cofilin-actin-HAT complexes and the nuclear transport via importin-9 are balanced at an optimal level, allowing for the most efficient shuttling of actin and HAT1 into the nucleus, thereby increasing AcH3 that is conducive to iN reprogramming.
In addition, there may be other mechanisms accounting for the stiffness effects on cell reprogramming. For instance, higher cell proliferation rate is correlated with higher reprogramming efficiency, and the decrease of cell proliferation on soft surfaces would lower the reprogramming efficiency, although this does not explain the low reprogramming efficiency on stiff surfaces where cell proliferation is high. The decrease in cell spreading on soft surfaces may decrease actin assembly and increase G-actin availability but decrease the contraction force in the cells, which may affect the mechanotransduction process. Nuclear size may affect the molecular transport through nuclear membrane and inside the nucleus. There are also previous reports that nuclear shape regulates the epigenetic state and induced pluripotent stem cell (iPSC) reprogramming and that an intermediate nuclear shape enhances collagen I synthesis.
Consistently, the biphasic regulation of HAT activity can be observed through the disruption of the actin cytoskeleton and the mechanical tuning of extracellular matrix stiffness. Notably, the effect of cytochalasin D treatment on HAT activity is both dose dependent and biphasic; HAT activity increases from 0 to 0.75 μM cytochalasin D but decreases at higher doses . It is likely that higher doses of cytochalasin D (>0.75 μM) also inhibit the nuclear import of cofilin/actin/HAT via importin-9, similar to a 1-kPa surface. In addition, the disruption of actin cytoskeleton may decrease the size of nuclear pores to suppress nuclear transport. Inhibiting actomyosin contraction using blebbistatin or decreasing focal adhesions using a focal adhesion kinase inhibitor also demonstrates a biphasic effect on iN reprogramming. This further confirms that HAT activity, and thus the epigenetic state, is regulated by cell adhesion–mediated actin polymerization. Furthermore, matrices with tunable stiffness, whether increased or decreased, directly influences HAT translocation and activity (Fig. 5). Note that disrupting the actin cytoskeleton, such as with blebbistatin treatment, may not induce the exact same epigenetic changes as altering matrix stiffness. Our previous studies have shown that blebbistatin induces global changes not only in AcH3 but also in H3K4me3, H3K9me3, and DNA methylation, leading to a more open chromatin state.
Our findings on the nuclear transport of cofilin/actin/HAT provide a novel mechanism that directly links actin cytoskeleton organization to epigenetic changes. This discovery may have broad implications for understanding the mechanical regulation of the epigenetic state by various intracellular and extracellular factors. Our findings contribute to the existing knowledge that actin dynamics (i.e., polymerization/depolymerization) can mediate the nuclear transport of transcription factors, such as MRTF and, more recently, β-catenin. The nuclear transport of β-catenin in response to dynamic strain was shown to be dependent on cofilin and importin-9, which is consistent with our results. Several previous studies have shown that matrix stiffness can modulate chromatin accessibility, DNA methylation, and heterochromatin in various cell types. Our findings are in agreement with other studies that have shown that an intermediate stiffness (i.e., 13 kPa) can promote histone acetylation, while soft substrates increase HDAC expression and decrease DNA methylation. However, these studies generally make comparisons between two stiffness (i.e., soft versus stiff), which assume a monotonic regulation of epigenetic state by matrix stiffness, and thus, further investigations are necessary to examine the potential biphasic regulation. In addition, the range of stiffness studied and cell types used could all lead to potential differences in epigenetic findings. By examining a broad range of matrix stiffness during iN reprogramming, we show that matrix stiffness regulates direct reprogramming through a biphasic mechanism. This finding may not be limited to only direct reprogramming as we found that an intermediate matrix stiffness of 20 kPa could promote iPSC reprogramming. However, one should note that cell reprogramming is a complex and multifaceted process that most likely involves various interconnected mechanisms, and future studies are necessary to fully elucidate all aspects of these mechanisms.
In this study, PAAm gels were used to investigate how matrix stiffness regulates the epigenetic state during iN reprogramming. While PAAm gels have several advantages, their use is limited to two-dimensional (2D) culture as acrylamide is toxic before polymerization. Thus, embedding cells to study the effects of substrate stiffness in 3D culture or for therapeutic purposes is not feasible using this hydrogel system. Alternative biomaterials would need to be considered, particularly when potentially translating these findings for regenerative medicine applications. Although PAAm and MeHA gels may differ in their chemical composition, we found that dynamic stiffening of MeHA gels could modulate the translocation of actin-cofilin-HAT complexes (Fig. 5, A and B), suggesting that the observed responses were due to changes in matrix stiffness and not limited to PAAm gels. As o-NB PAAm gels have a similar composition to PAAm gels and only differ in that they have a photodegradable crosslinker, this provided us an appropriate and comparable tool to study the effects of matrix softening, which also confirmed that our findings were attributed to changes in matrix stiffness. Furthermore, as cells experience a viscoelastic microenvironment in vivo, there is growing interest to engineer materials with viscoelastic properties. While our study provides insights into the effects of elastic hydrogels on direct reprograming, future directions could include to investigate the influence of viscoelasticity on cell reprogramming and whether our findings would be consistent using viscoelastic gels.
Moreover, our findings indicate that soft surfaces of both 20 and 1 kPa increased the accessibility of neuronal genes, with the highest accessibility around Ascl1 target genes on the surface of 20 kPa. This is distinguishable from stem cell differentiation where soft surfaces (less than 20 kPa) appear to promote neural differentiation more efficiently. First, cell reprogramming and differentiation are distinct processes with different rate-limiting factors. Second, the chromatin structure, the accessibility of neuronal genes, and signaling pathways in fibroblasts and neural stem cells are different, resulting in cell type–specific mechanical regulation of epigenetic state and signaling.
Our findings indicate that intermediate matrix stiffness of 20 kPa can increase iN reprogramming efficiency. While our findings contribute to our understanding of the mechano-epigenetic mechanisms during cell reprogramming, the identification of biophysical cues that can promote cell reprogramming has important implications for regenerative medicine applications. In addition to direct reprogramming being a faster method to obtain desired cell types, increasing the yield of target cells is highly beneficial for disease modeling and drug discovery, particularly for high-throughput drug screening platforms. Moreover, the translation of our findings to in vivo reprogramming paradigms could be potentially valuable for tissue engineering applications. Together, our findings shed light on how matrix stiffness biophysically regulates the epigenetic state and cell reprogramming, providing insights for engineering biomaterials for cell engineering.
MATERIALS AND METHODS
All experiments were performed in accordance with relevant guidelines and ethical regulations approved by the University of California, Los Angeles (UCLA) Institutional Biosafety Committee (BUA-2016-222). All animal experiments, including breeding, maintenance, and euthanasia, were performed in accordance with relevant guidelines and ethical regulations approved by the UCLA Institutional Animal Care and Use Committee (protocol nos. ARC-2016-036 and ARC-2016-101).
Fibroblast isolation, culture, and reprogramming
Fibroblasts were isolated from ear tissues of adult C57BL/6 mice (1 month old) and expanded in fibroblast medium containing Dulbecco’s modified Eagle medium (DMEM) (Gibco, 11965), 10% fetal bovine serum (FBS; Gibco, 26140079), and 1% penicillin/streptomycin (Gibco, 15140122). For all experiments, passage-2 cells were used and synchronized upon reaching 80% confluency using DMEM with 1% FBS for 24 hours before transduction with viruses containing BAM constructs. Twenty-four hours later, cells were seeded onto PAAm gels coated with fibronectin (0.1 mg/ml; Thermo Fisher Scientific, 33016015) at a density of 3000 cells/cm2. The following day (day 0), the medium was replaced to fibroblast medium containing doxycycline (2 ng/ml; Sigma-Aldrich) to initiate the expression of the transgenes and thus reprogramming. Twenty-four hours later (day 1), cells were cultured in N2B27 medium containing DMEM/F12 (Gibco, 11320033), N-2 supplement (Gibco, 17502048), B-27 supplement (Gibco, 17504044), 1% penicillin/streptomycin, and doxycycline (2 ng/ml), and half medium changes were performed every 2 days. On day 7, cells were fixed and stained for Tubb3 to determine the reprogramming efficiency. iN cells were identified on the basis of positive Tubb3 staining and a neuronal morphology. The reprogramming efficiency was determined as the percentage of iN cells on day 7 relative to the number of the cells initially seeded. For long-term studies where maturation and functionality of the iN cells were examined, cells were kept in culture for 3 or 5 weeks, respectively.
To determine the role of histone acetylation-modifying enzymes in stiffness-mediated iN reprogramming, BAM-transduced fibroblasts were treated with HAT inhibitor anacardic acid (1 μM; Cayman chemical, 13144) or HDAC inhibitor VPA (500 μM; Cayman chemical, 13033), respectively, for 24 hours before seeding the cells on substrates. To investigate the role of actin polymerization in stiffness-mediated iN reprogramming, BAM-transduced fibroblasts were treated with actin polymerization inhibitor cytochalasin D (0.5 μM; Cayman chemical, 11330) for 24 hours before seeding the cells on substrates. To determine whether the translocation of the actin-cofilin complex regulates stiffness-mediated iN reprogramming, cells were treated with importin-9 inhibitor importazole (10 μM; Cayman chemical, 21491) for 24 hours before seeding the cells on gels. In addition, fibroblasts were treated with LIMK-1/2 inhibitor BMS-5 (4 μM; Cayman chemical, 21072) for 24 hours before seeding the cells on the gels to further elucidate the role of phospho-cofilin in stiffness-mediated iN reprogramming. Parallel treatments with dimethyl sulfoxide (DMSO) served as controls.
Lentiviral production and transduction
Doxycycline-inducible lentiviral vectors for Tet-O-FUW-Brn2, Tet-O-FUW-Ascl1, Tet-O-FUW-Myt1l, and FUW-rtTA plasmids were used to transduce fibroblasts for ectopic expression of Brn2, Ascl1, Myt1L, and rtTA. The Ascl1–enhanced GFP promoter lentiviral vector (Genecopoeia, MPRM39894-LvPF02) was used to identify the activation of the Ascl1 promoter. Lentivirus was produced by using established calcium phosphate transfection methods, and Lenti-X Concentrator (Clontech, 631232) was used to concentrate viral particles according to the manufacturer’s protocol. Stable virus was aliquoted and stored at −80°C. Fibroblasts were plated and synchronized for 24 hours before viral transduction in the presence of polybrene (8 μg/ml; Sigma-Aldrich, H9268). Cells were incubated with the virus for 24 hours before performing matrix stiffness-mediated experiments.
PAAm gel fabrication
PAAm gels were used in most experiments except the living cell studies using dynamically tunable gels. PAAm gels were fabricated according to established protocols, and gels of different stiffness were obtained by varying the ratio of acrylamide to bisacrylamide as previously documented. Briefly, glass coverslips (12 mm) were sonicated in 70% ethanol for 10 min and then allowed to air dry. The coverslips were oxygen plasma–treated for 5 min, followed by incubation with a methacryloxypropyl-trimethoxysilane (Gelest) solution for 5 min. Coverslips were washed three times with methanol and incubated at 110°C for 30 min. PAAm gel solution with the desired concentration of acrylamide and bis-acrylamide was allowed to polymerize for 20 to 30 min to form 100-μm-thick gels. Sulfo-SANPAH (1 mg/ml in Hepes buffer; Thermo Fisher Scientific, 22589) was used to crosslink fibronectin (0.1 mg/ml) to the gel surface. The conjugation of matrix proteins such as fibronectin onto the surface of PAAm gels have been well established, and previous studies have shown that fibronectin is incorporated at the hydrogel surface, and the amount of fibronectin does not change as hydrogel stiffness varies. On the other hand, surface conjugation does not significantly affect the stiffness PAAm substrates. Stiff substrates (glass slides) were coated with the same density of fibronectin. All substrates were sterilized with 70% ethanol for 15 min, followed by three phosphate-buffered saline (PBS) washes. Cells were then seeded onto substrates at a density of 3000 cells/cm2.
Methacrylated hyaluronic acid hydrogel fabrication
Methacrylated hyaluronic acid (MeHA) gels were prepared to study the effect of matrix stiffening on HAT/actin translocation into nucleus in living cells. MeHA gels were prepared using the PhotoHA-IRG Kit (Advanced BioMatrix, #5220) according to the manufacturer’s instructions and as previously described. Briefly, glass coverslips were prepared as aforementioned for PAAm hydrogels. MeHA powder was dissolved in PBS (1% solution) and mixed on shaker for 1 hour at 4°C. Irgacure (photoinitiator) was dissolved in 100% methanol and then diluted to 0.01% (w/v) in the MeHA solution. Eighteen microliters of the hydrogel solution was sandwiched between methacryloxypropyl-trimethoxysilane–treated glass coverslip and Gel slick (Lonza, #50640)–activated glass slide and photopolymerized using a 365-nm Black Ray Bench Lamp light source (7.8 mW/cm2, UVP, LLC). Tunable gels were initially UV-radiated for 30 or 60 s to yield ~2- and ~ 20-kPa gels. To further stiffen the hydrogels, gels were radiated from 60 to 120 s. For protein conjugation, 100 μl of an 1-ethyl-carbodiimide hydrochloride (EDC)/N-hydroxysuccinimide (NHS) solution (76 mg of EDC + 115 mg of NHS + 2 ml of PBS buffer) was added to the surface of the gel and incubated for 30 min. Gels were washed in PBS for 5 min, and then 100 μl of fibronectin (0.1 mg/ml) was added to the gel surface and incubated overnight at 37°C. All substrates were sterilized with 70% ethanol for 15 min, followed by three PBS washes. Cells were then seeded onto substrates at a density of 3000 cells/cm2. In one set of experiments, cells cultured on 2-kPa gels with no UV radiation and 20-kPa gels (pre-exposed to UV radiation, i.e., Pre-UV) were used as controls. In a second set of experiments, cells cultured on 20-kPa gels with no UV radiation and 45-kPa gels (pre-exposed to UV radiation, i.e., Pre-UV) were used as controls.
Photodegradable o-NB PAAm hydrogel fabrication
Photodegradable PAAm gels were used to study the effects of gel softening (i.e., stiffness decrease) on HAT/actin translocation into the nucleus in living cells. Photodegradable o-NB PAAm hydrogels were prepared as previously described by replacing bisacrylamide with a photocleavable o-NB–bis-acrylate crosslinker. Briefly, glass coverslips were prepared as aforementioned for PAAm hydrogels and PAAm gel solution with the desired concentration of acrylamide, bis-acrylamide, o-NB–bis-acrylate, and 6-acrylamidohexylaminohexanoic acid (N6) was allowed to polymerize for 20 min to form 100-μm-thick gels. Gels were then washed on a shaker plate in a PBS/isopropanol solution for 5 days with two changes of the wash solution per day. Before conducting protein conjugation, gels were washed with PBS twice, with the second wash spanning overnight. The next day, gels were submersed in a 2-(N-morpholino)ethanesulfonic acid (MES) buffer solution (0.1 M, pH = 6) for at least 2 hours. The MES buffer was aspirated off, and 100 μl of 3-(3-dimethylaminopropyl)–EDS and NHS solution (76 mg of EDC + 115 mg of NHS + 2 ml of MES buffer) was added to the surface of the gel and incubated for 30 min. The EDC/NHS solution was then aspirated off, and the gels were washed in PBS for 5 min. After PBS was aspirated off, 100 μl of fibronectin (0.1 mg/l) was added to the gel surface. Gels were placed into the cell culture incubator overnight. The following day, gels were sterilized in 70% ethanol and rehydrated in sterile PBS. Cells were cultured on the gels the same day after sterilization at a density of 3000 cells/cm2. For gel degradation studies, a 365-nm Black Ray Bench Lamp light source [115 V 60 Hz, 0.68 A (UVP, LLC)] with an output intensity of 7.8 mW/cm2 (integrated between 300 and 500 nm) as measured by a spectroradiometer (International Light Technologies, ILT950) was used. All samples receiving irradiation were exposed for 40 min in four increments of 10 min. Between degradations, the samples were placed in the incubator for 10 min to minimize changes in culture temperature and pH. For these experiments, cells cultured on 8-kPa gels with no UV radiation and 2-kPa gels (pre-exposed to UV radiation, i.e., Pre-UV) served as controls.
Immunofluorescence staining and microscopy
Samples collected for immunofluorescence staining at the indicated time points were washed once with PBS and fixed in 4% paraformaldehyde for 15 min. Samples were washed three times with PBS for 5 min each and permeabilized using 0.5% Triton X-100 for 10 min. After three subsequent PBS washes, samples were blocked with 5% normal donkey serum (NDS; Jackson Immunoresearch, 017000121) in PBS for 1 hour. Samples were incubated with primary antibodies in antibody dilution buffer (1% NDS + 0.1% Triton X-100 in PBS) for either 1 hour or overnight at 4°C followed by three PBS washes and a 1-hour incubation with Alexa Fluor 488– and/or Alexa Fluor 546–conjugated secondary antibodies (Molecular Probes). F-actin was labeled by incubating with Alexa Fluor 546 Phalloidin (Invitrogen, A22283) for 1 hour, and nuclei were stained with 4′,6-diamidino-2-phenylindole (DAPI) in PBS for 10 min. Epifluorescence images were collected using a Zeiss Axio Observer Z1 inverted fluorescence microscope and analyzed using ImageJ. Confocal images were collected using a Leica SP8-STED/FLIM/FCS Confocal and analyzed using ImageJ.
Cell area and nuclear volume measurements were derived from images of phalloidin and DAPI-labeled cells, respectively, which were analyzed using ImageJ. Average AcH3 and AcH4 intensities per nuclei were quantified using an ImageJ macro. Gaussian blur, thresholding, watershed, and analyze particle functions were applied to the DAPI channel to create individual selections for each nucleus. This mask was applied to the corresponding stain image to measure the average fluorescence intensity within each nucleus. In addition, ImageJ was used to analyze the fluorescence intensity within the nucleus and out of the nuclear area to quantify the protein translocation.
Quantitative reverse transcription PCR
Fibroblasts cultured on glass or PAAm gels of varying stiffness for 1 day were lysed using TRIzol (Invitrogen, 15596026), and then RNA was isolated using the PureLink RNA Mini Kit (Thermo Fisher Scientific, #121830020) as we have previously reported. After RNA extraction, Thermo Scientific Maxima First Strand cDNA Synthesis Kit (Thermo Fisher Scientific, K1641) was used for first-strand cDNA synthesis. Quantitative reverse transcription PCR (qRT-PCR) was performed using a CFX96 Real-Time PCR Detection System to detect the gene expression levels of Ascl1 (forward primer: GAAGCAGGATGGCAGCAGAT; reverse primer: TTTTCTGCCTCCCCATTTGA), where 18S (forward primer: GCCGCTAGAGGTGAAATTCTTG; reverse primer: CATTCTTGGCAAATGCTTTCG) served as a housekeeping gene and was used for normalization.
Chromatin immunoprecipitation–qPCR
ChIP-qPCR analysis was performed as described previously. Briefly, 3 days post-Dox addition, 10 million BAM-transduced fibroblasts cultured on glass or PAAm gels of varying stiffness were fixed by using 1% formaldehyde in PBS (Thermo Fisher Scientific, BP531) for 10 min. Glycine was added at a final 1× concentration for 5 min at room temperature, followed by two washes with cold PBS. Cells were scraped and collected in PBS containing protease inhibitors. Samples were centrifuged at 2000g at 4°C for 5 min, the supernatant was removed, and samples were stored at −80°C before further processing. The cells were resuspended and lysed in cell lysis buffer and resuspended in nuclei lysis buffer before sonication using a Branson SFX250 Sonifier at 40% amplitude, 0.7-s on, and 1.3-s off, for a total of 8 min. Samples were spun down at maximum speed in a 4°C centrifuge, and the supernatant was collected. Fifty microliters was removed from each sample and stored at 4°C as a downstream internal control.
Normal rabbit IgG (Millipore, CS200581) or anti-rabbit histone 3 acetylation (Millipore, 06-599) were added to samples and incubated in a rotator overnight at 25 rpm in a 4°C refrigerator. Pierce Protein A/G Magnetic Agarose Beads (Thermo Fisher Scientific, #78610) were washed with ChIP dilution buffer using a magnetic separation rack and added to each sample and incubated in a rotator for 2 hours. Following washing steps, the beads were resuspended in 50 μl of freshly prepared ChIP elution buffer (1% SDS and 0.1 M NaHCO3) and placed in a 65°C bath for 10 min. The supernatant was collected, and this elution step was performed once more and the corresponding eluates were combined.
qRT-PCR was performed on input and ChIP DNA samples using a CFX qPCR machine (Bio-Rad) and the following primers: Ascl1 (forward primer: AACCCCATATGGCTGCAGAG; reverse primer: GGGAGAGCGTTTGCACACTA) and Tubb3 (forward primer: AGAGGTCTCAAGAAGGGTTTCGC; reverse primer: AGAGGGTCTTTCTTTCTCTCAAGTG). ChIP-qPCR data were analyzed by normalizing the DNA concentration to percent input using the relative standard curve method.
ATAC sequencing
A total of 1,000,000 fibroblasts were cultured on matrices of varying stiffness for 3 days and stored at −80°C before sample processing. ATAC-seq was performed as described previously. Briefly, frozen cells were thawed and washed once with PBS and then resuspended in 500 μl of cold PBS. The cell number was assessed by Cellometer Auto 2000 (Nexcelom Bioscience, Massachusetts, USA), and 100,000 cells were then added to ATAC lysis buffer and centrifuged at 500g in a prechilled centrifuge for 5 min. Supernatant was removed, and the nuclei were resuspended in 50 μl of tagmentation reaction mix by pipetting up and down. The reactions were incubated at 37°C for 30 min in a thermomixer with shaking at 1000 rpm and then cleaned up using the MiniElute Reaction Clean Up Kit (QIAGEN). Tagmented DNA was amplified with barcoded primers. Library quality and quantity were assessed with Qubit 2.0 DNA HS Assay (Thermo Fisher Scientific), Tapestation High Sensitivity D1000 Assay (Agilent Technologies), and QuantStudio 5 System (Applied Biosystems). Equimolar pooling of libraries was performed on the basis of quality control values and sequenced on an Illumina NovaSeq (Illumina, California, USA) with a read length configuration of 150 paired-end (PE) for [100]M PE reads (50 M in each direction) per sample.
For mapping and peak analysis, FASTQ files were trimmed with Trim Galore and cutadapt. Pair-ended reads were then aligned to the mouse reference genome (mm10) with Bowtie2. Mitochondrial reads and PCR duplicates were removed using SAMtools and Picard (http://broadinstitute.github.io/picard/), respectively. Peaks were called over input using MACS3, and only peaks outside the ENCODE blacklist region were kept. All peaks from the samples were combined and merged using bedtools, and featureCount was used to count the mapped reads for each sample. Peaks that were up- or down-regulated under different conditions were defined by using DESeq2 with Padj = 0.05 as the threshold. Peaks located at cis-regulatory elements related to genes of interest (±5-kb region) were visualized by using Integrative Genomics Viewer to demonstrate differentially up- or down-regulated peaks at genomic regions of Ascl1-target sites. To identify differentially accessible regions around Ascl1-targeting genes, we used an Ascl1 ChIP-seq dataset that was previously published (GSE43916, Ascl1 MEF). Genome coordinates of peaks were converted from mm9 to mm10 reference genome by using UCSC liftOver tools. Peaks identified in both Ascl1 ChIP-seq and ATAC-seq datasets were selected for heatmap visualization.
RNA sequencing and analysis
A total of 500,000 fibroblasts were cultured on matrices of varying stiffness for 3 days and stored at −80°C before sample processing. Upon isolating RNA from the samples, mRNA was purified from total RNA using poly-T oligo-attached magnetic beads. After fragmentation, the first strand cDNA was synthesized using random hexamer primers, followed by the second strand cDNA synthesis. The library was ready after end repair, A-tailing, adapter ligation, size selection, amplification, and purification. The library was checked with Qubit and real-time PCR for quantification and bioanalyzer for size distribution detection. Quantified libraries were pooled and sequenced on the NovaSeq PE150 (Illumina). Raw reads were trimmed with Trim Galore and cutadapt based on quality. Pair-ended reads were then aligned to mouse reference genome (mm10) with STAR v2.7.10b. Transcriptome alignments were quantified using featureCount using the gene annotation file from GENCODE. Differentially expressed genes (DEGs) were defined using DESeq2 with Padj = 0.05 as the threshold. GO enrichment analysis was performed using the enrichGO function in clusterProfiler package. Generally, ggplot2 and gplots packages were used to generate data graphs. For heatmap of DEGs, values were normalized using size factor estimated from gene count matrix by DESeq2 and then z-scored by row.
HAT and HDAC activity assays
Nuclear protein extractions were isolated from 105 fibroblasts cultured on glass, PAAm, MeHA, or o-NB PAAm gels of varying stiffness for the indicated time points by using the nuclear extraction kit (EpiGentek, OP-0002, USA), according the manufacturer’s instructions. HAT and HDAC activity were measured by using the HAT activity/inhibition assay kit (EpiGentek, P-4003-48, USA) and HDAC activity/inhibition assay kit (EpiGentek, P-4034-96, USA), respectively. Following the manufacturer’s instructions, 5 μg of nuclear extract was added into the assay wells and incubated at 37°C for 60 min. After adding the color developer solution, the absorbance was measured using a plate reader (Infinite 200Pro, 30050303) at 450 nm. For inhibitor experiments, fibroblasts were cultured on glass and PA gels of varying stiffness for 1 day, followed by treatment with vehicle control (DMSO), anacardic acid (1 μM; Cayman chemical, 13144), VPA (500 μM; Cayman chemical, 13033), cytochalasin D (0.5 μM or indicated concentrations; Cayman chemical, 11330), importazole (10 μM; Cayman chemical, 21491), or BMS-5 (4 μM; Cayman chemical, 21072) for 24 hours before isolating nuclear protein extracts and measuring HAT or HDAC activity as aforementioned.
Western blotting analysis
Fibroblasts cultured on glass or PAAm gels of varying stiffness for 2 days were lysed using radioimmunoprecipitation assay buffer with protease inhibitors. The protein concentration of each sample was measured using a NanoDrop Spectrophotometer (Life technology, USA). Equal amounts of total protein (50 μg) from each sample were separated in a 10% SDS–polyacrylamide gel electrophoresis (SDS-PAGE) gel and transferred to a polyvinylidene difluoride membrane at 120 V for 2 hours at room temperature. The blot was blocked with 3% nonfat dry milk suspended in TBS-T (Thermo Fisher Scientific, J77500.K2) for 1 hour at room temperature. Membranes were incubated with primary antibodies overnight at 4°C. The resulting blots were incubated with secondary antibodies (Anti-mouse IgG HRP-linked antibody, Cell Signaling Technology, 7076S and Anti-mouse IgG HRP-linked antibody, Cell Signaling Technology, 7074S) at 1:3000 dilution. Bands were scanned using a densitometer (Bio-Rad) and quantified using the Quantity One 4.6.3 software (Bio-Rad).
Nuclear and cytosol protein extraction
Nuclear and cytosol protein extractions were isolated from 105 fibroblasts cultured on glass or PAAm gels of varying stiffness for 48 hours using the nuclear extraction kit (EpiGentek, OP-0002, USA), according the manufacturer’s instructions. Briefly, after removal of the growth medium, cells were washed twice with PBS. One milliliter of fresh PBS was added and cells were scraped into a 15-ml conical tube, followed by centrifugation at 1000 rpm for 5 min. Cytoplasmic extracts were isolated by incubating samples with pre-extraction buffer containing DTT and protease inhibitors for 10 min at 4°C and centrifuged at 12,000 rpm for 10 min. Upon removing the cytoplasmic extract (supernatant), samples were incubated with extraction buffer containing dithiothreitol and protease inhibitors for 15 min at 4°C and centrifuged at 14,000 rpm for 10 min to obtain nuclear protein extracts.
Immunoprecipitation
For immunoprecipitation studies, the immunoprecipitation kit (Abcam, ab206996, USA) was used to isolate the protein complex. After cells were cultured on gels for 48 hours, nuclear and cytosol protein were isolated using the nuclear extraction kit. Then, 20 μl of actin primary antibody (Santa Cruz Biotechnology, USA, sc-1616 and sc-47778) was mixed with the cell extract, and the volume was made up to 500 μl with lysis buffer containing the protease inhibitor cocktail, followed by an overnight incubation at 4°C on a rotary mixer. The next day, 40 μl of protein A/G sepharose beads slurry was added to each sample and incubated for 1 hour at 4°C. Beads were collected by low-speed centrifugation at 4°C and washed three times with the wash buffer. Upon removing the wash buffer, 40 μl of 2X SDS-PAGE loading buffer was added to the beads and samples were boiled for five min to elute the complex. Samples were then subjected to SDS-PAGE and Western blotting to visualize the results.
F-actin and G-actin isolation
To study the effects of matrix stiffness on F-actin and G-actin ratio, F-actin and G-actin content were isolated from nuclear and cytoplasmic extracts using the G-actin/F-actin In Vivo Assay Biochem Kit according to manufacturer’s instructions (Cytoskeleton, USA). Briefly, 5 × 10⁶ cells were cultured on gels for 48 hours, and nuclear and cytoplasmic extracts were isolated by using the nuclear extraction kit. Proteins were then transferred to a prewarmed (37°C) ultracentrifuge (Beckman, Fullerton, CA) and spun at 150,000g for 1 hour at 37°C to separate G-actin (supernatant) and F-actin (pellet) fractions. After collecting the G-actin content, the pellets were resuspended in ice-cold deionized water with 10 μM cytochalasin D. The pellets were dissolved by triturating with a pipette and left on ice for 1 hour, vortexing every 10 min to dissociate F-actin. Resuspended solutions were centrifuged at 2300g for 5 min at 4°C. The second supernatants were collected as F-actin samples. All samples were diluted with appropriate loading buffer and boiled for 5 min. The samples were then subjected to SDS-PAGE and Western blotting to analyze actin content.
Electrophysiology
Samples were treated with a standard bath solution containing 145 mM NaCl, 3 mM KCl, 10 mM Hepes, 3 mM CaCl2, 8 mM glucose, and 2 mM MgCl2 at pH 7.4. Whole-cell recording was made using a patch clamp amplifier (MultiClamp 700B, Axon Instruments) under infrared differential interference contrast optics. Microelectrodes were made from borosilicate glass capillaries, with a resistance of 4 to 5 megohm. For recording action potentials, cells were held at −70 mV in voltage-clamp mode. The intracellular solution for whole-cell recording of excitatory postsynaptic potentials and action potentials contained 140 mM potassium gluconate, 5 mM KCl, 10 mM Hepes, 0.2 mM EGTA, 2 mM MgCl2, 4 mM Mg–adenosine 5′-triphosphate (ATP), 0.3 mM Na2–guanosine 5′-triphosphate (GTP), and 10 mM Na2-phosphocreatine at pH 7.2. For recording sEPSCs, cells were pretreated with the extracellular bath solution containing 50 μM picrotoxin to exclude an inhibitory synaptic activity and held at −70 mV in voltage-clamp mode with the intracellular solution containing 30 mM CsMeSO4, 7 mM CsCl, 10 mM Hepes, 1 mM EGTA, 4 mM Mg-ATP, 0.3 mM Na2-GTP, and 10 mM Na2-phosphocreatine at pH 7.3. After recording basal sEPSC responses for 5 min, both 10 μM CNQX and 100 μM d,l-APV were applied to test a dependency of sEPSC responses on AMPA- and N-methyl-d-aspartate type of glutamate receptors. For measuring spontaneous inhibitory postsynaptic currents (sIPSCs), cells were pretreated with the bath solution containing 10 μM CNQX and 100 μM d,l-APV and held at −70 mV with the intracellular solution containing 137 mM CsCl, 10 mM Hepes, 1 mM EGTA, 4 mM Mg-ATP, 0.3 mM Na2-GTP, and 10 mM Na2-phosphocreatine at pH 7.3. Picrotoxin (50 μM) was then added to test a dependency of sIPSC responses on γ-aminobutyric acid receptors after acquiring basal sIPSC responses for 5 min. Series resistance (15 to 30 megohm) and input resistance (~200 megohm using potassium-based internal solution; 1 to 2 gigaohm using Cs-based internal solution) were monitored throughout the whole-cell recording or compared before and after sEPSC/IPSC recordings. Off-line analysis of spontaneous EPSC and IPSC were performed by using a threshold event detection function of Clampfit software (Molecular Devices).
DNA methylation assay
Fibroblasts plated on glass or PAAm gels of varying stiffness for 2 days were trypsinized, and DNA was extracted by using the Invitrogen PureLink Genomic DNA Mini Kit (Invitrogen, K1820-01). The 5-mC level was analyzed by using the MethylFlash Global DNA Methylation (5-mC) ELISA Easy Kit (Epigentek, P-1030) according to the manufacturer’s instructions. Briefly, 100 ng of sample DNA was bonded into the assay wells and incubated with a 5-mC detection complex solution for 60 min. Then, color developer solution was added into assay wells, and the absorbance at 450 nm was measured using a plate reader (Infinite 200Pro, 30050303).
Atomic force microscopy
To determine the elastic modulus of MeHA gels, mechanical measurements of hydrogels were performed using atomic force microscopy (AFM). Uncoated MeHA gels were fabricated by exposure to UV light as indicated and incubated in PBS for several hours before performing the AFM measurements. Mechanical measurements were performed on a JPK Nanowizard 4a AFM with a colloidal probe (sphere Ø = 3.5 μm) (CP-qp-CONT-SiO-B, NanoAndMore Corp., USA), a highly sensitive cantilever k = 0.1 N/m, and sample Poisson’s ratio of 0.5 at the UCLA Nano and Pico Characterization facility. During the measurement, hydrogels were incubated on a glass-bottom dish with prewarmed PBS and set on a temperature-controlled stage at 37°C. The force-distance curves were recorded, and the elastic modulus of hydrogels was calculated by NanoScope Analysis using the Hertz model.
Compression testing
Compression test was performed on a Chatillon TCD 225 series force measurement system. After measuring the thickness of the PAAm gels (8 mm in diameter, equilibrated in deionized water for 24 hours), the samples were compressed with a deformation rate of 0.85 mm min−1 and a sampling rate of 1 Hz. Stress and strain were calculated from the load/displacement data. Elastic modulus were then computed from the stress-strain curve to compare the mechanical properties of samples.
Scanning electron microscopy
After equilibrating PAAm gels in deionized water for 24 hours, gels were put in liquid nitrogen and freeze-dried. The freeze-dried gels were mounted on stubs for scanning electron microscopy (SEM) with the aid of conductive adhesive tapes and then sputter-coated with gold palladium (Ted Pella Inc.) at 40 mA for 60 s to achieve satisfactory conductivity with minimal damage to the specimen. The coated samples were observed in a Zeiss Supra 40 VP SEM, operated at 10 kV.
Cell viability
Cell viability was assayed using the PrestoBlue Cell Viability Reagent (Invitrogen, A13261) according to the manufacturer’s protocol. Cells were incubated with the PrestoBlue Reagent for 2 hours. Absorbance was measured by a plate reader (Infinite 200PRO) at excitation/emission = 560/590 nm. Results were normalized to control (i.e., DMSO) or glass samples.
Statistical analysis
All data are presented as means ± 1 SD, where sample size (n) ≥ 3. Box plots show the ends at the quartiles and the mean as a horizontal line in the box, and the whiskers represent the SD. For most of the experiments, the sample size (n) refers to the number of independently prepared hydrogels analyzed. When sample size indicates a certain number of cells were examined, these results were obtained from analyzing cells across three hydrogels. Comparisons among values for groups greater than two were performed using a one-way analysis of variance (ANOVA), followed by a Tukey’s post hoc test. For two group analysis, a two-tailed, unpaired Student’s t test was used to analyze differences. For all cases, P values less than 0.05 were considered statistically significant. Origin 2018 software was used for all statistical evaluations.
Acknowledgments - We would like to thank J. Yu, S. Duan, Y. Teng, and R. Fu for the advice and assistance with SEM sample preparation.
Multiscale mechanical analysis of the elastic modulus of skin
by Adam Wahlsten, Alberto Stracuzzi , Ines Lüchtefeld, Gaetana Restivo, Nicole Lindenblatt, Costanza Giampietro, Alexander E. Ehret, Edoardo Mazza
Received 28 May 2023, Revised 27 July 2023, Accepted 15 August 2023, Available online 19 August 2023, Version of Record 4 October 2023.
https://doi.org/10.1016/j.actbio.2023.08.030
Abstract
The mechanical properties of the skin determine tissue function and regulate dermal cell behavior. Yet measuring these properties remains challenging, as evidenced by the large range of elastic moduli reported in the literature—from below one kPa to hundreds of MPa. Here, we reconcile these disparate results by dedicated experiments at both tissue and cellular length scales and by computational models considering the multiscale and multiphasic tissue structure. At the macroscopic tissue length scale, the collective behavior of the collagen fiber network under tension provides functional tissue stiffness, and its properties determine the corresponding elastic modulus (100–200 kPa). The compliant microscale environment (0.1–10 kPa), probed by atomic force microscopy, arises from the ground matrix without engaging the collagen fiber network. Our analysis indicates that indentation-based elasticity measurements, although probing tissue properties at the cell-relevant length scale, do not assess the deformation mechanisms activated by dermal cells when exerting traction forces on the extracellular matrix. Using dermal-equivalent collagen hydrogels, we demonstrate that indentation measurements of tissue stiffness do not correlate with the behavior of embedded dermal fibroblasts. These results provide a deeper understanding of tissue mechanics across length scales with important implications for skin mechanobiology and tissue engineering.
Statement of Significance
Measuring the mechanical properties of the skin is essential for understanding dermal cell mechanobiology and designing tissue-engineered skin substitutes. However, previous results reported for the elastic modulus of skin vary by six orders of magnitude. We show that two distinct deformation mechanisms, related to the tension–compression nonlinearity of the collagen fiber network, can explain the large variations in elastic moduli. Furthermore, we show that microscale indentation, which is frequently used to assess the stiffness perceived by cells, fails to engage the fiber network, and therefore cannot predict the behavior of dermal fibroblasts in stiffness-tunable fibrous hydrogels. This has important implications for how to measure and interpret the mechanical properties of soft tissues across length scales.
Graphical abstract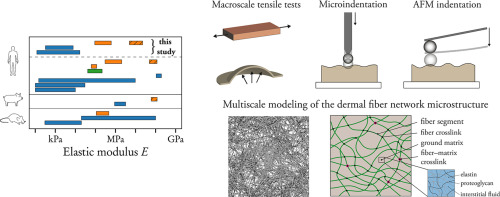
1. Introduction
Mechanics plays a key role in determining the form and function of biological tissues. An excellent example is the skin, the deformable and tear-resistant outer barrier of the human body that protects the vital inner organs from damage. Fulfilling this protective function requires both high compliance and extreme defect tolerance to adapt to and sustain the mechanical forces exerted during normal physical activities without tearing. External forces are borne primarily by the extracellular matrix (ECM) of the dermis, the main structural layer of the skin. Its ECM is a complex composite material, which is composed of interstitial fluid, an entangled network of collagen fibers providing structural resistance, and charged proteoglycans controlling tissue hydration. The structural proteins of the ECM are also the primary attachment sites for dermal cells, which are able to exert forces on the ECM and thus sense their biophysical environment. In fact, various mechanical cues are known to determine cell behavior, thereby influencing processes such as the repair and regeneration of wounded tissue. Understanding the mechanical behavior of the skin is therefore important for a wide range of applications and processes across multiple length scales, such as the design of tissue-engineered skin-equivalent materials and epidermal electronic devices, planning of reconstructive surgery, and the mechanobiology of aging and wound healing. In order to resolve the role of mechanics in these processes, one prerequisite is an accurate determination of the mechanical properties of the skin at the length scales of interest. Although the mechanical behavior of the skin is highly nonlinear, anisotropic and time dependent, essential information is still contained in a single metric of its material stiffness, the elastic (Young’s) modulus. However, values of the elastic modulus of skin reported in the literature span six orders of magnitude—from hundreds of Pa to tens and even hundreds of MPa(Fig. 1a). To illustrate, six orders of magnitude difference in elastic modulus is comparable to the difference between the modulus of a typical rubber and that of diamod. In fact, large discrepancies in the elastic moduli reported exist not only for skin but also for several other soft biological tissues, indicating the difficulties associated with the measurement, analysis, and interpretation of the mechanical properties for this class of materials. A physical explanation of these discrepancies has not yet been proposed, but it has been hypothesized that the testing technique used and the tissue length scale probed influence the modulus measured, in conflict with the concept of being a material property. In line with this hypothesis, a common conjecture is that tissue stiffness for applications in mechanobiology needs to be measured at the cell-perception scale using, for example, atomic force microscopy (AFM). However, direct experimental and theoretical support for this argument is lacking.
Fig. 1. Mechanical properties of human skin across length scales.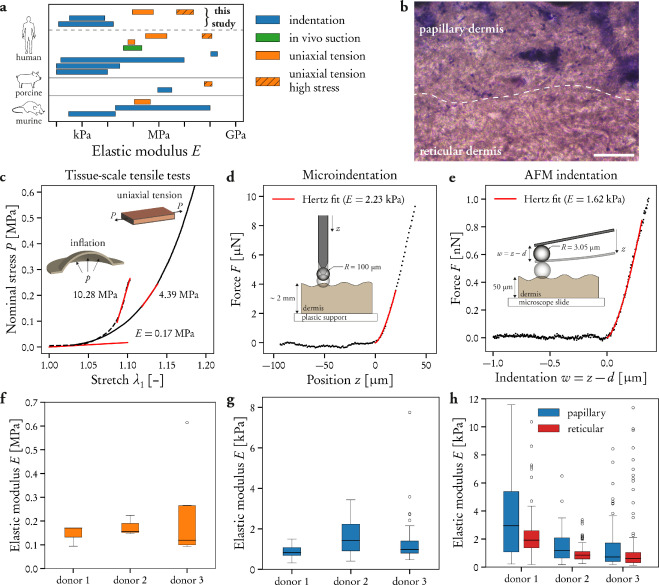
(a) Ranges of elastic moduli of human, murine, and porcine skin reported in literature and measured in this study using different testing techniques (indentation, uniaxial tension, and in vivo suction). (b) Histological cross-section of the human dermis, showing the cell-dense papillary layer (top) and the sparsely populated reticular layer (bottom), composed of thick fiber bundles. White dashed line indicates the layer boundary. Scale bar: 100 µm. (c–e) Representative uniaxial tension and membrane inflation (c), microindentation (d), and AFM indentation (e) experiments on healthy human skin tissue. Figure insets show schematics of the measurement techniques. (f–h) Elastic moduli of human dermal tissue measured for three donors in UA tension, microindentation, and AFM indentation . Boxes extend from the lower to the upper quartile of the data, with a line at the median and whiskers extending to the interquartile range.
Here, we analyze the mechanical behavior of skin from the cellular to the tissue length scale through dedicated experiments in order to resolve these discrepancies. To rationalize the data, we develop a multiscale model of the human dermis, which takes the discrete structure of the collagen fiber network, the surrounding ground matrix, and their level of interconnection into account. We show that macroscopic tensile testing can be prone to overestimating the tissue-level elastic modulus in vivo due to the highly nonlinear strain-stiffening behavior arising from the progressive engagement of collagen fibers. In contrast, the fiber network does not contribute to the stiffness measured in AFM-based indentation. Instead, the indentation stiffness measured depends on the composition of the ground matrix. Moreover, the indentation stiffness measured is strongly influenced by the surface topography of the sample, leading to a general underestimation of the material stiffness and an apparent heterogeneity of the modulus measured. Based on our multiscale model, we therefore hypothesized that AFM-based indentation does not activate the deformation mechanism involved in ECM resistance to traction forces exerted by dermal cells. Using stiffness-tunable, dermal-equivalent collagen hydrogels, we demonstrate our hypothesis in that indentation measurements of tissue stiffness at the cell-perception length scale fail to predict dermal fibroblast behavior.
2. Materials and methods
2.1. Skin biopsies
Human skin biopsies were obtained from the biobank of the dermatology department at University Hospital Zurich within the Skintegrity.ch research program (EK 647 and EK 800). The skin biopsies were surplus tissue from female donors who underwent surgery and provided signed informed consent to use the skin for research purposes . The use of surplus skin for biomechanical experiments had been approved by the Ethical Commission of Canton Zurich (BASEC ID: 2017-00684). Skin from three donors (donor 1: 39 years of age, breast skin; donor 2: 32, breast; donor 3: 43, abdomen) were used for the measurement of mechanical properties in uniaxial (UA) tension, microindentation, and AFM indentation (Fig. 1). Biopsies from four additional donors (donor 4: 68, abdomen; donor 5: 22, breast; donor 6: 43, breast; donor 7: 44, abdomen) were used to characterize the mechanical behavior under equibiaxial tension (Fig. 2f). Human skin tissue was kept in Dulbecco’s modified Eagle medium (DMEM; low glucose, Gibco) supplemented with 1% penicillin–streptomycin (P0781, Sigma) at 4 C until sample preparation for mechanical testing, which was performed within 24 h of biopsy collection.
Fig. 2. Multiscale model of the human dermis.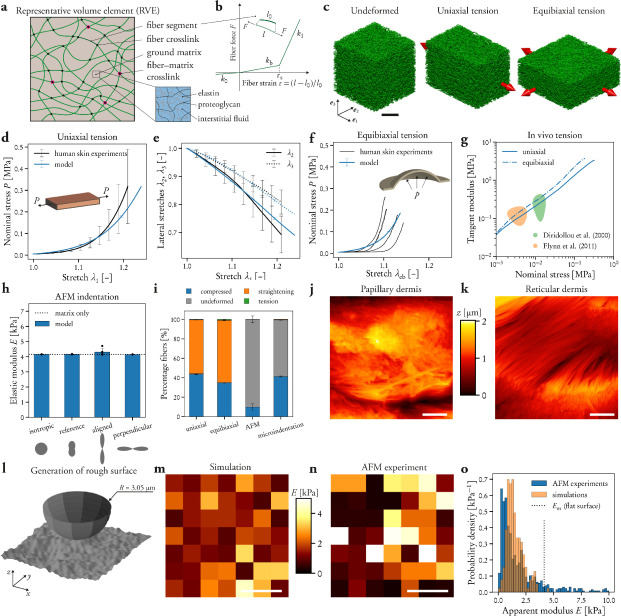
(a) A representative volume element (RVE) is modeled as a composite of a discrete network of collagen fibers (green) embedded in a soft, hydrated ground matrix (beige). Entanglement between the fiber network and the ground matrix is represented by fiber–matrix crosslinks (magenta). (b) A trilinear force–strain law is used to model the elastic behavior of slender fiber segments, with compressive stiffness , unbending stiffness , and tensile stiffness for a taut fiber segment ( ). (c) Rendering of the undeformed fiber network microstructure (left) and upon uniaxial (middle) and equibiaxial (right) stress. Scale bar: 100 µm. (d–g) The model is fitted to uniaxial stress–stretch (d) and kinematics (e) data [16], and is in good agreement with membrane inflation experiments (f) and in vivo data (g; refs. [39], [40]). In g, solid and dash-dotted lines represent model predictions for uniaxial and equibiaxial stress states, respectively. (h) Model prediction of the influence of fiber network orientation on AFM indentation modulus. (i) Distribution of fiber strain in representative uniaxial tension, equibiaxial tension, AFM indentation, and microindentation simulations. (j, k) Representative AFM contact mode topography images of hydrated human papillary (j) and reticular (k) dermis. Note the presence of fiber bundles in the reticular dermis (k), whereas the cross-section surface of the papillary dermis appears more diffuse (j). The color bar applies to both images. Scale bars: 2 µm. (l) Representative 10 µm 10 µm patch of a rough, random surface. The AFM indenter is shown for reference. (m, n) Representative surface distributions of the elastic modulus computed by indentation simulations on a rough, random surface (m) versus measured with the AFM (n). The color bar applies to both images. Scale bars: 10 µm. (o) Distribution of elastic modulus measured by AFM indentation ( ) and reproduced by corresponding simulations on random surfaces ( simulations from 4 random surfaces). The dotted vertical line denotes the equivalent elastic modulus of the ground matrix for a flat surface, cf. h.
Mouse skin biopsies were obtained from adult (7–8 weeks old) wild-type C57BL/6 male mice. The mice were housed in accordance with Swiss animal protection guidelines and were sacrificed in an unrelated study. The backs of the mice were shaved, and the entire back skin was excised carefully. Murine skins were kept in DMEM on ice until sample preparation for mechanical testing, which was performed on the same day as animal sacrifice.
Both human and murine skin biopsies were placed on a graduated mat, and specimens for UA testing with dimensions 40 mm 5 mm (gauge dimensions: 20 mm 5 mm) were cut with a razor blade. We note that the orientation of the human skin biopsies with respect to the body directions was unknown. Excess fat was removed, such that the specimens contained only the epidermal and dermal layers. For the murine skin samples, specimens for UA testing were cut either in the cranio–caudal or the mediolateral direction to assess the influence of in-plane anisotropy. Note that, in addition to dermis and epidermis, the murine skin also contains adipose tissue and a thin layer of subcutaneous muscle (Panniculus Carnosus).
Tissue pieces adjacent to the samples cut for UA tension tests were washed in phosphate-buffered saline solution (PBS; Gibco), quickly dried on tissue paper to remove excess water, embedded in optimal cutting temperature compound (Tissue-Tek, Sakura), and finally snap-frozen in liquid-nitrogen-cooled isopentane. Snap-frozen samples were stored at 80 C. Through-thickness cryosections were prepared for AFM experiments (50 µm thickness) and histology (15 µm) using a cryotome, whereas 2 mm through-thickness sections were cut with a surgical scalpel for microindentation tests. Previous work has demonstrated that the snap-freezing procedure does not affect the tissue properties measured.
2.2. Silicone elastomers
To validate the mechanical testing techniques on a soft, isotropic material that is expected to be homogeneous at the length scales considered, we fabricated samples of a polydimethysiloxane (PDMS) silicone elastomer. PDMS (Sylgard 184, Dow Corning) was mixed at a base-to-crosslinker ratio of 35:1 (w/w). The mixture was degassed in a vacuum desiccator, cast into petri dishes, degassed again, and finally cured in an oven for 4 h at 60 C. Mechanical testing was performed strictly on the day after elastomer preparation to reduce the effect of aging.
2.3. Cell culture and collagen hydrogel preparation
Primary human dermal fibroblasts (FBs) were isolated in our previous study [8] or obtained commercially (C-013-5C, Gibco). FBs were cultured in DMEM+++ (DMEM low glucose, Gibco; supplemented with 10% fetal bovine serum (Gibco), 1% penicillin–streptomycin, and 1% HEPES (1M, Sigma)) at 37 C and 5% CO2 and harvested at passage three to four.
Collagen hydrogels were prepared as described previously. Briefly, FBs were counted and resuspended in DMEM+++ at a concentration of ml . For a final gel volume of 3 ml, 0.4 ml cell suspension was mixed thoroughly with 0.6 ml neutralizing buffer and 2 ml ice-cold acidified type I bovine collagen (5 mg ml , Symatese). Control gels were produced by casting the gel mixture into 6-well inserts (353091, Corning), after which they were allowed to solidify for 15 min in an incubator (37 C, 5% CO2). To create (compressed) gels of higher collagen concentration, some of the gels cast were plastically compressed by means of custom-designed 3D-printed stamps and a stainless steel weight to a final thickness of 0.5 mm. The volume fraction of collagen in control and plastically compressed gels was calculated as 0.23% and 3.36%, respectively, using a mass density of 1.42 g ml for collagen. For biological assays, the cell-containing hydrogels were cultured in DMEM+++ for seven days prior to fixation, with medium change every two to three days. For mechanical testing, acellular versions of the hydrogels were prepared and cultured in DMEM+++ as described above. Mechanical tests were performed three days after gel preparation.
2.4. Histology and immunofluorescence microscopy
Skin cryosections were thawed, washed, fixed in 4% paraformaldehyde (PFA; 28908, ThermoFisher Scientific) for 15 min, and stained with hematoxylin and eosin (H&E; ab245880, Abcam) according to the manufacturer’s protocol. Micrographs were acquired using a Nikon Eclipse Ts2 microscope equipped with a 4X or a 20X objective.Whole-mount immunofluorescence stainings of collagen hydrogels were performed as described previously. Briefly, collagen hydrogels were fixed in 4% PFA at 4 C overnight and subsequently washed in PBS/0.3% Triton-X (PBS-TX) for 6 h. Samples were blocked for 2 h in 10% bovine serum albumin dissolved in PBS-TX, after which they were incubated with the primary antibody at 4 C overnight. Thereafter, samples were washed thoroughly in PBS for at least 24 h, after which antibody incubation was repeated with the secondary antibody. The following antibodies and dilutions were used: mouse anti-Ki67 (1:100; BD550609, BD Biosciences), rabbit anti-mouse IgG (H&L) Alexa Fluor 555 (1:400; A27028, Invitrogen). F-actin was visualized using TRITC-conjugated rhodamine phalloidin (R415, Invitrogen). Cell nuclei were counterstained with DAPI (1:1000; 62248, ThermoFisher Scientific). Gel samples were mounted on glass slides with Fluoroshield mounting medium (F6182, Sigma), and widefield micrographs were acquired with an inverse spinning-disk confocal microscope (Nikon Eclipse Ti-E) equipped with a 10X objective.
For quantification of cell proliferation and spreading area, -stacks of at least 400 µm thickness were analyzed. Cell nuclei and Ki67-positive nuclei were counted manually, and the projected cell area was calculated by manually segmenting each cell using the freehand area selection tool in ImageJ. Cells close to each other where individual outlines could not be distinguished were excluded. Images were only adjusted for brightness and contrast.
2.5. Mechanical testing
2.5.1. Atomic force microscopy
AFM-based indentation tests were performed using a Flex-Bio AFM (Nanosurf). The AFM scanhead was mounted on top of an inverted microscope (Zeiss Axio Observer or Nikon Eclipse Ti-E), which provided optical access to the sample surface and the cantilever position. All samples were immersed in PBS during testing to provide physiological hydration and to eliminate attractive capillary forces between the sample surface and the probe tip. The sample surface was probed using soft cantilevers (0.1 nN nm ; CP-qp-CONT-PS-C, Nanosensors) with a 6.1 µm diameter polystyrene colloidal particle attached to the cantilever tip. Prior to testing, the cantilever spring constant was measured using the Sader method as implemented in the AFM control software (C3000, Nanosurf), and the deflection sensitivity of the photodiode was calibrated in PBS by indenting a rigid glass surface.
Force–distance curves were acquired in force spectroscopy mode with an indentation speed of 1 µm s . A minimum of three 30 µm 30 µm locations per sample were probed; at each location, positions were indented, and the locations were separated by at least 500 µm. For experiments on hydrated human and murine skin cryosections, the cantilever was guided over both the papillary and the reticular layer of the dermis, as identified from the brightfield channel, and force–indentation curves were acquired over each layer separately.
Additional AFM indentation experiments were performed with human dermis either exposed to a hypotonic solution ( PBS) to induce tissue swelling or after treatment with the enzyme hyaluronidase. For the swelling experiments, dermal cross-sections were first tested in PBS as described above. After data acquisition was completed, the scanhead was removed and the immersion solution was exchanged to PBS. AFM experiments were then repeated on the swollen tissue after 15 min of incubation. Separate tissue cross-sections were used for the hyaluronidase experiments. Following control measurements in PBS, the scanhead was removed and the tissue was incubated for 60 min in a 0.5 mg ml hyaluronidase solution (Type I-S, H3506, Sigma). After washing in PBS, AFM indentation experiments were repeated on the digested tissue.
To extract the apparent modulus from AFM force–distance curves, the cantilever deflection and piezo position were first converted to force and indentation , respectively. Force–distance curves without a clear contact point were discarded. Next, a constrained sequential search algorithm was implemented to find the contact point and the corresponding elastic modulus from each – -curve. To this end, each data point is sequentially taken as the trial contact point , and the elastic modulus for this assumed contact point is obtained by fitting the Hertzian contact solution for a rigid, spherical indenter and a flat, elastic half-space to the data, that is, (1) Here, denotes Poisson’s ratio, is the radius of the indenter, and is the indentation depth. Finally, the elastic modulus and the corresponding contact point were taken as the pair that provided the best fit of the data. For the purpose of extracting an apparent modulus and for consistency with literature, a Poisson’s ratio was used. Therefore, the obtained from indentation tests should be interpreted as the apparent modulus of an equivalent isotropic, incompressible material. However, we emphasize that the computational model used to rationalize the experiments does not represent skin as an incompressible solid, see Section 2.7.
2.5.2. Microindentation
Microindentation tests were performed with a micromechanical testing system (FT-MTA02, FemtoTools) by adapting a testing protocol previously developed for soft elastomers [32]. Briefly, high-precision spheres (Sandoz Fils SA) manufactured out of cubic zirconia (200 µm diameter, grade G10) or ruby (1000 µm diameter, grade G25) were glued using a UV-light-cure adhesive (AA3494, Loctite) to the end of force-sensing probes (FT-S1000, FemtoTools), which have a range of µN and a sensitivity of 0.05 µN. The system compliance (0.0012 µm µN ) is negligible (cf. Fig. 1d). Samples for microindentation testing were glued to the bottom of a petri dish using cyanoacrylate glue and immersed in PBS during testing. The PBS used was mixed thoroughly with a small drop of kitchen detergent (per 50 ml PBS) to reduce the surface tension of the liquid, which otherwise exerts spurious forces on the shaft of the force-sensing probe. Force–distance curves were acquired in stepping mode at a displacement rate of 5 µm s . From the force–distance data, the apparent modulus was extracted with the same method as outlined above for AFM indentation.
2.5.3. Uniaxial testing
UA tension tests were performed as described previously. Testpieces were clamped to two axes of a custom-built testing rig (MTS Systems), comprised of horizontal hydraulic actuators, 50 N force sensors, and a CCD camera (Pike F-100B, Allied Vision Technologies), equipped with a telecentric lens (NT55-349, Edmund Optics), which captures top-view images of the deforming testpieces. The samples were immersed in physiological saline solution (0.9% NaCl) during testing and elongated at a nominal strain rate of 0.001 s . Based on our previous work on the time- and history-dependent mechanical behavior of human and murine skin, we selected the strain rate low enough that the response observed was representative of the long-term tissue behavior. The nominal stress was calculated as , where is the force measured, is the reference width of the sample, and is the thickness in the undeformed state. For the skin biopsies, the thickness was estimated from images of histological cross-sections, whereas for collagen hydrogels and PDMS elastomers, the thickness was measured using a brightfield microscope (LSM 5 Pascal, Zeiss). The local in-plane principal stretches, and , were extracted from the sequence of top-view images by tracking the displacement of fiducial markers in the center of the testpiece using a custom-written optical flow tracking algorithm. The elastic modulus was defined as the initial slope of the stress–stretch curve, which was calculated by a linear fit of the stress–stretch data up to 2% linear strain. The tangent modulus was computed as a measure of stiffness at larger stretches.
Due to the soft and highly nonlinear behavior of the skin, the identification of a zero-stress reference state in ex vivo tension experiments is complicated. In line with our previous work, a small threshold stress kPa was used to define the experimental reference criterion (Fig. S1b). Note that this is required to ensure that the sample is taut , and the magnitude is within the range of estimates of the in vivo skin tension (1 kPa . In contrast, a clear transition point between the initial, bending-dominated alignment phase, during which the slack sample becomes taut, and the subsequent stretching phase can be identified in the force–displacement curves for collagen hydrogel and PDMS samples, which was used as a reference criterion for these materials.
2.5.4. Equibiaxial testing
The equibiaxial response of human skin was characterized using a custom-made membrane. Briefly, circular samples of approximately 45 mm diameter (abdominal skin) or 25 mm (breast skin) were cut with a surgical scalpel and fixed between two concentric, annular clamps (free diameter 30 mm or 18 mm), epidermal side facing up. The clamps were fastened on top of an inflation chamber, which was subsequently infused with physiological saline solution to inflate the sample by means of a syringe pump (PhD Ultra, Harvard Apparatus). The syringe pump actuation was controlled by a LabView (National Instruments) code to achieve a pressure-controlled inflation of the sample at a pressure rate of 0.1 kPa s . The inflation pressure was measured with a pressure sensor (LEX 1, Keller), and top- and side-view images of the bulging membrane were captured using CCD cameras (GRAS-14S5C-C, Point Grey Research). The top camera was equipped with a telecentric lens to eliminate the zoom effect arising from the vertical motion of the inflating sample. The top- and side-view image sequences were used to measure the in-plane principal stretch and the radius of curvature at the apex of the sample, respectively. The equibiaxial Cauchy stress was approximated using Laplace’s law. Since the stretch in thickness direction, , is not measurable in this setup, the Cauchy stress was converted to nominal stress, (Fig. 2f). Note also that this corresponds to a homogenized stress across the tissue thickness; that is, the effect of bending is neglected.
2.6. Measurement of surface topography
To measure the surface topography of dermal cryosections used for AFM indentation, we imaged 10 µm 10 µm surface regions at pixel resolution using the AFM in contact mode. Prior to imaging, the samples were fixed in glutaraldehyde (2.5% in PBS) and washed thoroughly with filtered PBS. AFM imaging was performed in PBS using cantilevers with a circular-symmetric tip shape ( 10 nm nominal tip radius; qp-SCONT, Nanosensors). Image quality was optimized by tuning the set point (0.25 nN) and the feedback gains until trace and retrace lines coincided. Topography images were corrected for plane tilt and displayed as heat maps using perceptually uniform colormaps (Fig. 2jk). The surface topography of hydrated skin sections used for microindentation testing was measured using a 3D laser scanning confocal microscope (VK-X250, Keyence) equipped with a 20X objective.
The surface height was scanned with a 0.5 µm step size in -direction. An area of 500 µm 500 µm in the dermis was analyzed. The height data obtained were corrected for plane tilt, smoothed with an S-filter, and the root-mean-square (RMS) height was computed using Keyence MultiFileAnalyzer software.
2.7. Computational models
Based on our previous work, we model the long-term equilibrium behavior of the human dermis and dermal-equivalent collagen hydrogels by combining a discrete representation of the collagen fiber network and a hyperelastic continuum description of the ground matrix (Fig. 2a). The simplification to only consider the dermal layer in the model for human skin is motivated by UA tension experiments comparing the behavior of full-thickness skin with that of dermis and epidermis individually after enzymatic digestion of the basement membrane. Because the experiments were performed at low strain rates and small Péclet numbers, time-dependent viscoelastic and poroelastic contributions to the tissue response are neglected in our model formulation.
2.7.1. Fiber network generation
The collagen fiber network is modeled as a set of slender fibers, which intersect and interact mechanically at crosslinks. The average coordination number of the fiber network is , representing the formation of a crosslink between two longer fibers. We assume that crosslinks transmit forces but not moments, and that they are distributed randomly and uniformly throughout a representative volume element (RVE) of the tissue.
The procedure for generating three-dimensional discrete fiber networks consists of three principal steps, cf.. First, fiber crosslinks are seeded randomly in a cuboid domain of side length at the density . Here, denotes the size of the computational domain and is the maximum length of a fiber segment. Next, each crosslink is connected to four of its neighbors. We define a fiber segment as the line segment connecting two crosslinks. For each crosslink, we identify fiber segments by a random weighted choice process, sampling among its neighboring crosslinks located within a sphere of radius . Here, a gamma distribution with shape parameter and scale parameter µm is chosen for the fiber lengths, such that the mean fiber length equals. To avoid generating arbitrarily long fibers, the gamma distribution is cropped at and renormalized. The distribution of fiber in-plane and out-of-plane angles is prescribed by a girdle-type Dimroth–Watson orientation distribution with concentration parameter; this results in a transversally isotropic network with fibers concentrated around the membrane plane. Note that we here neglect possible in-plane anisotropy because no information on the orientation of the skin biopsies with respect to the body axes was available. Nonetheless, by varying the orientation distribution, a wide range of network architectures can be generated; the probability density functions used for generating various network microstructures are documented in Supplementary Table S4 and illustrated in Supplementary Fig. S5.
Finally, fiber segments outside the computational domain are removed, and fiber segments intersecting the boundaries are cropped to the intersection point. Since these fibers are cropped along their axis, their length is reduced but their orientation is preserved. To visualize the networks generated, the open-source ray-tracing software POV-Ray (version 3.7, Persistence of Vision Raytracer Pty. Ltd.) was used.
2.7.2. Matrix–network coupling
The ground matrix, composed of interstitial fluid and the remaining solid constituents, is modeled as a continuum, which is interconnected with the collagen fiber network at a subset of the fiber network crosslinks (Fig. 2a). Here, we consider the matrix and the network to be only weakly entangled and thus deform independently (no coupling). This assumption is based on a multiscale comparison with a model for which the phases are strongly coupled at the length scale of the fiber network crosslink-to-crosslink distance. This latter case is implemented by including all internal fiber network crosslinks in the set of nodes used to mesh the ground matrix. In the case of no matrix–network coupling, no internal fiber network crosslinks are included in the matrix mesh.
Constitutive models
The mechanical behavior of slender, rope-like collagen fibers is represented phenomenologically by a trilinear force–strain relationship for the fiber segments (Fig. 2b). The fiber segments are assigned a low stiffness under compression , a stiffness in the straightening regime and a high stiffness once the fiber segment becomes taut . Here, the fiber strain with and being the current and reference length of the fiber segment, respectively.
We describe the long-term equilibrium behavior of the ground matrix by a compressible neo-Hookean model superposed with the Donnan osmotic pressure that arises due to fixed charged groups associated with the proteoglycans. Thus, for a local state of deformation characterized by the deformation gradient , the left Cauchy–Green deformation tensor , and the volume ratio , the strain-energy density in the matrix reads Accordingly, the Cauchy stress in the matrix is computed as (4) where is the identity tensor and the Donnan osmotic pressure is given by Ehlers et al. Herein, is the ideal gas constant, is the absolute temperature, is the fixed charge concentration ( being its value in the reference configuration), is the NaCl concentration in the external bath, is the reference solid volume fraction, and is a constant to ensure a stress-free reference configuration.
2.7.4. Material parameters
The volume fraction of collagen in the tissue, , is related to the topology of the fiber network. In fact, for a fiber network with a crosslink density , an average nodal coordination number , and average fiber segment length and diameter. For human dermis, we assume a water content and a collagen content of 75% per dry tissue weight, yielding a collagen volume fraction of . Based on scanning electron microscopy (SEM) images of papillary dermis [50], we take an approximate average fiber segment length µm, from which the fiber diameter and the crosslink density were as 2.37 µm and µm , respectively. The fiber stiffness in unbending and tension, the fiber slackness , the concentration parameter of the fiber out-of-plane orientation , and the matrix shear stiffness were tuned to match data from our previous UA tension experiments on human skin.
In particular, governs the ratio between in-plane and out-of-plane lateral contraction, influences the overall compressibility but has little effect on the uniaxial stress and determine the shape and magnitude of both the stress and the lateral contraction. In the model comparison with UA and equibiaxial data, we take into account the threshold stress used to define the reference configuration in experiments. For the collagen hydrogels, the volume fraction of collagen is known from the material composition (Section 2.3). Based on SEM images (cf. Fig. 3a), we take a representative average fiber segment length µm and a fiber diameter nm. . The fiber orientation distribution is assumed isotropic. Finally, due to the large aspect ratio and straightness of the fibers (Fig. 3a), we set the compressive stiffness µN and the fiber slackness. The fiber stiffness in tension and the shear stiffness of the matrix are then tuned to match the UA tension and kinematics data. Because of the lack of fixed charges in the collagen hydrogel, the Donnan contribution to the matrix stress is neglected.
Fig. 3. Multiscale mechanical properties of dermal-equivalent collagen hydrogels. 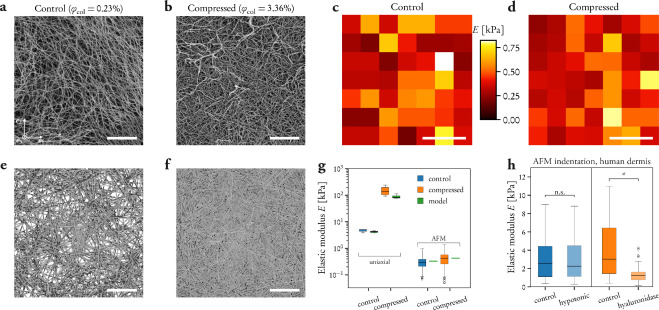
(a, b) Scanning electron micrographs of control (a) and plastically compressed (b) collagen hydrogels. Scale bars: 5 µm. (c, d) Surface distribution of AFM indentation measurements from representative control (c) and compressed (d) gels. The color bar applies to both images. Scale bars: 10 µm. (e, f) Top-view rendering of representative fiber network models of control (e) and compressed (f) gels. The material parameters for compressed hydrogels are derived directly from the control hydrogels and simulations of the compression process without further parameter fitting, see Supplementary Methods S4.3.2 and Supplementary Fig. S6. A summary of all material parameters used can be found in Supplementary Table S5.
2.7.5. Numerical simulations
The algorithms and data structures for generating fiber networks, meshing and coupling the matrix, and preparing finite element models are written in Python (version 3.7.6, Python Software Foundation), making use of the open-source scientific computing packages NumPy, SciPy, and Numba. Mechanical boundary value problems are solved using the implicit solver in Abaqus/Standard (Abaqus 6.14-1, Dassault Systèmes), with the constitutive model for the matrix implemented as a user-defined material (UMAT). Fiber segments are discretized with axial connector elements (CONN3D2), whereas linear tetrahedral elements (C3D4) are used for the matrix. Further details on the fiber network model, including numerical stabilization methods and an RVE size convergence analysis.
To compute the homogenized macroscale response, affine displacement boundary conditions are applied to the boundary nodes of fibers and matrix of the RVE. Traction-free surfaces under the constraint of affine displacements at the boundary are approximated by leaving the normal displacement of a traction-free surface as a solution variable, which is then computed as part of the numerical solution in order to ensure energy minimization.
From the reference position vectors of the boundary nodes and the corresponding nodal reaction forces, calculated upon application of the boundary conditions, the homogenized first Piola–Kirchhoff stress tensor can be computed. Swelling in response to a change in the external salt concentration was implemented by treating as a temperature-like field variable, which is accessed at the integration point level in the UMAT subroutine.
For simulation of indentation tests, the contact between a rigid, spherical indenter and the surface of the model domain is modeled as hard frictionless contact. Symmetry boundary conditions are imposed on the bottom surface as well as on the lateral surfaces of the domain. The force–displacement response is extracted from the imposed displacement and resulting reaction force on the reference point of the rigid body. Analogous to the data analysis of indentation experiments, the apparent elastic modulus is obtained from the simulation data by fitting the force–indentation curve to the Hertzian contact solution.
To compute the local stiffness within a 3D fiber network in a manner similar as probed by a dermal fibroblast, we model the contractile action of a polarized cell as a force dipole (cf. refs. The dipole is represented by the line segment connecting two fiber network crosslinks and is modeled as an axial connector element (CONN3D2) in Abaqus. We prescribe a 10% contraction of the dipole and extract the resulting force the structural stiffness associated with this contraction is computed as being the axial displacement of the dipole.
2.7.6. Simulating the effect of surface topography
The random surfaces were imported into the finite element software Comsol Multiphysics® (version 5.4, COMSOL AB). Three-dimensional finite element models of the AFM indentation setup were created, and the domains were meshed with linear tetrahedral elements. The contact between the rigid, spherical indenter and the random surface was modeled as frictionless, and normal contact was implemented using the penalty method. To test whether the heterogeneous distribution of elastic moduli measured in AFM indentation experiments can be explained by surface topography rather than material heterogeneity, the material behavior was defined by the hyperelastic model for the ground matrix (Eq. (4)), that is, homogeneous. Indentation simulations were performed at positions in a 30 µm 30 µm grid on this surface and analyzed analogously as the AFM experiments.
2.8. Data analysis
All data analysis was performed in Python (version 3.7.6, Python Software Foundation). Data are presented as mean standard deviation, shown in standard boxplots, or visualized in form of the probability density function (Fig. 2o). Boxplots shown in logarithmic scale (e.g., Figs. 3g, 4h) were computed based on the log-transformed data. Where relevant, significant differences denoted by an asterisk) between two groups were analyzed using two-sided Student’s -test or Mann–Whitney U-test depending on the outcome of a Shapiro–Wilk test for normality. The -values and sample sizes are reported in the respective figure legends.
Fig. 4. Fibroblast mechanobiology in stiffness-tunable, dermal-equivalent collagen hydrogels. 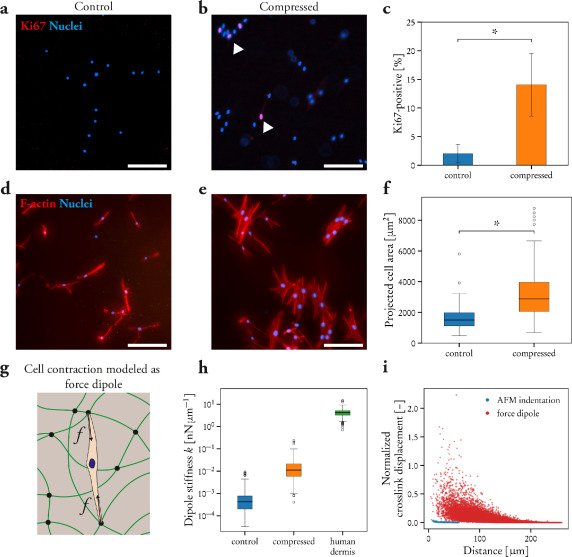
(a–c) Representative whole-mount immunofluorescence micrographs of human dermal fibroblasts embedded in collagen gels and stained for the proliferation marker Ki67 (a, b), showing the higher cell proliferation rate in compressed gels (c; , , Student’s -test). White arrowheads highlight Ki67-positive nuclei in the compressed gel (b). (d–f) Representative whole-mount F-actin immunostainings (d, e) demonstrate larger cell size in stiffer, plastically compressed gels (f; , from three independent experiments, Mann–Whitney U-test). Scale bars (a, b, d, e): 200 µm. (g) Analysis of microscale tissue mechanics as perceived by a polarized cell in vivo by modeling cell contraction as a force dipole. (h) Simulation of the dipole stiffness resulting from a 10% cell contraction in control and compressed collagen hydrogels compared to the human dermis in vivo ( dipoles from 3–5 random networks). (i) Displacement magnitude at fiber crosslinks under AFM indentation and force dipole contraction as a function of distance from the contact point and the dipole center, respectively. The displacement data are normalized by the AFM indentation depth and half the axial displacement of the dipole, respectively. 3. Results 3.1. Mechanical properties of human skin across length scales To illustrate the large variations in existing data on the elastic modulus of skin, we collected literature data from the last twenty years and grouped them by animal species (human, mouse, pig) and testing technique used (indentation, in vivo suction, uniaxial (UA) tension), see Fig. 1a. (Further information is provided in Supplementary Note S1 and Table S1.) We focused on experiments assessing the mechanical behavior of the tissue at low strain rates, thus excluding dynamic measurements such as those based on shear wave elastography [58]. In line with previous observations [26], macroscopic tensile testing appears to yield much larger moduli than indentation-based testing (compare orange and blue bars in Fig. 1a), although large variations in the latter are apparent, both within and between studies. This points at general challenges related to indentation testing of highly deformable materials. In fact, when probing the mechanical properties of soft materials locally with a compliant sensing element, such as the cantilever of the AFM, proper testing conditions that eliminate spurious forces between the probe tip and the surface are essential. For example, we estimate that attractive forces due to surface tension under ambient conditions may be orders of magnitude larger than the elastic contact forces expected, thus biasing the results (see details in Supplementary Note S1.2).
Next, we analyzed whether differences in testing conditions as well as inherent biological variations between donors could explain the large differences in moduli measured. To this end, we tested the mechanical properties of human dermis (Fig. 1b) using different techniques (see Section 2.5): uniaxial and equibiaxial tension, microindentation (indenter radius µm), and AFM indentation ( µm) (Fig. 1cde). All experiments were performed with the tissue immersed in physiological buffer solution. Tensile tests were performed at low strain rates to characterize the elastic long-term equilibrium behavior of the tissue, whereas indentation experiments used a displacement rate leading to small Péclet numbers. Thus, fluid flow is much faster that the deformation rates applied, and the measurements correspond to the long-term response of the tissue. From UA tension tests, we calculate the elastic modulus as the initial slope of the nominal stress–stretch curve (Fig. 1c). For comparison, note that the tangent moduli extracted at higher stresses can be orders of magnitude larger due to the strong strain-stiffening behavior (cf. Fig. 1ac), which is particularly prominent in biaxial tension (Fig. 1c). From the indentation data, we determine an apparent elastic modulus by fitting each force–indentation curve to the Hertzian solution for the contact between a rigid, spherical indenter and a flat, elastic half-space (Section 2.5.1). Remarkably, only minor differences between donors were detected with all three measurement techniques (Fig. 1fgh). In particular, the variability between donors is not larger than that observed for each donor individually. The scatter observed in the tensile modulus (Fig. 1f) is related to the variability in collagen and interstitial fluid content of each test piece, as reported previously for other soft tissues (e.g., refs. [59], [60]). The intradonor variability in indentation experiments (Fig. 1gh) is more significantly affected by surface topography, as shown in Section 3.2. Importantly, the data in Fig. 1fgh reproduce the difference in modulus by several orders of magnitude between microscale indentation and macroscale tension (cf. Fig. 1a). Indeed, whereas the elastic modulus measured in macroscale UA tension is on the order of 100 kPa to 200 kPa, the modulus measured by both micro- and AFM indentation is two orders of magnitude lower (compare Fig. 1f with gh). Furthermore, despite the difference in microstructure between the papillary and the reticular dermis (Fig. 1b), the stiffness of these layers is similar when measured by AFM (Fig. 1h). Additionally, in agreement with previous works , the AFM data for each donor contain large variations itself, from 0.1 to 10 kPa. Similar results were obtained when repeating the experiments on wild-type mouse skin, both in terms of a two orders of magnitude difference between the moduli measured in UA tension versus AFM indentation as well as the large scatter in the moduli measured at the microscale by AFM (Supplementary Fig. S8). We also validated our testing protocols on samples of a soft PDMS elastomer (Supplementary Fig. S7), confirming that identical are measurable with all testing techniques for a material that may be regarded as a homogeneous continuum at all length scales considered. These results demonstrate that neither testing errors nor biological variations can account for the discrepancies in moduli observed, and we therefore hypothesized that they might originate from the composition and structure of the materials considered. 3.2. A fiber network model of the human dermis can rationalize measurements across scales The human dermis, composed primarily of collagen fibers (volume fraction ), interstitial fluid ( ), elastin ( ), and proteoglycans ( ), is the load-bearing layer of the skin [3]. A simplistic explanation for the large range of moduli observed (Fig. 1a) may be derived from a rule-of-mixture analysis. Given a tensile modulus of collagen fibers 100 MPa to 360 MPa [61] and a matrix modulus kPa, we obtain the (approximate) upper (Voigt) and lower (Reuss) bounds on the composite modulus, (9) which covers a range from kPa to 20 MPa to 80 MPa. Although the upper bound may be considered a good approximation of the tensile stiffness at high strains when fibers are aligned along the loading direction [62] (cf. Fig. 1ac), the geometrical and topological arrangement of fibers and matrix that corresponds to these bounds is clearly not representative of skin in vivo. The rule-of-mixture bounds therefore provide little information about, for example, the in vivo tissue stiffness and the deformation mechanisms at the microscale. To answer such questions and rationalize the experimental results, we modeled the dermis as a composite consisting of a discrete, random network of collagen fibers embedded in a ground matrix (Fig. 2a; see Section 2.7 for details). This ground matrix is composed of interstitial fluid, elastin, and proteoglycans (Fig. 2a), and we modeled it as a continuum at the length scales considered. In contrast, the collagen fiber network is characterized by intrinsic length scales, such as the density of fiber crosslinks, the fiber segment length, and the cross-sectional dimensions of the fibers. Using data on the dermis composition and its collagen network topology (Section 2.7.4), we generated fiber networks (Fig. 2c) in which fiber segments are modeled as slender, elastic springs with low resistance to compression and with high stiffness in tension (Fig. 2b). Next, constitutive model parameters for fibers and ground matrix were selected to reproduce UA stress–stretch and 3D kinematics data of human skin (Fig. 2de; ref. [16]). The progressive rotation of fibers toward the loading direction explains both the well-known strain-stiffening behavior (Fig. 2d) and the large lateral contractions (Fig. 2e); see also Supplementary Fig. S11. To validate the model on the macroscale, we performed membrane inflation experiments (see Section 2.5.4) to characterize the equibiaxial stress–stretch response ( – ) of human skin (Fig. 2f) and analyzed existing biaxial in vivo data (Fig. 2g; refs. [39], [40], see Supplementary Note S2). The model provides a reasonable prediction of both datasets (Fig. 2fg), including the stiffness at stress states representative of in vivo conditions (Fig. 2g).
We then used the model to analyze the tissue behavior when tested in indentation with the AFM. Here, the model predicts an apparent stiffness that is determined solely by the matrix properties, independent of the local fiber network orientation (Fig. 2h) and the matrix–network coupling (Supplementary Fig. S12e). To understand this result, we calculated the intersection of all fibers with the indentation surface (Supplementary Fig. S9), showing that the phase most likely probed with the AFM is indeed the ground matrix ( of the surface area for the reference network). We then asked whether probing the dermis with a larger indenter would be able to activate the fiber network when a larger subset of fibers is directly within the contact area. This intuitive explanation holds, however, only if the matrix and network are entangled at the microscale and loads can be transferred between the phases (Supplementary Fig. S12f). In contrast, when the matrix–network entanglement is weak, the indentation modulus is close to the modulus of the ground matrix also for the larger indenter, suggesting that the network is able to rearrange to another zero-energy state despite the applied load. Note that this length-scale independence is in fact also observed when comparing the AFM and microindentation measurements (Fig. 1gh), indicating that the corresponding entanglement between the ground matrix and the fiber network in the dermis is weak. To illustrate the underlying deformation mechanism, we compared the distribution of fiber strains under a tensile stress representative of the in vivo state ( kPa) with the fiber strains experienced under AFM and microindentation (Fig. 2i). Grouping fibers as ‘undeformed’ ( ), compressed ( ), straightening ( ), or in tension ( ) (cf. Fig. 2b) demonstrates that a fiber network under macroscale tension includes both compressed as well as stretched, load-bearing fibers. In contrast, fibers in a network under indentation remain essentially undeformed, with no load-bearing fibers and only a larger number of compressed fibers for larger indenter radii.
Although our model explains the difference in stiffness between macroscale tension and microscale indentation data by two distinct deformation mechanisms of the fiber network, the majority of the moduli measured by AFM and microindentation ( 1 kPa to 2 kPa) is lower than that predicted by the model ( kPa). In principle, this prediction could be improved by decreasing the shear modulus of the matrix (Supplementary Fig. S12a), which, however, would compromise the representation of the kinematics in UA tension (Fig. 2e). In addition, our model does not offer an explanation for the large variation in AFM indentation moduli measured (Fig. 1h). These observations led us to hypothesize that the heterogeneity observed is not necessarily due to local differences in material behavior, but a pure geometrical effect arising due to surface roughness, which also reduces the contact area compared to indentations on a flat surface.
To test this hypothesis, we first measured the topography of hydrated dermal cryosections using contact mode AFM imaging (Fig. 2jk). Next, we defined a spectral representation of random surfaces with topographical variations (see Section 2.7.6), which can be parametrized to generate surfaces similar to those measured (Fig. 2l). Using the material model of the ground matrix (equivalent elastic modulus kPa; dotted line in Fig. 2h), we replicated the AFM indentation protocol in silico by finite element simulations, and the simulation data were analyzed analogously as the experiments; that is, assuming Hertzian contact with a flat surface. The surface distribution of moduli obtained shows an apparent heterogeneity (Fig. 2m), qualitatively similar to the AFM experiments (Fig. 2n). Moreover, comparing the probability distribution of simulation data from multiple random surfaces with the entire AFM dataset shows a striking agreement (Fig. 2o). In addition, we note that the shape of the distribution of the AFM modulus for human skin is similar to that measured for both murine papillary and reticular dermis (Supplementary Fig. S8c) as well as that measured previously for human dermis [20]. These results demonstrate that a major part of the variation in AFM data can be explained by surface roughness independent of local material heterogeneity. Moreover, the simulations show that the presence of surface roughness shifts the apparent modulus distribution to lower values than the actual material stiffness (cf. Fig. 2h), which is expected since the true contact area with a rough surface is smaller than the one estimated for a perfectly flat surface.
We further asked whether the effect of topography might be diminishing at the length scale of the microindentation experiments. This would be expected if there is separation of scales between the length scale of indentation and the surface roughness. To this end, we measured the topography of dermal cross-sections used for microindentation tests by laser-scanning confocal microscopy (Supplementary Fig. S14). However, the root-mean-square roughness µm measured is in fact comparable to the indentation depth ( 10 µm). This demonstrates that also the microindentation data (Fig. 1g) are influenced by surface topography, and explains why the moduli measured are indeed lower than those predicted by the model (Supplementary Fig. S12f). 3.3. Indentation testing does not activate the collagen fiber network.
Based on the experiments and corresponding computational analyses (Figs. 1–2), we therefore hypothesized that indentation testing cannot be used to activate the load-bearing mechanism of the collagen fiber network in the dermis. To challenge this hypothesis, we first made use of dermal-equivalent collagen hydrogels as a simple model system for which the volume fraction of collagen fibers is tunable toward that of the native tissue ( ) by plastic compression [63]. We measured the elastic modulus of control gels ( ; Fig. 3a) and denser gels that underwent plastic compression ( ; Fig. 3b) in AFM indentation (Fig. 3cd), microindentation ( µm, see Supplementary Fig. S15), and in UA tension. To corroborate the experiments, we developed fiber network models of the two materials based on their composition and network topology as well as simulations of the plastic compression process (Fig. 3ef; see Section 2.7.4 for details). As expected, macroscale tension experiments clearly distinguish the difference between the two materials (Fig. 3g). Conversely, both AFM (Fig. 3g) and microindentation (Supplementary Fig. S15a) measurements show that the indentation modulus of the two materials is similar, despite the almost 15-fold difference in collagen concentration. Note also the large difference between tensile and indentation moduli for both materials, which is in line with the human skin data (Fig. 1). The fiber network model predicts both the concentration-dependent tensile stiffness as well as the concentration-independent indentation stiffness (Fig. 3g), confirming the hypothesis that indentation does not engage the fiber network.
To test the hypothesis for the case of human dermis, we exposed the dermis to a hypotonic solution ( PBS), which causes tissue swelling and thus leads to a state of extension in the collagen fibers. If the fibers were bearing load under AFM indentation, the swollen tissue would be perceived stiffer because of the strain-stiffening behavior of the fibers (cf. Fig. 2b). In contrast, we observe a stiffness that is independent of the state of swelling (Fig. 3h, left), in line with our hypothesis. Moreover, our simulations have indicated that the ground matrix is the primary determinant of the tissue indentation stiffness (Fig. 2g). To directly assess this conclusion, we treated dermal sections for AFM indentation with hyaluronidase in order to reduce the content of hyaluronic acid, which, despite being a minor tissue component, contributes to tissue hydration and the gel-like state of the ground matrix [64]. Interestingly, digestion of hyaluronic acid causes a significant decrease in the AFM stiffness measured (Fig. 3h, right), again aligned with our model predictions.
3.4. Implications for dermal cell mechanobiology
Indentation measurements offer the possibility to probe the tissue at the length scale of cells ( 10 µm to 100 µm) and subcellular structures such as focal adhesions ( µm). However, our experiments and model predictions indicate that, for skin and collagen hydrogels, indentation does not deform the collagen fiber network, which is the tissue structure dermal cells attach to and activate through focal adhesions to probe their environment. Intriguingly, similar results have recently been reported for synthetic fibrous hydrogels. These results question the use of indentation measurements to infer the stiffness perceived by dermal cells.
To test this conclusion experimentally, we embedded primary human dermal fibroblasts in control and plastically compressed collagen gels and analyzed two established markers of stiffness-dependent cell response in 2D culture: proliferation [66], [67] and cell spreading [68], [69]. In line with previous 2D studies, we observe by whole-mount immunofluorescence microscopy that fibroblasts in the stiffer, plastically compressed gels are more proliferative (Fig. 4a–c) and spread to larger area (Fig. 4d–f) than cells in the softer control gels. These results could not have been predicted solely based on AFM data. Instead, to estimate the stiffness sensed by a resident cell in three-dimensional fibrous networks, we model the contractile action of a polarized cell as a force dipole acting on fiber crosslinks (Fig. 4g). In contrast to the AFM results (Fig. 3cdg), the force dipole simulations predict that the collagen concentration strongly influences the cell traction forces, suggesting that dermal cells would be able to distinguish between the two materials as well as between the comparatively low-concentration hydrogels and the native dermis (Fig. 4h). To illustrate the underlying deformation mechanisms of the fiber network that explain the difference between cell contraction and AFM indentation, we compare the displacement fields in the vicinity of the dipole and the contact point, respectively (Fig. 4i). Here, force dipole simulations result in a long-ranged fiber engagement and crosslink displacement decay (Fig. 4i, red dots), which has been observed in collagen gel tissue models [9]. Noteworthy, this state of deformation cannot be reproduced by indentation (Fig. 4i, blue dots).
4. Discussion
The elastic modulus is a concept of continuum mechanics whose application to soft biological tissues is not straightforward. Its definition as the initial slope of the uniaxial stress–strain curve implies the definition of a reference configuration, which does not exist a priori. At least, a unique definition is lacking both in vivo (due to the physiological residual tension) and in ex vivo testing (because of the lack of a clear transition between sample straightening and stretching, see Supplementary Note S1.1). An extended definition of the elastic modulus as the slope at a given level of stress (i.e., the tangent modulus) requires additional information about the specific loading conditions and the stress and strain measures used. Although the term ‘elastic’ indicates that the deformation is assumed fully reversible upon unloading, the concept is frequently used independent of the nature of the material behavior, as soft tissue properties generally depend on both time and loading history. For human and murine skin, poro- and viscoelasticity play a particular role in this regard as indicated in our recent study, and we have designed the here-presented experiments to keep their influence on the results at a low level. Perhaps most critical, the modulus as a continuum-mechanical quantity implies that the tissue can be regarded as a homogenized material at the length scales considered. In particular, when soft connective tissue properties are analyzed at a length scale comparable to the geometrical features of the collagen fiber network, such as in the case of AFM indentation, this continuum hypothesis becomes invalid. These limitations are affecting the essential task of characterizing the rigidity of soft biological tissues at macroscopic and cellular length scales, which is important for manifold biomedical applications. It is therefore both useful and admissible to describe the stiffness perceived at different length scales and under different loading conditions in terms of ‘apparent’ elastic moduli, leading to the large discrepancies in the values reported (Fig. 1a).
Here, we addressed these discrepancies by analyzing the underlying physics governing human skin mechanics from tissue down to cellular length scales. Based on a multiscale model of the human dermis, we explain the macroscale stiffness in vivo and at physiological and supraphysiological stresses as a result of the activation of the collagen fiber network: under an applied tensile stress, fibers rotate toward the loading direction and contribute to bearing the load [62]. This strain-stiffening behavior (Fig. 1c) is accompanied by large lateral contractions (Fig. 2e) and volume loss [16]. In contrast, when the tissue is indented or, more generally, compressed (Supplementary Fig. S11), the combination of the weak load-bearing capability of fibers under compression (Supplementary Results and Discussion S5.4) and the weak entanglement with the surrounding ground matrix (Supplementary Fig. S12) allows the fiber network to rearrange and avoid bearing load. We confirmed this interpretation both experimentally and computationally using a stiffness-tunable model system based on plastically compressed, dermal-equivalent collagen hydrogels (Fig. 3).
Although our model representation is a clear simplification compared to the actual microstructure of the human dermis, it is able to predict the mechanical behavior of skin under various states of deformation at both the macro- and the microscale (Fig. 2) as well as under more complex boundary conditions that include altering the osmolarity of the external bath (Supplementary Fig. S13). Noteworthy, this is achieved despite a simple model representation of collagen fiber segments as nonlinear, one-dimensional springs. These aspects may explain the small subset of AFM data for which the apparent modulus is larger than that of the matrix and thus cannot be explained by surface topography (Fig. 2o). Note, however, that these ‘stiff’ AFM data points ( 5 kPa to 10 kPa) are orders of magnitude softer than the tensile modulus of collagen fibers ( 100 MPa to 360 MPa, [61]). In fact, we are able to recover this subset of AFM data by simulating indentations directly on top of fiber network nodes (Supplementary Fig. S9c). Noteworthy, even in the case of direct indentation on a fiber cross-section, long-range displacement decay like that observed due to cell contraction (Fig. 4i) is still not activated since the fiber network is loaded in compression rather than tension (Supplementary Results and Discussion S5.2).
The ground matrix also plays an important role in the mechanics of soft connective tissues by supporting compressive loads and stabilizing the material behavior in lateral directions under tensile loading (Supplementary Results and Discussion S5.4). Here, we describe the distortional and dilatational behavior of the ground matrix with a simple, phenomenological continuum model. While the water-retaining osmotic effect resulting from ion imbalance due to charged glycosaminoglycan chains attached to the proteoglycan core proteins is accounted for explicitly, the physicochemical origin of the distortional stiffness of the ground matrix is less obvious. In the dermis, the existence of a hydrated, gel-like network of crosslinked hyaluronic acid and proteoglycans, entrapped within the collagen meshwork, motivates a resistance to changes in shape. This is confirmed by indentation experiments following enzymatic digestion of hyaluronidase (Fig. 3h). Moreover, other solid constituents (e.g., elastin, fibronectin) are also likely to contribute to the shear stiffness of the ground matrix. We expect such fibrous components to be primarily in a stretched state within the tissue so that the difference between their tensile and compressive response does not affect the mechanical behavior of the ground matrix. Noteworthy, all such constituents are lacking in collagen gels. This is particularly fascinating since the matrix shear modulus is the most influential parameter determining the indentation modulus, which therefore is key to predicting the AFM and microindentation experiments. In collagen hydrogels, the low but non-negligible shear stiffness of the matrix may arise from an ordered structure of water molecules associated with the hydrophilic polymers; it has been proposed that these water molecules are restricted in their motion and cannot displace or rotate independently of their neighbors.
The ECM stiffness perceived by dermal cells is a quantity of primary interest for applications in skin mechanobiology and tissue engineering. Whereas the cell-relevant ECM stiffness has commonly been interpreted as the modulus measured using AFM indentation at the length scale of cells, we have demonstrated that such measurements do not necessarily represent the ECM stiffness perceived by resident cells, as the corresponding deformation mechanisms are distinct. In fact, cell behavior in stiffness-tunable, dermal-equivalent collagen hydrogels does not correlate with the results of indentation measurements (Figs. 3–4). The strongly loadcase-dependent mechanical behavior of connective tissues (Fig. 3g), which originates in the tension–compression nonlinearity of rope-like fiber segments, is in stark contrast with that of common homogeneous material model systems in mechanobiology (e.g., PDMS elastomers and polyacrylamide hydrogels. Alternative techniques, for example based on optical or magnetic manipulation of micrometer-sized beads or rods embedded within the ECM and corroborated by appropriate models of the microstructure, may therefore be more suitable to assess ECM stiffness as perceived by single cells. We expect the present results to apply to a wide range of native and reconstituted soft connective tissues with similar composition and microstructure.
Data availability The raw/processed data required to reproduce these findings are available upon request.
Jamming Transitions in Astrocytes and Glioblastoma Are Induced by Cell Density and Tension
by Urszula Hohmann, Julian Cardinal von Widdern, Chalid Ghadban, Maria Cristina Lo Giudice, Grégoire Lemahieu, Elisabetta Ada Cavalcanti-Adam, Faramarz Dehghani and Tim Hohmann
Cells 2023, 12(1), 29; https://doi.org/10.3390/cells12010029
Submission received: 20 September 2022 / Revised: 7 December 2022 / Accepted: 17 December 2022 / Published: 21 December 2022
Abstract
Collective behavior of cells emerges from coordination of cell–cell-interactions and is important to wound healing, embryonic and tumor development. Depending on cell density and cell–cell interactions, a transition from a migratory, fluid-like unjammed state to a more static and solid-like jammed state or vice versa can occur. Here, we analyze collective migration dynamics of astrocytes and glioblastoma cells using live cell imaging. Furthermore, atomic force microscopy, traction force microscopy and spheroid generation assays were used to study cell adhesion, traction and mechanics. Perturbations of traction and adhesion were induced via ROCK or myosin II inhibition. Whereas astrocytes resided within a non-migratory, jammed state, glioblastoma were migratory and unjammed. Furthermore, we demonstrated that a switch from an unjammed to a jammed state was induced upon alteration of the equilibrium between cell–cell-adhesion and tension from adhesion to tension dominated, via inhibition of ROCK or myosin II. Such behavior has implications for understanding the infiltration of the brain by glioblastoma cells and may help to identify new strategies to develop anti-migratory drugs and strategies for glioblastoma-treatment.
Keywords: glioblastoma; migration; collective migration; jamming; unjamming; adhesion; tension; astrocytes
1. Introduction
Astrocytes are the most abundant cells in the central nervous system (CNS). Despite their numerous and region specific functions, astrocytes are also considered as support cells for neurons and are important for the maintenance of stable structures in the CNS, such as, e.g., the blood brain barrier [1,2,3]. To allow formation of stable structures under physiological conditions, astrocytes have to be mostly immobile. Nevertheless, under certain pathological conditions, e.g., during wound healing, astrocytes can become motile or as observed in astrocytoma or glioblastoma (GBM), transform into highly mobile and migratory tumor cells [4]. GBM belongs to one of the most deadly tumor entities, with a median survival time of approximately 14 months. Besides its therapy resistance, GBM prognosis is poor due to its infiltrative nature, invading into the adjacent, healthy brain tissue. Colonization of brain tissue happens in the form of single cells or in a collective manner, preferentially along pre-existing structures such as blood vessels or white matter tracts as branched networks or collective strands. A complex self-interacting network of biochemical and biomechanical cues controls the dynamic of single cells and collective motility. Regardless of the exact way of infiltration, a critical step for brain colonization is the attainment of a migratory phenotype of GBM cells that was not present in the cells of their origin.
Earlier studies demonstrated that cells of epithelial origin can undergo such a transition and its inverse, similar to a (un-)jamming transition in soft matter, where cells attain an (im-)mobile phenotype. Thereby, jammed matter has energy barriers between cells that are sufficiently high to hinder reorganization of the cell layer effectively, leading to fixed cell positions in relation to neighboring cells. The jamming transition is accompanied by a continuous decrease of cell speeds and an increase in the pack size of collectively moving cells. One path to a jammed, mostly immobile state was governed by an increase in cell density. In these studies, it was suggested that cell density regulates traction forces. On the other hand different studies, both theoretical and experimental, found jamming to be additionally determined by the ratio of surface tension to cell–cell-adhesion. Thereby, increasing tension led to jamming of the cell layer, while increasing adhesion had the opposite effect. Still, the exact role of adhesion is controversially discussed as different studies found increased adhesion to cause jamming instead. Data regarding the collective migration state of cells of glial origin is—to the authors’ knowledge—still lacking.
Nonetheless, the phenomenon of jamming might have a further functional role in glioma invasion as well, potentially being a mechanism for suppressing brain colonization. Supporting this idea, a study by Castro et al found that not only epithelial cells jam and mammary carcinoma cells remain unjammed, but also that the addition of epithelial cells causes a slowdown of carcinoma cells with increasing epithelial cell density [29]. A recent study performed in 3D collagen gels also demonstrated that increased adhesion and confinement of mammary carcinoma cells favors jamming. In a retrospective study of mammary carcinoma, markers for unjamming were proposed as an additional, independent prognostic marker and associated with higher risk. These observations raise the question if and how it is possible to induce a switch from a migratory, unjammed state to a more static, non-migratory and jammed state in glioma cells.
Here, we studied the collective behavior of primary astrocytes and two glioblastoma cell lines. As a result, we found astrocytes to reside in a jammed state, while glioblastoma cells remain unjammed, mostly independent of cell density. A switch from unjammed to jammed could be observed in one glioblastoma line after contractility and adhesion inhibition.
2. Methods
2.1. Cell Culture
All animal experiments were conducted in agreement with directive 2010/63/EU of the European Parliament and European Council (22 September 2010) and tissue collection was approved by the local authorities of the state of Saxony-Anhalt (I11M18).
For experiments, LN229 and U138 glioblastoma cells and primary astrocytes were used. LN229 cells were purchased from the American Type Culture Collection (ATCC, CRL-261, Manassas, VA, USA) and U138 cells were obtained from Cell Lines Service (Cell Lines Service, 300363, Eppelheim, Germany). LN229 cells were cultured using 89% (v/v) Roswell Park Memorial Institute medium (Lonza, Basel, Switzerland, BE12-115F), supplemented with 10% (v/v) fetal bovine serum (FBS, Gibco, Carlsbad, CA, USA, 10500-064) and 1% (v/v) penicillin/streptomycin (P/S, Gibco, Carlsbad, CA, USA, 15140-122). U138 and astrocytes were cultured in 89% (v/v) Dulbecco’s Modified Eagle Medium (Invitrogen, Waltham, MA, USA, 41965-062), and supplemented with 10% (v/v) FBS and 1% (v/v) P/S.
Primary astrocytes were isolated from 1–2 days old Black6/J mice, as described previously. Briefly, mice were decapitated, brains collected and meninges removed. Afterwards, brains were dissociated in Ca2+/Mg2+ free HBSS (Gibco, Carlsbad, CA, USA, 12082739), containing trypsin (Gibco, Carlsbad, CA, USA, 12579069) and DNAse (Worthington Biochemical, Bedford, MA, USA, LS006342). The cell suspension was then transferred to cell culture flasks. For all experiments, astrocytes of passage number one to three were used.
For experiments analyzing collective migration, 300,000–800,000 cells were seeded into one 12-well. In case of astrocytes, an artificial wound was generated scratching the monolayer as reported . Blebbistatin (Tocris, Bristol, UK, 1760) and Y-27632 (Tocris, Bristol, UK, 1254) were used to inhibit myosin II and ROCK, respectively. Substances were applied 1 h prior to the measurements for spheroid aggregation and measurements of collective cell migration or 24 h before measurements for all other types of experiments, to assess equilibrium conditions. Before starting the experiments, culture medium was replaced with fresh medium, containing the respective drugs. All experiments were performed in the presence of the respective treatments.
2.2. Measuring Properties of Collective Cell Migration
Twenty-four hours after cell seeding, cells were transferred to an inverted microscope (DMi 8, Leica, Wetzlar, Germany) equipped with temperature (37 °C) and CO2 (5% (v/v)) control. Images were taken every 3 min for 20 h or 60 h and denoised using block matching 3D transform. To analyze the velocity field of a cell layer, particle image velocimetry was used with a cross-correlation window size of 16 × 16 pixels (pixel size: 0.48 µm). Resulting trajectories closely approximate cellular motions.
Here, N depicts the cell number and Δr is the distance of a virtual particle to its initial position and d the cell diameter. For reasons of comparability, d = 80 px (≈38.4 µm) for all cell types was chosen, corresponding to the cell diameter of astrocytes, the largest of the three used cell types. Q gives the relative number of cells that moved away more than 20% of its cell size from their initial position. For quantification of cooperativity, the 4-point susceptibility χ was calculated.
The peak height of χ is proportional to the number of collectively moving cells in a dense layer, and the peak position corresponds to the pack lifetime. For assessing the shape of cells, cells from the time lapse images were segmented manually every 4 h to calculate the shape index p proposed by Bi et al [26], using the cell’s projected area A and its perimeter P.
From the obtained cell areas, cell density was estimated. Furthermore, to assess caging for each non-boundary virtual particle, it was calculated how many of its eight nearest neighbors at the beginning and end of each measurement were unchanged. Furthermore, the spatial velocity–velocity auto-correlation length was calculated as the characteristic exponential decay length of the auto-correlation function C of the velocity.
2.3. Measuring Properties of Single Cell Migration
For time-lapse microscopy, 1000 cells were seeded in a 12-well plate (Greiner, Kremsmünster, Austria) 24 h prior to the start of experiments. Isolated single cells were imaged every 15 min with a microscope (Leica DMi8, Leica, Wetzlar, Germany) equipped with CO2 (5% (v/v)) and temperature (37 °C) regulation. From these measurements, the average cell speed and directionality were calculated. The directionality was defined as the quotient of the total distance travelled by a cell and the sum of incremental distances the same cell moved between successive frames.
2.4. Determination of Cortex Tension by Atomic Force Microscopy
For measuring the surface tension, sparsely seeded cells were allowed to adhere to a petri dish for 15 min before the experiment. Single cells were measured with a tip-less cantilever (Arrow-TL2, Nanoworld, Neuchatel, Switzerland), applying a force of 1 nN for determining the cortex tension, as described by Cartagena-Rivera et al.
Here T is the cortex tension, k the elastic constant of the cantilever, Z the piezo extension and d the deflection of the cantilever. The cortical tension is considered the upper limit of a force generated by the actin cortex to limit cell deformations. The described experimental setting and all other types of atomic force microscopy measurements are summarized in Figure S13.
2.5. Determination of Elastic Modulus by Atomic Force Microscopy
Additionally, the Young’s modulus of a dense cell layer was measured over a 140 × 140 µm area with a step-size of 7 µm using a CP-qp-SCONT-BSG-A (NanoAndMore, Wetzlar, Germany) cantilever with a 5 µm bead attached to it. The Young’s modulus was calculated using the Hertz model.
With the applied force F (here: 1 nN), the Young’s Modulus is E, Poissons ratio µ, bead diameter R and indentation δ0.
2.6. Determination of Adhesion Energies by Atomic Force Microscopy
Using AFM, the cell–cell adhesion energy between a single cell and a dense cell-layer of the same cell type and treatment was measured. A tip-less cantilever (Arrow-TL2, Nanoworld, Neuchatel, Switzerland) was coated with poly-L-lysine overnight. For cell attachment, the cantilever was pressed onto a freshly suspended, non-adherent cell with 1 nN for 30 s. The cell was then allowed to firmly attach to the cantilever for another 30 min. When firmly attached, the cells elastic modulus was determined and cell–cell adhesion was measured by pressing the cantilever with the cell for 60 s on multiple spots of a dense cell-layer with a force of 0.5 nN. From the obtained retract curves the maximal force of adhesion was calculated. To assure mechanical stability of the attached cell, the Young`s modulus of the attached cell was measured again at the end of all measurements. The measurement set was discarded in cases of deviations of larger than 20% between the initial and final elastic modulus.
2.7. 3D Tumor Aggregate Formation Assay
For cultivation of 3D tumor aggregates, the liquid-overlay method was used. Therefore, 50,000 cells were plated in 96-wells coated with 4% (w/v) agarose, to generate a non-adhesive surface. The plate was shortly centrifuged (50 g, 4 min) and cells were allowed to aggregate for 2 h before starting the imaging process. The delay was necessary to determine the final position of an emerging aggregate. Imaging was performed for up to 68 h, and images were taken every 15 min. As read-outs, the aggregate size and its brightness relative to the background were determined.
For image analysis, we used a custom written MatLab (The MathWorks, Natick, MA, USA) script determining the edge of the 3D aggregate using the Chan-Vese image segmentation model [39], tracking each 3D aggregate over time.
Together with the AFM measurements, the aggregation assay allows the estimation of the cell–cell adhesion energy W.
Here, E denotes the Young’s modulus, d the cell diameter, ν the Poisson ratio, A0 and A∞ the initial and equilibrium projected spheroid area and I0 and I∞ the initial and equilibrium relative brightness. Similarly, as done by Frasca et al., adhesion energy was extracted from the adhesion over time plot after reaching a stable plateau, as the average of the last 50 time points. Reaching of equilibrium was assessed by inspection of the projected spheroid area. The derivation of the model is described in more detail below. For estimation of the cell–cell adhesion using the aggregation assay, we used a modified model introduced by Frasca et al. There, it was concluded that the adhesion energy W for establishing cell–cell contact is given.
with N as the number of cells in the aggregate and V as the volume of a cell or 3D aggregate, respectively.
The Young’s modulus E was measured with the AFM, along with the average cell diameter, being a very good estimate of the initial cell–cell distance d. This assumption is valid, as the diameter of the cells was measured for AFM experiments 15 min after seeding. The 3D aggregate volume is given by V = A*h, with the 3D aggregate projected area A and its average height h. The area A was directly extracted during the aggregation experiments, while the height h can only be indirectly assessed, using: h ~ 1-I, with the measured relative intensity I.
2.8. Fluorescence Staining
For analysis of actin structures, cells were labeled with phalloidin and 4′,6-Diamin-2-phenylindol (DAPI) to stain nuclei. ß-Catenin and N-Cadherin were used for visualization of cell contacts. An amount of 30,000 cells were placed on glass coverslips to create a dense cell layer and incubated for 24 h prior to treatment. Twenty-four hours after treatment, cells were fixed with 4% paraformaldehyde for 10 min. For fluorescence labelling, normal goat serum was applied for 30 min, before incubation with primary antibodies for 16 h (for human tumor cells: N-Cadherin, 1:500, MA5-29138, Invitrogen, Waltham, MA, USA or for murine astrocytes and tumor cells: ß-Catenin, 1:200, 71–2700, Thermo Fisher, Waltham, MA, USA). On the next day and after washing with PBS, the secondary antibody (goat anti-rabbit-Alexa 568, 1:200, A11011, Invitrogen, Waltham, MA, USA) was applied for one hour. Next, for actin labelling, a phalloidin-488 staining was used. Cells were washed twice for 10 min in PBS, then incubated with 0.1% PBS/Triton for 5 min and blocked with 1% bovine serum albumin. Phalloidin-488 (2.5 µL/100 µL BSA solution, Thermo Fisher Scientific, Waltham, MA, USA, A12379) was applied for 20 min. For the visualization of nuclei, DAPI (1:10,000, Sigma Aldrich, St. Louis, MO, USA D9542) was used. The stained cells were washed with PBS, distilled water and covered with DAKO mounting medium (DAKO, Santa Clara, CA, USA).
Fluorescence images were acquired with a 63× objective using a confocal laser scanning microscope (Leica, DMi8, Wetzlar, Germany). For detection of DAPI, phalloidin, β-catenin and N-cadherin, the following excitation wavelengths were used: 405 nm, 488 nm, and 568 nm, respectively. Emission was detected in the range of Δλ = 420–500 nm (DAPI), Δλ = 510–550 nm (Phalloidin) and Δλ = 580–680 nm (β-catenin, N-cadherin).
For the analysis of cell–cell-contacts in β-catenin, staining contact regions with an approximately straight shape were chosen. The cell–cell contact was manually marked and the mean intensity inside a rectangle along the direction parallel to the cell–cell contact was measured. The background was normalized and Gaussian fitting performed. As the strength of a cell–cell contact is supposed to be proportional to its intensity and thickness, the adhesive index was calculated as the sum of the normalized intensity around the peak in a distance ± two standard deviations away from the peak center.
2.9. Estimation of Stress Fiber Tension
For an estimate of the tension created by stress fibers, it was used that the work W needed to increase the cell area A is given.
This approach assumes that the generated force per stress fiber is constant along the whole distance if the fiber retracts, as well as a roughly uniform distribution of stress fibers. Furthermore, it assumes all stress fibers to behave equally. Thus, this approach likely gives an overestimation of the generated tension, as the force generated by stress fibers decreases during contraction. Consequently, the values obtained should be considered upper bounds for forces generated by stress fibers to resist shape changes.
From the literature, the force of contractile fibers in reconstructed actin–myosin bundles was estimated to be 0.5–2 nN, and measurements in U2OS cells and simulations found values around 2–4 nN, while retraction length of stress fibers upon laser ablation in glioma cells and others was ~2 µm, corresponding to half the upper limit a stress fiber can transmit a force. Here, we assume a force of 3 nN per fiber and a contraction length of 4 µm. The numbers of stress fibers per cell and cell–cell contact area were extracted manually from laser scanning microscopy images of dense cell layers.
2.10. Traction Force Microscopy
Double layer 35 kPa hydrogels optimized for TFM were prepared as follows. 24 mm glass coverslips were silanized by 15 min incubation in a solution with a ratio of (14:1:1) of ethanol 96%, acetic acid and 3- (Trimethoxysilyl)propyl methacrylate (Sigma Aldrich, St. Louis, MO, USA, #440159). Afterwards, the coverslips were rinsed with ethanol and dried. A 35 kPa Acrylamide/Bisacrylamide stock solution was prepared by mixing 2.5 mL of 40% Acrylamide (Bio-Rad, Hercules, CA, USA, #161-0140), 1.5 mL of 2% Bisacrylamide (Bio-Rad, Hercules, CA, USA, #161-0142) and 6 mL of MilliQ water. An amount of 99.3 µL Acrylamide/Bisacrylamide stock solution was mixed with 0.5 µL of 10% Ammonium persulfate (APS, Sigma-Aldrich, St. Louis, MO, USA, #A3678) and 0.2 µL N,N,N′,N′-tetramethylethylenediamine (TEMED, Bio-Rad, Hercules, CA, USA, #161-0800). An amount of 5 µL of the mix was put on top of the silanized 24 mm coverslip and a 15 mm glass coverslip was put on top of the drop. After 30 min, the top coverslip was removed. An amount of 94.3 µL of the Acrylamide/Bisacrylamide stock solution was then mixed with 5 µL fluorescent beads (Invitrogen, Waltham, MA, USA, F8807, 0.2 µm, dark red fluorescent), 0.5 µL of 10% APS and 0.2 µL TEMED. An amount of 5 µL of this solution was put on top of the first hydrogel and a 15 mm round glass coverslip was placed on top. After 30 min, the second coverslip was removed, and the TFM hydrogel surface was activated by incubation with 250 µL of 1 mg/mL N-sulfosuccinimidyl-6-(4′-azido-2′-nitrophenylamino) hexanoate (SulfoSANPAH, Sigma-Aldrich, St. Louis, MO, USA, #803332) in MilliQ water, followed by 6 min of UV exposure. The hydrogels were then incubated with 100 µg/mL laminin for 1 h, placed in 6-well plate holders and kept in PBS containing 1% Penicillin-Streptomycin (Gibco # 15140122) overnight. The next day LN229 cells were seeded on the hydrogels at a density of 106 cells per well and let to adhere for 24 h.
Samples were imaged using a Nikon Eclipse TI2 microscope equipped with a 40× Plan Apo air objective. To investigate the influence of blebbistatin and Y-27632 treatment on LN229 traction forces, samples were pre-treated for 1 h prior to imaging with 5 µM blebbistatin or 20 µM Y-27632. A total of 5–10 areas were selected for each sample and Z-stacks were acquired before and after the addition of 20 µL 10% sodium dodecyl sulfate. Bead displacements were detected using the cross-correlation PIV plugin in ImageJ after stacking and alignment using the SIFT alignment algorithm. Heatmaps of bead displacements were coded in MATLAB (version R2020a). Please denote that only bead displacements and not tractions were measured, albeit larger displacements imply larger traction forces.
2.11. Statistics
Statistics were performed using the two-tailed ANOVA with the Tukey post-hoc test or the two-sided sign test to evaluate if the median of the shape factor is above or below a critical value. Significance was defined for p < 0.05. All error-bars and shaded areas depict the standard error of the mean. Experiments were repeated at least three independent times.
For live-cell imaging experiments assessing collective motion, 5–8 fields of views were measured per experiment and condition. For primary astrocytes, each individual live-cell experiment was performed with astrocytes from different animals to avoid passaging effects.
For AFM measurements of dense layers, three or four independent experiments were performed capturing one measurement field with 400 individual measurement curves per experiment. Data points were excluded, when the approach curve contained kinks or shape variations that point towards cantilever or cell slippage.
Confidence intervals for fit parameters were obtained using the MatLab function confint.
3. Results
3.1. Astrocytes Are Non-Migratory and Jammed but Not Glioblastoma
We first measured the collective motion of primary astrocytes and the human GBM cell lines U138 and LN229. All cell types showed different behavior (Figure 1), with astrocytes being less motile and mostly stationary, while the GBM cell lines showed reorganization and high motility (Figure 1, supplementary Videos S1–S3). This observation agreed with the quantitative analysis of sheet migration. Astrocytes moved slow (5–6 µm/h), while GBM cells moved faster (8–17 µm/h; Figure 2a). In agreement, the order parameter of astrocytes showed high overlap during the measurement window of 20 h, with ≈70% of astrocytes located closer than 0.2 cell diameters to their initial position (supplementary Figure S1). In contrast, only ≈20% or less than 10% of the GBM cells were close to their initial position after 20 h, indicating a more static behavior of astrocytes compared to the GBM cells (supplementary Figure S1). From the order parameter, the 4-point susceptibility was calculated (Figure 2b). Its peak height is proportional to the number of cells moving coordinated and collectively, referred to as “pack” and the peak time corresponds to the time a pack of fast moving cells moves together. After several pack life times, the layer underwent significant reorganization. Analyzing the 4-point susceptibility, astrocytes and U138 cells were found to move in packs of 2–3 cells, while LN229 cells moved in packs of around 10 cells. As expected from the previous results, the pack lifetime averaged over each field of view was largest for astrocytes (11 h), and lower for the GBM cell lines (LN229: 5.5 h and U138: 1.5 h, Figure 2b). Tracking virtual particles and analyzing their relations in terms of changes in nearest neighbors, GBM cells had significantly different neighborhoods at the beginning and end of the measurement (less than 30% or 5% conserved neighborhood) compared to primary astrocytes (≈70% conserved neighborhood, Figure 2c). GBM cell monolayers showed, therefore, significant reorganization during the measurement time, while astrocytes remained relatively stable in their organization. Altogether, the obtained data indicated that astrocytes were in a jammed state, while the analyzed GBM cells were not. In previous studies based on the vertex model, a critical shape factor of 3.81 for the onset of jamming was derived. Thus, the shape factor was calculated and found to be above the critical value for both GBM cell lines and below for astrocytes (Figure 2d), indicating that the path to jamming potentially follows the vertex model. Additionally, the shape factor stayed nearly constant during the whole measurement time (supplementary Figures S2 and S3, control conditions).
Figure 1.
Migration of astrocytes and glioblastoma cells. Each row shows a typical phase contrast image, overlaid with the vectors of the velocity fields (left), the magnitude of the velocity and its direction (center) and typical cellular movement over the time course of 20 h (right). Red dots denote the start and blue dots the end position.
Figure 2.
Collective migration properties of astrocytes and glioblastoma cells. (a) Graph of the mean speed per field of view over time, evaluated for 81, 33 or 18 fields of views for LN229, U138 or astrocytes, respectively. (b) 4-point susceptibility as obtained from the velocity fields over the whole measurement time. Peak positions of the 4-point susceptibility represent the average life time of collectively moving packs of cells. Sample sizes were identical as reported in (a). (c) Analysis of layer reorganization in terms of cells without making new neighbors. Sample sizes were identical as reported in (a). (d) Differences in shape factor between the cell types measured during live-cell imaging. The dotted line shows the critical value of 3.81 predicted by the vertex model. Below cells are considered to be jammed. “+” and “−” depict if shape factors are significantly larger or smaller than the critical value, with p < 0.0001 for all cell types, as tested with sign test. For shape factor calculation 2645, 772 or 269 LN229, U138 cells or astrocytes were measured from the fields of view. (b,c) Error bars and shaded areas depict the standard error of the mean. (c,d) Box plots show the median (red line), 25 and 75 percentile (box), non-outlier range (whiskers) and outliers (red dots).
3.2. Cell Density Affects Jamming in a Cell Line Dependent Manner
Next, cell density was investigated as a possible path to (un-)jamming in the examined cell types, as it was proposed to be a major driver of jamming [17,49]. After visual inspection of the live cell videos, no significant proliferation was observed in astrocytes during the 20 h measurement time. Thus, different amounts of astrocytes were seeded to alter cell density. As an extreme case, a scratch assay was performed to generate a local astrocyte cell density of zero at the scratched region. GBM cells displayed a high amount of proliferation events during the measurement, increasing cell density up to a factor of three (Figure 3e–f). Thus, it was sufficient to measure GBM cell density at different time points.
Figure 3.
Cell density dependence of collective migration. (a) Measured mean speeds of astrocytes per field of view when seeded in different densities of 300k, 400k, 600k, 800k cells or subjected to a scratch, measured for 18 or 20 (scratch) fields of view. (b) Illustration of the 4-point susceptibility over the whole measurement time. Peak positions of the 4-point susceptibility represent the average life time of collectively moving packs of cells. Sample sizes are identical to (a). (c) Illustrates the difference in shape factor for different seeding densities of astrocytes and during the wound healing assay. The dotted line shows the critical value of 3.81 predicted by the vertex model. Below cells are considered to be jammed. “+” and “−“ depicts if shape factors are significantly larger or smaller than the critical value, with p < 0.0001 for all instances, as tested by sign test for 256, 269, 234, 183 or 386 astrocytes for seeding densities of 300k, 400k, 600k, 800k cells or the scratch. (d–f) Plot of the cell density over the speed for astrocytes, LN229 and U138 cells. Formulas show the scaling behavior of the speed v with cell density δ. Values in brackets denote 95% confidence intervals. (a,b,d–f) Error bars and shaded areas depict the standard error of the mean. (c) Box plots show the median (red line), 25 and 75 percentile (box), non-outlier range (whiskers) and outliers (red dots).
For astrocytes, no significant changes were found regarding cell speed, pack-size of collective motion (2–3 cells) and shape when altering cell density, except for the extreme case of the scratch (Figure 3a–d). Only an increase in pack lifetime from 11 h up to 15 h was found, indicating even slower reorganization for higher cell densities. Furthermore, the shape factor remained constant over time and the neighborhood of astrocytes was almost constant at the beginning and end of the measurement, independent of cell density (supplementary Figure S2a). Induction of the scratch led to increased cellular motion (7–8 µm/h), with pack-sizes of up to 9 cells and significantly elongated cell shapes of astrocytes, implying unjamming (Figure 3a–c). Interestingly, if the scratch was closed the velocity field at the contact zone of the fronts was oriented roughly perpendicular towards the initial flow or there was only very little residual motion and the fronts did not mix (Figure 4a,b), implying jamming after wound closure. This assumption was strengthened by the observation that astrocytes slightly away from the meeting points of cell fronts (200–400 µm) regained a shape factor of 3.81 and even the more motile cells in the center showed less elongated shapes with a shape factor of 3.96 (Figure 4c).
Figure 4.
Behavior of astrocytes after wound closure. (a) Shows phase contrast images of astrocytes subjected to a scratch at different time points after the injury, overlaid with the velocity vectors (left). The right part shows the local speed and its direction. (b) Depiction of the movement paths taken by the cells of (a) after scratch closure. Red dots denote the start and blue dots the end position. (c) Illustration of the difference in shape factor for two distinct regions (see (b)) of the wound healing assay after scratch closure. The dotted line shows the critical value of 3.81 predicted by the vertex model. Below cells are considered to be jammed. “+” depicts if shape factors are significantly larger or smaller than the critical value with p = 0.049, as tested by sign test for 61 or 85 cells at the center or in the non-center region. Box plots show the median (red line), 25 and 75 percentile (box), non-outlier range (whiskers) and outliers (red dots).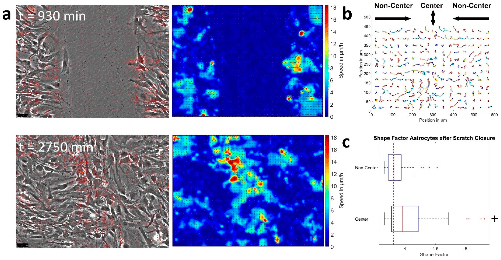
As GBM cells divided frequently during the measurement, the 20 h measurements were subdivided into 6 h long time-windows to analyze the cell-density dependence of the 4-point susceptibility (Figure S4b,c,e,f). Thereby, time averaged measured pack lifetimes matched the lifetimes of the 20 h time window only if the maximal lag time was at least 2.5 to 3 times larger than the actual pack lifetime. Notably, this was not the case for LN229 cells, using the 6 h long time-window. Longer lag times on the other hand would lead to a too large averaging effect over time and thus over cell density. See supplementary results and supplementary Figure S4g–i for more information. Thus, only the ratio between pack life times at t = 0–6 h and t = 15–21 h is given here. Thereby, a monotonous increase over time of the pack lifetime up to 45% and up to 29% was observed for LN229 and U138 cells, respectively. Furthermore, a decrease of the peak height was observed for LN229 cells, while it stayed almost constant for U138 cells (supplementary Figure S4b,c,e,f). The decrease of the peak height for LN229 cells might be explained by the increasing pack lifetime successively approaching the maximal lag time of 6 h, in an identical fashion as explained in a previous study resulting in a decrease of the peak height. Thus, this was likely an effect of the chosen time frame.
Furthermore, the speed of LN229 cells scaled with cell density as ???? ~ 1/????−−√ and for U138, it was independent of density (Figure 3e–f). Such scaling behavior as for LN229 cells was predicted previously, when cell speed was determined by an equilibrium of expansive and contractile forces. Notably, if the cell density was increased further via experimental times up to 60 h, the described behavior for U138 cells did not change (Figure S5). In contrast, the characteristics for LN229 cells approached those of astrocytes, with reorganization times of 13 h and a similarly conserved neighborhood as astrocytes with up to 80% conservation in a 20 h time window (Figure S5). Due to the very high cell densities, single cells could no longer be distinguished and cell density analysis was not performed. Taken together, cell density seemed to be a possible inducer of jamming in GBM cells, but in a cell line dependent manner. Next, we investigated additional cell-density independent mechanisms involved in jamming of GBM cells. Therefore, a disturbance of the force balance was induced.
3.3. ROCK and Myosin II Inhibition Causes Jamming in Glioblastoma Cells
For inhibition of force generation and thus adhesion and tension [51,52], the myosin II inhibitor blebbistatin (5–20 µM) and ROCK inhibitor Y-27632 (5–40 µM) were used in different concentrations. Application of inhibitors reduced the collective migration speed by up to 50% for astrocytes and increased the pack lifetime from 12 h up to 15 h and pack size from ≈2 cells up to ≈3 cells (Figure 5a,b). Furthermore, layer reorganization stayed low with about 60–70% of the cells having a conserved neighborhood during the measurement time (Figure 5c). Consistently, all shape factors remained below the critical value for unjamming for the whole measurement time (Figure 5d, supplementary Figure S2).
Figure 5.
Effect of myosin II and ROCK inhibition on collective migration. (a,e,i) Mean speed per field of view for astrocytes, LN229 and U138 cells treated with ROCK inhibitor Y-27632 or myosin II inhibitor blebbistatin. For astrocytes, 15 fields of view were measured for all conditions. For LN229 and U138 cells 81 or 33 fields of view were assessed in control conditions and 15 otherwise. (b,f,j) 4-point susceptibility over the whole measurement time for astrocytes, LN229 and U138. Peak positions of the 4-point susceptibility represent the average life time of collectively moving packs of cells. Sample sizes are the same as in (a,e,i), respectively. (c,g,k) cell layer reorganization in terms of changed neighborhood. Sample sizes are the same as in (a,e,i), respectively. Here p < 0.001 for all instances of U138 and LN229 cells except for LN229 treated with 10 µM Y-27632 (p < 0.05). (d,h,l) illustrate the difference in shape factor for astrocytes, LN229 and U138 cells. The dotted line shows the critical value of 3.81 predicted by the vertex model. Below cells are considered to be jammed. “+” and “−” depict if shape factors are significantly larger or smaller than the critical value, as assessed by sign test. Here p < 0.0001 holds for all instances of astrocytes, U138 cells and LN229 cells in control conditions or when treated with 10 µM blebbistatin. p < 0.01 for LN229 cells treated with 5 µM Y-27632 and p < 0.05 for LN229 treated with 10 µM Y-27632. For astrocytes 365, 284, 261, 279, 296, 390, 413 or 396 cells were measured for control conditions, Y-27632 (5, 10, 20, 40 µM) or blebbistatin (5, 10, 20 µM) treatment. For LN229 cells 2645, 298, 301, 454, 302 or 460 cells were measured for control conditions, Y-27632 (5, 10, 20 µM) or blebbistatin (5, 10 µM) treatment, respectively. For U138 cells 772, 448, 448, 450, 150, 300, 302 or 150 cells were measured for control conditions, Y-27632 (5, 10, 20, 40 µM) or blebbistatin (5, 10, 20 µM) treatment, respectively. (a,b,e,f,i,j) error bars and shaded areas depict the standard error of the mean. (c,d,g,h,k,l) box plots show the median (red line), 25 and 75 percentile (box), non-outlier range (whiskers) and outliers (red dots). Stars (*) depict statistically significant results.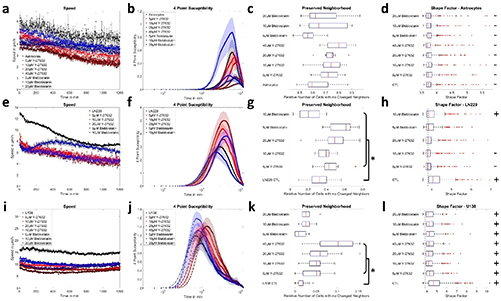
Application of the inhibitors to the monolayer of LN229 cells led to a drop of the speed by up to 40% and an increase of the pack lifetime up to 8 h (for both: except for 10 µM blebbistatin), accompanied by an increase of the 4-point peak susceptibility, resulting in an increase of the collectively moving cells from 10 to 18 (Figure 5e,f). Additionally, treated LN229 cells showed less layer reorganization, with up to 60% of cells not making new neighbors (Figure 5g, Figure S7), similar to the values observed for astrocytes. Furthermore, the shape factor dropped below the critical value for LN229 cells treated with 5 µM and 10 µM Y-27632, while it could not be statistically distinguished from the critical value for 20 µM Y-27632 and 5 µM blebbistatin (Figure 5h). Taken together, these observations indicate the onset of jamming. After treatment with 10 µM blebbistatin, LN229 cells lost most cell–cell-contacts, collapsed to a roundish shape with long thin processes, leaving significant space between individual cells, while moving more independently and crawled above each other. Thus, the assumptions for the analysis of collective motion and jamming were no longer met. When analyzing the effect of both inhibitors on single cell motility of LN229 cells, blebbistatin reduced single cell speed, while Y-27632 increased motility. Both inhibitors reduced the directional persistence of motion (Figure S6).
For U138 cells, inhibition of force generation resulted in reduced collective migration speeds (up to 50%, Figure 5i), but there was still strong reorganization of the cell layer (Figure 5k, Figure S7) and collective motion (pack size: 2–4 cells; Figure 5j). Even though an increase in pack lifetime was observed, it reached at most 2.5 h (Figure 5j). Furthermore, the shape factor of U138 cells was reduced upon treatment, but remained well above the critical value (Figure 5l). The effects of the inhibitors on the single cell level were different, resulting in a marked increase in single cell speed (Figure S6). Consequently, disturbing the equilibrium of expansive and contractile forces induced jamming in LN229 cells, but not in U138 cells. As the effects of both inhibitors on single cell motility was different compared to the effect on the cell-collective, it was next tested how cell–cell-interactions were altered.
3.4. (Un-)Jamming Is Determined by the Ratio of Adhesion and Tension
To identify the biomechanical origins of the jamming transition, multiple models were suggested. One model associated the transition from a fluid-like to a solid-like behavior by adhesion maturation of cell–surface- and cell–cell adhesions and thus by rising friction, assessed via velocity auto-correlation and layer speed [20]. Here, comparably low auto-correlation length was found in the order of one cell size (10–20 µm) that remained approximately constant over time, even for the LN229 cells (Figure S8). Qualitatively, the observed behavior did not change after application of ROCK or myosin II inhibitors for all cell lines and only slight numerical changes were observed (not shown). As the changes in auto-correlation length were very small compared to the intra-experimental variations and the values presented in Garcia et al. (±100 µm; here: ±10 µm), the proposed model may not be sufficient to explain changes in instantaneous velocity and layer reorganization.
Another model explained the onset of (un-)jamming with alterations in the ratio of force generation to cell–cell-adhesion. Thus, the force generated by stress fibers was estimated and cortical tension, elastic modulus and cell–cell-adhesion of the used GBM cell lines and astrocytes were measured.
First, the elastic modulus of LN229 cells was measured after treatment with 20 µM Y-27632 or 5 µM blebbistatin and the median Young`s modulus decreased from 812 Pa to 288 Pa or 581 Pa, respectively (Figure 6a,b). Similarly, for U138 cells, median values declined from 526 Pa to 324 Pa (40 µM Y-27632) or 390 Pa (10 µM blebbistatin). Astrocytes were stiffest with a median modulus of 900 Pa (Figure 6b). When assessing cortical tension, a drop was observed after application of the inhibitors for both GBM cell lines, but changes were comparably small. In LN229 cells, median tension was reduced from 328 pN/µm to 237 pN/µm or 335 pN/µm and for U138, from 120 pN/µm to 99 pN/µm and 85 pN/µm, respectively. Again, tension of astrocytes was highest with a median of 764 pN/µm (Figure 6c). The reduction in cortex tension for the GBM cells was also in agreement with the observation that both inhibitors led to a reduction in the number and thickness of stress fibers (Figure 6d, supplementary Figure S9). Using a strongly simplified model for the estimation of the tension generated by stress fibers, a similar decrease was found. Median tension values were 727 pN/µm, 318 pN/µm and 401 pN/µm for LN229 and 575 pN/µm, 213 pN/µm and 280 pN/µm for U138 cells under the given conditions (Figure 6e). Values for astrocytes were highest with 1120 pN/µm. To verify the results from the previous estimates, traction force microscopy (TFM) measurements were performed. For LN229 cells, the bead displacements were lowered to 41% or 71% of the control values, implying significantly lower tractions (Figure 6f,g). U138 cells failed to adhere to laminin-coated polyacrylamide surfaces and therefore, no TFM measurements were performed. Afterwards, cell–cell-adhesion was assessed.
Figure 6.
Biomechanical properties of astrocytes and glioblastoma cells. (a) Illustration of a typical 140 × 140 µm2 dense layer of LN229 cells used for measuring elastic moduli (left) and the respective map of the elastic moduli (right). Scale bar represents 20 µm. (b) Measurements of the Young moduli for astrocytes and both GBM cell lines, when treated with the ROCK inhibitor Y-27632 or myosin II inhibitor blebbistatin. p < 0.0001 for all significant results, as assessed by one way ANOVA with Tukey post hoc test. For astrocytes 1187 sample curves were obtained. For LN229 1568, 1566 or 1585 and for U138 cells, 1161, 1164 or 1148 measurement curves were evaluated for control conditions, Y-27632 or blebbistatin treatment, respectively. (c) Cortical tension of astrocytes, LN229 and U138 cells, when subjected to ROCK or myosin II inhibition. p < 0.05 for all LN229 measurements and U138 control conditions vs. 10 µM blebbistatin. p < 0.01 for U138 vs. 40 µM Y-27632. One way ANOVA with Tukey post hoc test was used. For astrocytes, 45 cells were measured. For LN229, 55, 55 or 53 and for U138, 55, 53 or 54 cells were measured for control conditions or when treated with Y-27632 or blebbistatin, respectively. (d) A typical actin staining of LN229 cells in control conditions (left) and when treated with 20 µM of Y-27632 is shown. Scale bars depict 10 µm. (e) Estimation of the tension generated by stress fibers by astrocytes and GBM cell lines. 75 cells in 15 fields of view were analyzed in each group. p < 0.0001 for all significantly different treatments, as assessed by one way ANOVA with Tukey post hoc test. (f) Normalized bead displacements obtained from the TFM measurements for LN229 cells. p < 0.0001 for all significantly different treatments. (g) Sample images and the respective displacement maps for (un-)treated LN229 cells. Scale bars depict 50 µm. (b,c,e,f) Box plots show the median (red line), 25 and 75 percentile (box), non-outlier range (whiskers) and outliers (red dots). Stars (*) depict statistically significant results.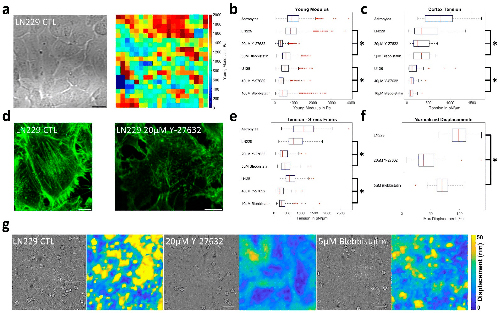
Both GBM cell lines functionally express the cell–cell-adhesion molecule N-cadherin at their cell periphery (Figure S10a). As other cadherins might also be involved in the formation of cell–cell-junctions, the adaptor protein β-catenin was labelled to estimate relative cell–cell-contact strength. After the application of both inhibitors, a drop in the fluorescence intensity of the β-catenin staining became visible in both GBM cell lines and cell–cell–surfaces displayed no longer a clear continuous but a discontinuous, dot-like labeling (Figure 7a, Figures S10b and S11). The quantitative analysis confirmed this observation and the relative cell–cell-contact fluorescence intensity was reduced from 42.9 to 11.3 or 15.2 for LN229 and from 39.4 to 15.6 or 17.4 for U138 after blebbistatin or Y-27632 treatment, respectively (Figure 7b). Another type of adhesion experiment was performed using the AFM, pressing a single cell onto a dense cell layer for 1 min. Measured astrocytes had a median maximal adhesion force of 0.84 nN (Figure 7c). The adhesion force of LN229 cells decreased from 1.05 nN to 0.83 nN or 0.95 nN and of U138 cells from 1.59 nN to 1.3 nN or 0.91 nN after the application of inhibitors (Figure 7c). Lastly, the cell–cell-adhesion energy was calculated from a combination of the measured Young’s modulus (Figure 6b) and spheroid aggregation experiments (Figure 7e, supplementary Figure S12). Thereby, we obtained median values of 1299 µJ/m2 for astrocytes and 1698 µJ/m2, 281 µJ/m2 and 567 µJ/m2 for LN229 and 1732 µJ/m2, 769 µJ/m2 and 971 µJ/m2 for U138 cells (Figure 7d) after application of the ROCK or myosin II inhibitors. Notably, the adhesion ratios for LN229 and U138 after treatment to the respective controls were very similar for the spheroid experiments and the analysis of the fluorescence intensities (Table S1).
Figure 7.
(a) Representative examples of actin and β-catenin staining for LN229 cells. Scale bar depicts 10 µm. (b) Cell–cell adhesion strength as estimated by the fluorescence images. For all statistically significant differences: p < 0.0001. For astrocytes 73 cell–cell connections were measured. For LN229 70, 49 or 72 and for U138 75, 74 or 67 cell–cell junctions were analyzed for control conditions or when treated with Y-27632 or blebbistatin, respectively. (c) Cell–cell adhesion forces as measured using AFM. For LN229 treated with Y-27632 and U138 treated with blebbistatin p < 0.01, p < 0.05 otherwise. The sample size for astrocytes was 30, for LN229 39, 35, 34 and for U138 32, 27, 26 for control conditions or after treatment with Y-27632 or blebbistatin, respectively. (d) Values calculated for the cell–cell-adhesion energies obtained from the spheroid aggregation. p < 0.0001 for all significantly different treatments, as assessed by one way ANOVA with Tukey post hoc test. For astrocytes 46 spheroids were assessed. For LN229 31, 23 or 17 and for U138 cells 33, 39 or 27 spheroids were measured for control conditions or Y-27632 or blebbistatin treatment, respectively. (e) Evolution of the spheroid area over time for astrocytes and both GBM cell lines for all used conditions. Inlets show typical spheroids at the beginning and end of the measurement. Sample size is identical to d. Scale bars depict 300 µm. (b–d) Box plots show the median (red line), 25 and 75 percentile (box), non-outlier range (whiskers) and outliers (red dots). (e) Error bars depict the standard error of the mean. Stars (*) depict statistically significant results.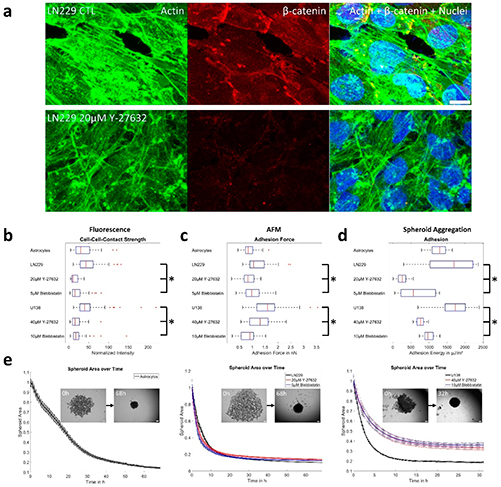
Thereafter, changes in adhesion were compared with those in tension for LN229 cells under equilibrium conditions (Table 1). The treatment with Y-27632 impacted adhesion stronger than tension. Whereas the adhesion was reduced to 16-26% of control values, tension was reduced to 38%. A similar observation was found for treatment with Blebbistatin, reducing adhesion to 33–35% and tension to 71% of control values. For U138, adhesion and tension were affected to a similar extent. Notably, tension estimates for U138 could only be performed indirectly.
Table 1. Ratio of median adhesion and tension to control conditions.
Such shifts in ratios in favor of tension imply, together with the other presented data, a jamming transition or a layer close to the transition point for LN229. Similar changes were not observed for U138. For all cases, these predictions matched the observations made during live cell imaging.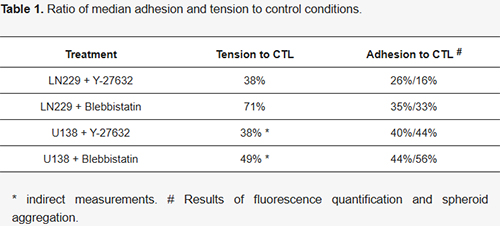
4. Discussion
In this study, the collective behavior of primary astrocytes and GBM cells were analyzed. Astrocytes were found to reside in a jammed state allowing only little reorganization, while GBM cells were unjammed and showed marked reorganization. Interestingly, modulating cell density had a cell type and cell line dependent effect on the behavior of astrocytes and GBM cells. Furthermore, a perturbation of the equilibrium of force generation and adhesion induced jamming in LN229 cells.
From a physiological point of view, the observed behavior appears plausible, as astrocytes naturally form and support structures that need to be temporally stable, such as synapses or the blood brain barrier. On the other hand, GBM cells readily colonize the whole brain, demanding vivid reorganization of the tumor tissue. Nevertheless, what physical properties of the cells may cause the switch between a static, solid-like behavior as observed for astrocytes and a migratory, fluid-like behavior (GBM cells) have been investigated only sparsely. In cells of mostly epithelial origin, an increasing cell density was found to be a major inducer of jamming. In our study, cell density appeared to be one control parameter for the induction of migratory arrest in one of the used GBM cell lines, while the other remained unaffected. This observation is in agreement with the findings of Castro et al showing the speed of mammary carcinoma cells in a dense layer to be mostly independent of the cell density, as observed here for U138. Nonetheless, we found a density dependent decrease in cell speed for the LN229 cells, scaling in a similar way as reported before, associated with the balance of traction forces and cell–surface frictional forces. However, the effect of increased cell density was sufficient to cause jamming only at very high cell densities where no precise cell number estimates could be made. Therefore, in LN229 the scaling behavior observed for lower densities cannot be verified at higher densities associated with migratory arrest. Another aspect of possible importance is the maturation of adhesions over time, being related to cellular slow down and jamming [20]. This phenomenon appears less important for U138 cells, as all dynamic measurements (collective migration, spheroid aggregation) showed no large dynamics over time and spheroids gained their equilibrium size after less than 20 h with no significant changes afterwards. Similarly, if adhesion maturation strongly affects LN229, it is expected that spheroid aggregation does not reach a stable equilibrium after ≈24 h. Furthermore, collective migration experiments started 24 h after cell seeding; thus, it is likely that adhesions had already matured. Despite adhesion maturation, different ratios in cell–cell to cell-substrate adhesion might have played a role, especially for LN229 cells. Analyzing single cell motility, being only influenced by cell–substrate friction, velocities under treatment were up to two times higher. With growing cell density—given volume conservation of cells—the ratio of cell–cell contact area to cell–surface contact area increased and thus cell–cell friction became increasingly important While this approach might explain effects in LN229 cells, it seems insufficient to explain cell density independence in U138. Consequently, jamming in cells of glial origin might not only be governed by cell density, but disruptions in the equilibrium of frictional (adhesive) and traction forces are considered important. This idea is further supported by our observation of a largely density independent behavior of astrocytes, that were jammed at all analyzed cell densities. However, during the scratch-assay, astrocytes displayed the expected initial fluidization, but upon contact of the opposing fronts, the velocity field at the meeting points oriented roughly perpendicular to the opposing fronts, or movement ceased and cells from both fronts did not mix. Such a behavior was reported previously in MCF-10A cells and associated with the induction of jamming. Taken together, reaching confluence might be sufficient to induce jamming and migratory arrest in astrocytes. Another key difference between astrocytes and GBM cells was the ability of both GBM cell lines to proliferate. Previous studies found a positive association between proliferation and the ability to migrate. Proliferation events were supposed to induce local stress fluctuations, and even fluidization of cell layers. Consequently, the proliferative ability of the here investigated GBM cells might potentially be an additional source of the migratory, unjammed state. Nonetheless, the detailed influence of proliferation in the analyzed system is not clear and needs further investigations. Especially, given the cell density independent behavior of U138 cells. Furthermore, differences in energy metabolism between astrocytes and GBM cells have to be taken into account, as GBM show higher rate of glycolysis. This is especially noteworthy, because unjamming was previously demonstrated to be associated with a shift towards glycolysis, being another factor potentially explaining the differences between both cell types
As cell density might not be the sole control parameter for the jamming transition in GBM cells, we next turned to the predictions made by other models. These models propose that cell–cell-adhesion, tension and propulsion forces determine collective behavior. Of note: The different effects of both inhibitors on single cell motility and speed of the confluent monolayers are a first and strong hint that not only single cell properties, but also cell–cell interactions, such as adhesion, are affected by the used inhibitors. To test the predictions of the aforementioned models, the force generation was disturbed by the inhibition of myosin II and ROCK. Notably, force generation is coupled with adhesion and tension, as is reproduced here as well. As expected, all but one treatment led to a reduced migration speed in the cell monolayer [67,68,69] and lowered reorganization in all cell systems. Interestingly, in LN229 cells, the lifetime of fast moving packs almost approached those of astrocytes, hinting towards the onset of jamming. This idea was further supported by the shape change leading to a drop of the shape factor of LN229 cells reaching the critical value predicted for jamming. U138 cells reacted qualitatively similar, but in all analyzed metrics, remained far from jamming. In parallel to the migratory arrest, we found cell–cell adhesion to be stronger affected in LN229 cells than tension, while this was not the case for U138 cells that stayed motile. Such behavior is in support of the predictions made by the vertex model and other experiments. Yet, it has to be considered that cell–surface interactions most likely were reduced by the used interventions too. Consequently, their role needs to be elucidated, as they are neither included in the vertex model nor explicitly measured here.
Furthermore, a difference in interpretation of the role of stress fibers compared to a study of Saraswathibhatla and Notbohm should be considered. In their study performed in Madin-Darby canine Kidney (MDCK) cells, they argued that more stress fibers led to more traction and thus to more reorganization and an increased shape factor, associating the stress fibers directly with propulsion forces and thus being the main inducer of (un-)jamming. Contrasting this idea, a different study found stress fibers in U2OS osteosarcoma cells to carry no more than 20% of the overall forces, yet these values may differ depending on the cell type. Nevertheless, here we considered stress fibers as part of the tension machinery, thus favoring less elongated cell shapes and jamming. This concept is supported by observations made using laser ablation of single stress fibers, leading to almost immediate (
So far, all discussed friction parameters were equilibrium parameters defined via time scales of hours to days. Yet, at high cell densities, a migrating cell needs to elongate and thereby detach old adhesions and form new ones, happening on a time scale of seconds to minutes. The performed adhesion measurements using the AFM were conducted on a time scale of one minute. At these time scales, adhesive forces were significantly less impacted by the used treatments (relative reductions: LN229: ≤20%; U138: ≤55%;), albeit the effect of the drugs was likely underestimated as the calculations did not account for the softening of the cell monolayer after treatment and thus the larger contact area. Notably, cell–cell adhesion on this time scale might be less affected than tension, implicating traction forces to be the main driver of (un-)jamming.
Another aspect reminiscent of a jamming transition is a solidification of the jammed matter that was not observed here. Treatment with blebbistatin or Y-27632 inhibited force generation, caused by the dissociation of most stress fibers and disturbance of the actin cortex. The observed lower elastic modulus is suspected to be caused by the induced structural changes of stress fibers, the actin cortex and other structures significantly contributing to the measured elastic modulus and a loss of intracellular tension reducing strain hardening of actin and/or intermediate filament.
Taken together, our data demonstrated that astrocytes reside in a jammed state, while GBM cells are unjammed. A disturbance of the equilibrium of tension and cell–cell-adhesion can lead to jamming in GBM cells, effectively hindering layer migration and potentially infiltration into adjacent tissue, but also cell density can be a driver of jamming in GBM cells. These findings shed new light onto the collective migration of GBM and may open up new roots for the development of anti-migratory agents in glioblastoma.
Supplementary Materials
The following supporting information can be downloaded at: https://zenodo.org/record/7405901#.Y6K4coSZOUk Figure S1: Time evolution of the order parameter Q; Figure S2: Shape factor and neighborhood for astrocytes in different seeding densities and for different treatments at defined time points; Figure S3: Shape factor of GBM cells over time after ROCK or myosin II inhibition; Figure S4: Order parameter and 4-point susceptibility over time; Figure S5: Long-term measurements of collective migration; Figure S6: Analysis of single cell motility; Figure S7: Plot of the typical paths for LN229 and U138 GBM cells; Figure S8: Velocity auto-correlation length as function speed and cell density; Figure S9: Number of stress fibers per cell in astrocytes, LN229 and U138 GBM cells when treated with the ROCK inhibitor Y-27632 or myosin II inhibitor blebbistatin; Figure S10: Representative images of N-cadherin and β-catenin staining; Figure S11: Representative images of β-catenin staining for astrocytes and U138 cells; Figure S12: Plot of the adhesion and spheroid aggregation of astrocytes and LN229 and U138 GBM cells when treated with the ROCK inhibitor Y-27632 or myosin II inhibitor blebbistatin; Figure S13: Experimental setup for the used types of atomic force microscopy experiments; Table S1: Comparison of methods used for estimation of cell-cell adhesion; Video S1: Astrocytes imaged every 3 min over 20 h; Video S2: LN229 cells imaged every 3 min over 20 h; Video S3: U138 cells imaged every 3 min over 20 h.
Author Contributions
Conceptualization, U.H., F.D. and T.H.; Data curation, U.H., M.C.L.G., G.L. and T.H.; Formal analysis, M.C.L.G., G.L., E.A.C.-A. and T.H.; Investigation, U.H., J.C.v.W., C.G., M.C.L.G. and T.H.; Methodology, U.H., M.C.L.G., G.L. and T.H.; Software, T.H.; Supervision, E.A.C.-A., F.D. and T.H.; Visualization, U.H. and T.H.; Writing—original draft, U.H., J.C.v.W., C.G., F.D. and T.H.; Writing—review & editing, U.H., J.C.v.W., C.G., M.C.L.G., G.L., E.A.C.-A., F.D. and T.H. All authors have read and agreed to the published version of the manuscript. Funding This study was not supported by external funding. Institutional Review Board Statement All animal experiments were conducted in agreement with directive 2010/63/EU of the European Parliament and European Council (22 September 2010) and tissue collection was approved by the local authorities of the state of Saxony-Anhalt (I11M18).
Informed Consent Statement
Not applicable.
Data Availability Statement
The published article includes all datasets generated or analyzed during this study. The code supporting the current study has not been deposited in a public repository but is available from the lead author on request.
Atypical peripheral actin band formation via overactivation of RhoA and nonmuscle myosin II in mitofusin 2-deficient cells
by Yueyang Wang, Lee D Troughton, Fan Xu, Aritra Chatterjee, Chang Ding, Han Zhao, Laura P Cifuentes, Ryan B Wagner, Tianqi Wang, Shelly Tan, Jingjuan Chen, Linlin Li, David Umulis, Shihuan Kuang, Daniel M Suter, Chongli Yuan, Deva Chan, Fang Huang, Patrick W Oakes, Qing Deng
Abstract
Cell spreading and migration play central roles in many physiological and pathophysiological processes. We have previously shown that MFN2 regulates the migration of human neutrophil-like cells via suppressing Rac activation. Here, we show that in mouse embryonic fibroblasts, MFN2 suppresses RhoA activation and supports cell polarization. After initial spreading, the wild-type cells polarize and migrate, whereas the Mfn2-/- cells maintain a circular shape. Increased cytosolic Ca2+ resulting from the loss of Mfn2 is directly responsible for this phenotype, which can be rescued by expressing an artificial tether to bring mitochondria and endoplasmic reticulum to close vicinity. Elevated cytosolic Ca2+ activates Ca2+/calmodulin-dependent protein kinase II, RhoA, and myosin light-chain kinase, causing an overactivation of nonmuscle myosin II, leading to a formation of a prominent F-actin ring at the cell periphery and increased cell contractility. The peripheral actin band alters cell physics and is dependent on substrate rigidity. Our results provide a novel molecular basis to understand how MFN2 regulates distinct signaling pathways in different cells and tissue environments, which is instrumental in understanding and treating MFN2-related diseases.
Introduction
Cell spreading and migration play central roles in numerous physiological and pathophysiological processes. The dynamic cytoskeletal reorganization during cell migration is primarily achieved through a delicate balance between protrusive and retractive forces. The cytoskeleton and regulatory proteins cooperate with spatial and temporal precision to organize cell contents to control protrusions, adhesion, contractility, and force transmission (Lauffenburger and Horwitz, 1996; Pollard and Borisy, 2003; Seetharaman and Etienne-Manneville, 2020). The cytoskeletal networks are controlled by master regulators, such as the small Rho GTPases (Nobes and Hall, 1995; Takai et al., 1995; Kaibuchi et al., 1999). The initial cell spreading is driven by actin polymerization promoted by Rac1 and Cdc42 to form a sheet-like protrusion that generates a pushing force at the cell’s leading edge. Subsequently, Ras homolog gene family member A (RhoA) and calcium/calmodulin (CaM)-dependent pathways modulate myosin-dependent contractile force by regulating focal adhesions (Ridley and Hall, 1992; Nobes and Hall, 1999; Nobes and Hall, 1995) and inducing the formation of actin-myosin filaments, which form stress fibers (Ridley and Hall, 1992; Amano et al., 1996). Reduced activity of RhoA is necessary for spreading and migration, which facilitates cell edge extension by reducing myosin-dependent contractile forces (Wakatsuki et al., 2003). Myosin, specifically nonmuscle myosin II (NMII), functions as a master regulator of cell stiffness, further influencing cell migration (Tee et al., 2011). Notably, in addition to generating mechanical force within a cell, NMII plays an essential role in sensing and responding to external forces applied to the cell (Vicente-Manzanares et al., 2009; Aguilar-Cuenca et al., 2014; Lamb et al., 2021).
Fibroblasts are mesenchyme-derived cells essential for tissue development and repair by remodeling the extracellular matrix. Additionally, they secrete multiple growth factors and respond to migratory cues such as PDGF (Wynn, 2008). As a widely used cell model, the in vitro motility of fibroblasts has been extensively studied. Local Ca2+ pulses play critical roles in migrating cells, including fibroblasts, and Ca2+ homeostasis controls the organization of the cytoskeleton spatially and temporally (Bennett and Weeds, 1986; Tsai et al., 2015; Tsai and Meyer, 2012). The intracellular Ca2+ signals are predominantly generated from the intracellular Ca2+ storage, the endoplasmic reticulum (ER), through inositol triphosphate (IP3) receptors (Clapham, 2007; Parys and De Smedt, 2012). Calmodulin (CaM) is an essential effector protein in cells to amplify the Ca2+ signaling (Clapham, 2007). The Ca2+/calmodulin (CaM)-dependent pathways promote the phosphorylation of the myosin light chain (MLC), promoting the formation of adhesive contacts and stress fibers (Kamm and Stull, 1985; Stull et al., 1998). In addition, Ca2+/CaM activates Ca2+/CaM kinases (CaMKs), including CaMKI, CaMKK, and CaMKII (Saneyoshi and Hayashi, 2012; Soderling, 1999; Hudmon and Schulman, 2002), each regulates actin cytoskeleton in distinct pathways (Saneyoshi and Hayashi, 2012). Notably, CaMKII bundles F-actin to remodel the cytoskeleton (Lin and Redmond, 2008; Okamoto et al., 2007; O’Leary et al., 2006) and regulates Rho GTPases, including Rac and RhoA, by phosphorylating their GEFs and GAPs (Fleming et al., 1999; Okabe et al., 2003; Tolias et al., 2005; Xie et al., 2007; Penzes et al., 2008).
Mitochondria are central cellular power stations. In addition, they regulate many physiological processes, such as maintaining intracellular Ca2+ homeostasis and cell migration (Denisenko et al., 2019; Campello et al., 2006; Zhao et al., 2013; Báthori et al., 2006). The mitofusins (MFN1 and MFN2) localize to the outer mitochondrial membrane (OMM) and form homo- or heterodimers to promote mitochondrial outer membrane tethers (Santel and Fuller, 2001; Chen et al., 2003). Human MFN1 and MFN2 share ~80% similarity in protein sequence. They contain a large, cytosolic, N-terminal GTPase domain, two coiled-coil heptad-repeat (HR) domains, and two transmembrane domains (TM) crossing the OMM. MFN1 and MFN2 have primarily overlapping functions. Overexpression of either protein in MFN1 or MFN2 null cells promotes mitochondrial fusion (Chen et al., 2003). Knocking out either MFN1 or MFN2 leads to fragmented mitochondria in fibroblasts (Chen et al., 2003; Cipolat et al., 2004). Structural and biochemical studies revealed the difference between MFN1 and MFN2 in catalytic GTPase activity (Ishihara et al., 2004; Efremov et al., 2019) and in their ability to mediate trans-organelle calcium signaling (Dorn, 2020; Naon et al., 2016; de Brito and Scorrano, 2008). MFN2, but not MFN1, localizes to the mitochondria-associated ER membranes (MAM) (de Brito and Scorrano, 2008; Filadi et al., 2015). Mfn2 ablation in various cell types increases the distance between the ER and mitochondria and severely reduces Ca2+ transfer from the ER to mitochondria (de Brito and Scorrano, 2008; Filadi et al., 2015; Naon et al., 2016). Investigation of MFN2’s role in human diseases has primarily focused on MFN-mediated mitochondrial fusion, trafficking, metabolism, mitophagy, and mitochondrial quality control. How MFNs regulate the cytoskeleton, however, remains unclear.
In our previous research to understand the importance of mitochondrial shape in neutrophil migration, we generated transgenic zebrafish lines with CRISPR-based neutrophil-specific knockout of mitochondrial fusion-related genes (Maianski et al., 2002; Zhou et al., 2018). Surprisingly, we noticed a phenotype specific to Mfn2 deletion: most neutrophils exited the hematopoietic tissue and circulated in the bloodstream in homeostasis. We further demonstrated that MFN2 regulates neutrophil adhesive migration and Rac activation using the human neutrophil-like differentiated HL-60 cells (Zhou et al., 2020). Although we identified an essential role for MFN2 in neutrophil adhesion and migration, it is unclear how MFN2 regulates actin cytoskeleton organization and other cellular behaviors, such as cell spreading.
Here, we used mice embryonic fibroblasts (MEFs) as a model to further characterize how MFN2 regulates cytoskeletal organization. We demonstrate that MFN2 regulates cytoskeletal organization by suppressing Rho and NMII activity. Mfn2 depletion upregulates cytosolic Ca2+ in MEFs, leading to RhoA and NMII overactivation and forming a prominent ‘peripheral actin band (PAB)’ structure. This PAB hampered cell adhesive migration and caused significant changes in mechanical properties, including cell stiffness and membrane tension. Together, our results provided an in-depth molecular understanding of the role of MFN2 in cytoskeleton dynamics, cell spreading, and adhesive migration, which may lead to a better understanding and treatment of MFN2-associated diseases.
Results
MFN2 deficiency changes cell morphology and impairs adhesive 2D random migration in MEFs
As a first step in investigating the role of MFN2 in MEF cells, we confirmed the respective protein loss in indicated cell lines by immunoblotting (Figure 1A). We first analyzed the morphology and spread area of the cells in the culture. We found that the average cell spread area was reduced significantly in Mfn2-null MEFs (1303 µm2) compared to wt (2233 µm2) and Mfn1-null MEFs (2350 µm2) (Figure 1B). Mfn2-null MEFs also displayed significantly increased cell circularity (Figure 1C). To evaluate the function of MFN2 protein in the cytoskeleton and cell migration, we seeded the cells on chamber slides. We imaged them overnight using phase-contrast, time-lapse microscopy. In Mfn2-null MEFs, cell motility (0.23 ± 0.08 µm/min) was significantly reduced compared to wt (0.53 ± 0.16 µm/min) or Mfn1-null MEFs (0.49 ± 0.12 µm/min) (Figure 1D–F, Video 1). No significant change in directionality was observed in Mfn2-null MEFs (Figure 1G). During cell spreading, wt and Mfn1-null MEFs generated rapid protrusive filopodia and lamellipodia, eventually elongating to form traditional fibroblast-like shapes and began to migrate. However, the elimination of MFN2 caused significant defects in elongation, and the cells remained rounded (Figure 1H and I). The morphological differences became apparent during the spreading process, especially after 20 mins. Mfn2-null MEFs only extended round membrane ruffles but did not simultaneously form multiple short lamellae separated by concave edges. Immunofluorescence also revealed striking differences in actin stress fiber organization. Both wt and Mfn1-null MEFs displayed parallel stress fibers in the cell body, while Mfn2-null MEFs contained an enrichment in actin filaments in the cell cortex with reduced stress fibers at the center of the cells (Figure 1—figure supplement 1A). To rule out the possibility of side effects caused by long-term culture, we isolated MEFs from Mfn2flox/flox mice. The addition of Cre-expressing adenovirus induced loss of MFN2 within 48 hr, reproduced the rounded morphology, and altered actin cytoskeleton organization seen in Mfn2-null MEFs (Figure 2—figure supplement 1B–D).
Figure 1.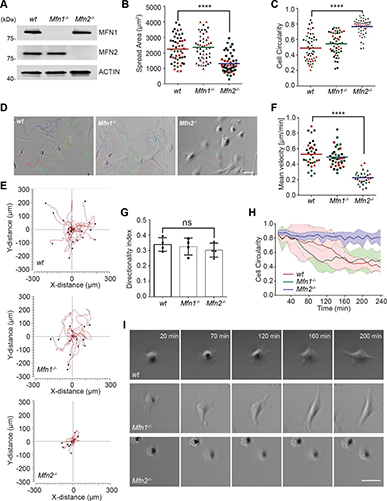
To further confirm the functional role of the MFN2 on cytoskeletal organization and cell migration, we re-expressed MFN1 or MFN2 in Mfn2-null MEFs (Figure 2A). Only MFN2 re-expression significantly increased cell motility (0.32 ± 0.18 µm/min), comparing to Mfn2-null MEFs (0.22 ± 0.18 µm/min), or those with MFN1 re-expression (0.21 ± 0.15 µm/min) (Figure 2B–D, Video 2). Notably, MFN2 re-expression also rescued the cell’s ability to polarize during the spreading process (Figure 2E), increased cell area, and decreased circularity (Figure 2F and G). Similarly, doxycycline (DOX)-induced re-expression of MFN2 for 48 hr in Mfn2-null MEFs also significantly restored the actin cytoskeleton organization and cell morphology (Figure 2J, Figure 3—figure supplement 1E and F). Additionally, re-expressing MFN2, but not MFN1, in Mfn2-null MEFs restored the tubular mitochondrial network (Figure 1- figure supplements 1G). Together, these results suggest that these cells’ morphological reorganizations and migratory defects are specifically caused by the loss of MFN2 protein in MEFs.
Figure 2.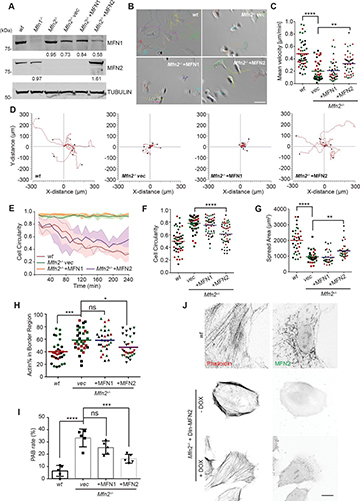
The significant differences in actin architecture in Mfn2-null MEFs, an atypical PAB, could account for the spreading and migratory defects (Figure 5—figure supplement 1A and B and Figure 2H). We used the ImageJ plugin FiloQuant (Jacquemet et al., 2019) to quantify the cells with PAB structure. We developed an algorithm to calculate the percentage of actin in the cell border region (Figure 2—figure supplement 1A and B). If the cell’s border region contains more than 50% actin, and the cellular circularity is higher than 0.6, we consider it a ‘PAB’ cell. Mfn2-null MEFs displayed a significantly higher ‘PAB’ rate (33.2%), while MFN2 re-expression reduced the average ‘PAB’ rate to 16.3% (Figure 2H and I).
Increased cytosolic Ca2+ suppresses cell migration in Mfn2-null MEFs These striking alternations in cell morphology, spreading, and migration prompted us to investigate the downstream effectors of MFN2. We focused on one of the MFN2-specific functions: maintaining cellular Ca2+ homeostasis by tethering ER and mitochondria. It was previously reported that the increased distance between ER and mitochondria in the absence of MFN2 elevates cytosolic Ca2+ transients in MEFs (de Brito and Scorrano, 2008; Filadi et al., 2015; Naon et al., 2016). We, therefore, measured cytosol Ca2+ in response to PDGF-BB stimulation and confirmed the previous observation (Figure 3A). To evaluate the effect of cytosolic Ca2+ accumulation on MEF cell migration, we treated wt MEFs with the calcium ionophore A23187, an ion carrier facilitating Ca2+ transport across the plasma membrane. A23187 increased cytosol Ca2+ levels in wt MEFs (Figure 3—figure supplement 1A). A reduction in cell migration speed was observed in a dose-dependent manner, which phenocopied the motility reduction in Mfn2-null MEFs (Figure 3B). The treatment of A23187 increased the percentage of actin in the cell border region. However, it failed to phenocopy the ‘PAB’ structure in wt MEFs (Figure 3—figure supplement 1C–E), indicating that excessive cytosolic Ca2+ is not sufficient to induce the ‘PAB’ structure.
Figure 3.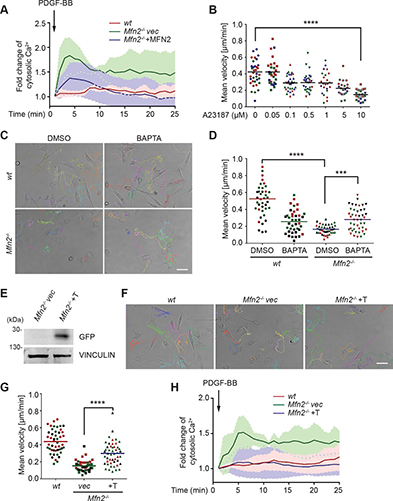
On the other hand, the ‘PAB’ structure was rescued by inhibiting cytosolic Ca2+ in Mfn2-null MEFs with an intracellular calcium chelator BAPTA-AM (Figure 3—figure supplement 1B–E, Figure 3C and D, Video 3). Consistently, the reduced motility in Mfn2-null MEFs was partially rescued, suggesting that the PAB structure and defects on migration described above in Mfn2-null MEFs can be explained, at least in part, by excessive cytosolic Ca2+.
To confirm that MEF2 regulates cytosolic Ca2+ via maintaining ER-mitochondria tether, we introduced an artificial tether construct (Kornmann et al., 2009) into the Mfn2-null MEFs (Mfn2-/-+T). The tether comprises a GFP protein carrying ER and mitochondrial localization sequences at opposite ends, which functions independently of MFN2. We adopted an established probe to detect the ER-mitochondria contacts (Vallese et al., 2020). In line with previous studies, Mfn2-null MEFs displayed significantly decreased ER-mitochondria contacts and MFN1 re-expression failed to restore the phenotype. Expressing MFN2 or the artificial tether construct restored ER-mitochondria contacts in Mfn2-null MEFs (Figure 3—figure supplement 2A and B). Indeed, expressing the tether corrected the cytosolic Ca2+ levels in response to PDGF-BB stimulation partially rescued the migration speed in Mfn2-null MEFs (Figure 3F–H, Video 4) and decreased PAB cell percentage (Figure 3—figure supplement 2C). These data suggest that MFN2 regulates cell morphology and adhesive migration in MEFs by maintaining mitochondria-ER interaction and Ca2+ homeostasis.
Elevated CaMKII activation is associated with MFN2-regulated random migration Given that cytosolic Ca2+ plays essential roles in MFN2-mediated cytoskeleton regulation and cell migration, we looked at the kinases and phosphatases regulated by Ca2+/ calmodulin (CaM), including CaMKK, CaMKII, and calcineurin, which are previously shown to regulate actin bundling (Saneyoshi and Hayashi, 2012; Figure 4A). AIP, the CaMKII inhibitor, partially restored motility in Mfn2-null MEFs. Neither the calcineurin inhibitor FK506 nor the CaMKK inhibitor STO609 had any effect (Figure 4B and C, Video 5). We found a higher level of phosphorylated or active CaMKII in Mfn2-null MEFs, which was also reduced by the expression of MFN2 or the tether (Figure 4D and E). The function of CamKII was further confirmed by expressing a wild-type (CaMKII-WT) or a dominant negative (CaMKII-DN) version of CamKII in Mfn2-null MEFs. CaMKII-DN, but not CaMKII-WT, induced a moderate but significant increase in migration velocity (Figure 4F and G, Video 6). Together, our results indicate a role of CaMKII in cytoskeleton regulation in Mfn2-null MEFs.
Figure 4.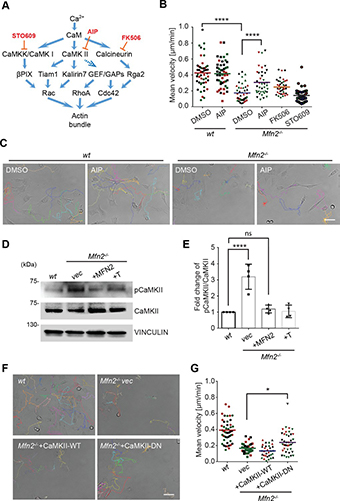
MFN2 deficiency-induced migration defect is independent of Rac and CDC42 The Rho GTPase family members are master regulators of the actin cytoskeleton and cell migration. The peripheral enrichment of actin filaments and extensive membrane ruffles we observed in Mfn2-null MEF cells resembled the classic phenotype seen in fibroblasts with constitutively active Rac (Hall, 1998). Therefore, we hypothesized that Rac might be overactivated in MFN2-depleted MEF cells. We performed a RAC-GTP pulldown and observed no significant increase in the absence of MFN2 (Figure 5—figure supplement 1A and B). In addition, the Rac inhibitor, CAS1090893, did not rescue the cell motility defect of the Mfn2-null MEFs (Figure 5-figure supplement 1C), suggesting that Rac is not the primary effector regulated by MFN2. CDC42-GTP levels are comparable between the wt and Mfn2-null cells (Figure 5—figure supplement 1D and E).
Loss of MFN2 drives overactivation of RhoA GTPase and redistribution of focal adhesions In contrast to the minor changes in Rac and CDC42 activity, we detected a marked increase of RhoA-GTP in Mfn2-null MEFs (Figure 5A and B). Restoring MFN2 expression or introducing the ER-mitochondria artificial tether brought the RhoA activation level back to the wt level. We then compared the distribution of focal adhesion protein paxillin (Pax) by immunofluorescence. The focal adhesions were fewer and restricted to the cell periphery in Mfn2-null MEFs (Figure 5C and D). In addition to the striking PAB architecture described previously, the focal adhesion complexes in Mfn2-null MEFs appeared larger, consistent with the observation of RhoA overactivation in fibroblasts (Hall, 1998; Figure 5E). We plated the cells on fibronectin, fibrinogen, or uncoated cover glasses. We discovered that the PAB formation is independent of the extracellular substrates (Figure 6—figure supplement 1A). These focal adhesion differences hinted that the spreading and migration defects in cells depleted of MFN2 might be explained, at least in part, by significantly increased RhoA activity. Moreover, BAPTA-AM treatment or DOX-induced MFN2-re-expression reduced the heightened activity of RhoA in Mfn2-null MEFs (Figure 5F and G), indicating that the cytosolic Ca2+ increase was responsible for the RhoA overactivation in Mfn2-null MEFs.
Figure 5.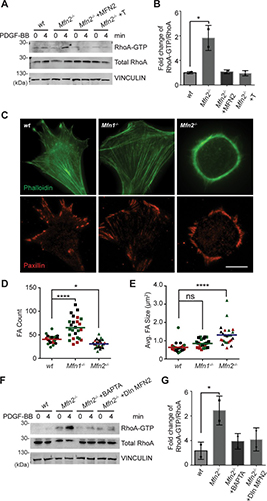
Increased myosin regulatory light chain activity is critical for PAB formation in Mfn2-null MEFs
To fully understand the downstream mechanism of MFN2 in regulating the cytoskeleton, we used pharmacological inhibitors for proteins regulated by CaM (Figure 6A, Figure 6—figure supplement 1B and C, Video 7). The RhoA inhibitor I, the Rho-associated protein kinase (ROCK) inhibitor Y27632, the myosin inhibitor Blebbistatin, and the myosin light chain kinase (MLCK) inhibitor ML-7 showed the most pronounced effects on restoring both the motility and cell morphology in Mfn2-null MEFs (Figure 6A and B, Figure 6—figure supplement 1B and C, Video 5). The focal adhesion kinase inhibitor 14 (FAK inhibitor 14), the LIM kinase (LIMK) inhibitor BMS-5, and the Arp2/3 inhibitor CK-666 had no statistically significant effects on restoring cell motility (Figure 6—figure supplement 1B). This result was confirmed by analyzing the actin filament organization and focal adhesion distribution in inhibitor-treated Mfn2-null MEFs. RhoA inhibitor-I, ML-7, Y27632, or Blebbistatin abrogated the PAB in Mfn2-null MEFs and restored typical fibroblast characteristics, including the formation of filopodia, developed cell edges, and focal adhesions at the leading and trailing edges (Figure 6C). Taken together, these findings demonstrate a potential mechanism whereby excessive cytosolic Ca2+ in the absence of MFN2 leads to the overactivation of RhoA and MLCK, which increases MLC activity and contributes to the PAB in Mfn2-null MEFs (Figure 6D, Figure 6—figure supplement 1D).
Figure 6.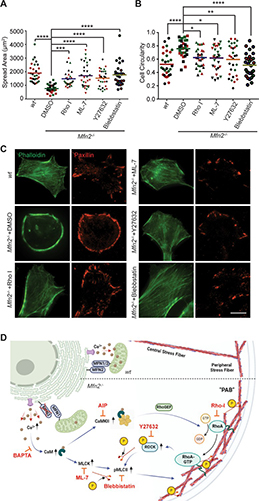
Given the essential role of the MLC, we probed for pMLCII in wt, Mfn1-null, and Mfn2-null MEFs. As expected, the pMLCII level was significantly increased in Mfn2-null MEFs (Figure 7A and B), which could be corrected by expressing MFN2 or the artificial tether in Mfn2-null MEFs (Figure 7C and D). Using immunofluorescence microscopy, we noted that pMLCII colocalized with peripheral actin bundles in Mfn2-null MEFs (Figure 7E). To confirm the importance of MLC activity, we knocked down the two MLC kinases, MLCK or ROCK, in Mfn2-null MEFs (Figure 7F). Both knockdown cell lines displayed significantly reduced pMLCII levels (Figure 7G), restored stress fiber architecture, and redistributed focal adhesions (Figure 7H). Both knockdown lines also showed significantly decreased PAB cell percentages with increases in cell spread area and more polarized morphology (Figure 7I–L).
Figure 7.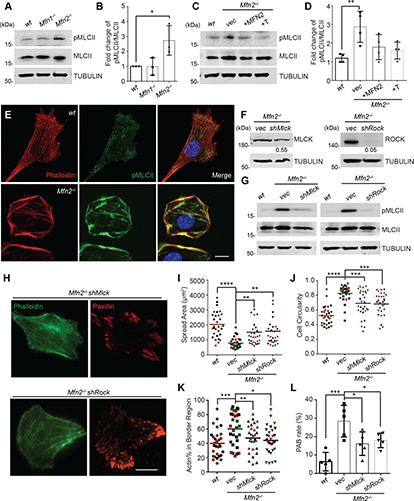
As MFN2 is a mitochondrial protein, we also performed a seahorse assay to measure mitochondrial functions in each cell line. Mfn2-null MEFs showed a decreased rate of oxidative phosphorylation relative to wt and Mfn1-null MEFs (Figure 7—figure supplement 1A and B), while MFN2 re-expression or introducing ER-mitochondrial tether increased the overall oxygen consumption rate in Mfn2-null MEFs (Figure 7—figure supplement 1C and D). Knocking down MLCK in Mfn2-null MEFs enhanced oxidative metabolism, whereas ROCK knockdown reduced oxygen consumption (Figure 7—figure supplement 1E and F). Given that MLCK and ROCK knockdown can restore cell spreading and migration in Mfn2-null MEFs, alterations in mitochondrial metabolism are unlikely to be the primary determinant in PAB formation.
Myosin regulatory light chain overexpression phenocopied MFN2 depletion Mitochondria and MFN2 regulate multiple cellular signaling pathways in addition to cytosolic calcium. To determine whether the PAB is primarily driven by RhoA or MLCK activation, we attempted to constitute the PAB in wt MEFs. We first tried Rho activator treatment or expression of constitutively active MLCK (MLCK-CA) (Wong et al., 2015; Figure 8A). Wt MEFs treated with Rho activator exhibited more and thicker bundles of actin filaments, with mesh-like structure, across the dorsal side of the cells, but maintained their overall polarized morphology. This observation is consistent with the known function of RhoA to induce central stress fiber formation in fibroblasts (Katoh et al., 2001a; Katoh et al., 2001b). In contrast, MLCK-CA expression increased peripheral stress fibers and noticeably fewer bundles of actin filaments in the central portion but maintained the classic polarized morphology. When combined (Rho activator treatment + MLCK-CA expression), the effect was increased, with the cells’ thick actin bundles along the periphery. These cells, however, retained their protrusive structures and polarized shape (Figure 8A, D, and E).
Figure 8.
To our surprise, when we attempted to image the myosin dynamics in wt and Mfn2-null MEFs, we noticed a large percentage of wt MEFs with round shapes and peripherally enriched actin filaments after overexpressing the GFP-tagged myosin regulatory light chain (MRLC-GFP) (Figure 8B and E). Cells expressing MRLC-GFP were significantly smaller and became round (Figure 8C and D). However, they still preserved their filopodia and other cell protrusions. When these cells were treated with the Rho activator, a noticeable percentage (24%) displayed the PAB morphology, including a decrease in cell area and an increase in cell roundness (Figure 8B–F). In summary, the combination of MRLC overexpression with pharmacological activation of RhoA is sufficient to drive PAB formation in MEFs.
Loss of MFN2 displays different cytoskeletal architecture with increased cell contractile forces
To better virtualize the individual actin filaments in the PAB, we performed 3D super-resolution imaging of F-actin in wt and Mfn2-null MEFs (Figure 9A). Wt MEF displays interconnected actin network including peripheral actin fibers (blue box) parallel to the cell membrane and branched actin filaments pointing to cell protrusions against membrane (green box). However, in Mfn2-null MEFs, thick actin bundles are present parallel to the cell membrane (blue box) with a region of disordered meshwork attached to the membrane (green box). Overall, stress fibers at the cell center are largely missing in Mfn2-null MEFs. We then used atomic force microscopy (AFM) to measure cell stiffness. Mfn2-null MEFs showed a softer Young’s modulus than wt cells (Figure 9—figure supplement 1A–C), consistent with the previous report that cells with apical stress fibers are stiffer than cells without (Efremov et al., 2019). We then measured plasma membrane tension using the Flipper-TR dye and FLIM imaging (Colom et al., 2018). Upon addition of the hyperosmotic sucrose solution, Flipper-TR lifetime dropped significantly in MEFs, confirming that a longer probe lifetime corresponds to a membrane environment under higher tension (Figure 9—figure supplement 1D and E). Consistently, Mfn2-null MEFs showed a lower fluorescence lifetime, indicating lower membrane tension than the wt (Figure 9-figure supplement 1F and G). The reduced membrane stiffness and tension are consistent with a less spread cell morphology.
Atomic force microscopy
An Asylum Research MFP3d Bio AFM system (Santa Barbara, CA) was used to measure the effective modulus of wt and Mfn2-null MEFs seeded in 60 mm polystyrene Petri dishes. A Nanoandmore CP-qp-SCONT-SiO-B-5 colloidal probe cantilever (Watsonville, CA) with a 3.5 µm probe diameter and 0.01 N/m nominal stiffness was used for these experiments. The optical lever sensitivity of the cantilever was calibrated using a static force–displacement curve, performed on the part of the polystyrene Petri dish not covered by the cells. The cantilever stiffness was determined to be 0.00664 N/m using the thermal tuning method in the air (Hutter and Bechhoefer, 1993). AFM indentation experiments were performed using cells in phosphate-buffered saline (PBS) solution in a 6 cm Petri dish maintained at a constant temperature of 37°C using a Petri dish heater. For imaging, a sufficient amount of PBS was used to maintain cell viability, and a 100 µl drop of PBS was placed on the AFM cantilever tip to avoid the formation of air bubbles between the cantilever holder and the sample. Force–displacement curves were acquired for each cell by indenting them at the central region of the cell, close to the nucleus. The force spectroscopy experiments were performed for a single force cycle by setting trigger points on the cantilever deflection (u) and tip velocity. A time gap of >45 s was incorporated between the indentation experiments within the same cell to account for stress relaxation. The force–displacement curve corresponding to the approach of the cantilever tip toward the substrate for each location was considered to quantify the effective cell modulus using the material properties of the cantilever and Hertzian contact mechanics model for a spherical indenting a flat plane (Hertz, 1881; Guo and Akhremitchev, 2006) According to this model, the force measured during cell indentation (F) is related to the cantilever indentation, δ, as (Johnson, 1985) F=4ER1/2tip3(1−μ2)δ32 where µ is the Poisson’s ratio, E is the effective cell modulus, and Rtip is the radius of the spherical cantilever tip. The cell is assumed to be incompressible with µ = 0.5. The force curves were delineated into a region prior to the contact point of the cantilever tip with the cell and the region after contact. Force data post-contact with the cell was used to calculate the effective cell modulus.
FLIM imaging
Cells were placed in the incubator at 37°C in a humidified atmosphere containing 5% CO2 for 20 min before imaging. For hyper-osmotic shock, MEF cells were treated with an 87 mM sucrose working solution in complete DMEM culture media devoid of phenol red and imaged after 15 min. Frequency-domain fluorescence lifetime imaging microscopy (FLIM) measurements were performed using a Nikon TE2000 confocal microscope with a 60×/1.2NA water immersion objective equipped with an Alba FastFLIM system (Sun et al., 2011). Specifically, cells stained with Flipper-TR (Cytoskeleton, CY-SC020) were excited using a 488 nm pulsed laser with a modulation frequency of 20 MHz and imaged through a 595/40 nm bandpass filter followed by MPD APD detectors. After image collection, bi-exponential fitting of FLIM images was performed using VistaVision software (ISS) to obtain fluorescent lifetimes (τ1 and τ2) of each pixel. Only the longest lifetime component (τ1) was used to represent relative membrane tension as described previously (Colom et al., 2018).
Statistical analysis
Request a detailed protocol
Statistical analysis was performed with Prism 6 (GraphPad). An unpaired two-tailed Student’s t-test or one-way ANOVA was used to determine the statistical significance of differences between groups. A p-value
Individual p-values are indicated in the figures, with no data points excluded from statistical analysis. One representative experiment of at leastthree independent repeats is shown.
Data availability All data generated or analyzed during this study are included in the manuscript and supporting file
Lipoprotein Particles as Shuttles for Hydrophilic Cargo
by Florian Weber, Markus Axmann, Andreas Horner, Bettina Schwarzinger, Julian Weghuber and Birgit Plochberger
Membranes 2023, 13(5), 471; https://doi.org/10.3390/membranes13050471
Submission received: 24 March 2023 / Revised: 23 April 2023 / Accepted: 26 April 2023 / Published: 28 April 2023
(This article belongs to the Special Issue Nanotechnologies and Nanoparticles Interaction with Bio-Membranes)
Abstract
Lipoprotein particles (LPs) are excellent transporters and have been intensively studied in cardiovascular diseases, especially regarding parameters such as their class distribution and accumulation, site-specific delivery, cellular internalization, and escape from endo/lysosomal compartments. The aim of the present work is the hydrophilic cargo loading of LPs. As an exemplary proof-of-principle showcase, the glucose metabolism-regulating hormone, insulin, was successfully incorporated into high-density lipoprotein (HDL) particles. The incorporation was studied and verified to be successful using Atomic Force Microscopy (AFM) and Fluorescence Microscopy (FM). Single-molecule-sensitive FM together with confocal imaging visualized the membrane interaction of single, insulin-loaded HDL particles and the subsequent cellular translocation of glucose transporter type 4 (Glut4)
Keywords: lipoprotein particles; shuttle for hydrophilic cargo; insulin; single-molecule-sensitive fluorescence microscopy; atomic force microscopy
1. Introduction
Non-water-soluble substances, such as fats from storage sites or food, are transported in the blood stream in the form of lipoprotein particles (LPs). LPs are micelle-like (i.e., only one lipid leaflet) transporters in higher organisms consisting of proteins (i.e., apolipoproteins) associated with lipids and other substances. Their envelope surrounds a central lipophilic core of triglycerides and cholesterol esters. LPs can be divided according to their density into high-density, low-density, and very low-density LPs (HDL, LDL, and VLDL). Briefly, LDL particles transport cholesterol to cells, and excess cholesterol is absorbed by HDL particles and transported to the liver. An imbalance between LPs may lead to an increased systemic cholesterol level and triggers inflammatory processes in blood vessels. Thus, HDL particle functionality is a promising approach for treatment of cardiovascular diseases . Specifically, HDL particles interact with certain cell types involved in lipid metabolism by binding to receptors, such as the scavenger receptor class B type 1 (SRB1), and also to the LDL receptor (LDL-R) or adenosine triphosphate-binding cassette transporters of subfamily G, member 1 (ABCG1). Some of these receptors are also overexpressed on cancer cells and atherosclerotic plaques. Consequently, LPs, especially HDLs and LDLs, represent a promising tool for drug delivery. Moreover, LPs can also be used as diagnostic markers by analyzing, e.g., their miRNA cargo. Due to their high turnover rate, their physiologically controlled metabolism, and their stability in the blood plasma, LPs are perfectly suited as shuttles for the transfer of active lipophilic substances or essential micronutrients such as vitamins. Natural and synthetic LPs have been surveyed in nanomedicine for drug release owing to the high biocompatibility, tunable carriers, as well as easy surface modification and functionalization. As reviewed by Tsujita et al., synthetic nanodisc (i.e., disc-shaped bilayers stabilized by a scaffold (apolipo)protein) HDL-like particles have been used in a variety of applications as drug carriers for amphipathic/hydrophobic molecules. Similarly, reconstituted HDL (rHDL) particles generated from an aqueous mixture of apolipoprotein(s) and lipids can be used as therapeutic delivery devices (for a review, see Fox et al.) via drug incorporation into these particles’ core or their lipid monolayer via His-tagged proteins and nickel-chelating lipids. In addition to LPs, artificial lipoplexes can be used to transfer, e.g., small interfering RNA (siRNA) for gene silencing via His-tagged targeting proteins, which are incorporated into the membrane of the lipoplexes via NTA-tagged lipids. LPs are also able to shuttle small drug molecules across the blood–brain barrier for treatment of brain diseases. Hence, insulin receptor and low-density lipoprotein (LDLR) are known key receptors expressed in the blood–brain barrier that mediate the shuttling of macromolecules.
This work examines the successful incorporation of an active substance within HDL particles and investigates their delivery as well as physiological effect. In particular, we were able to load HDL particles with insulin, which was linked to their envelope by means of a lipid-anchored Ni-NTA/His-tagged insulin complex. Using Fluorescence and Atomic Force Microscopy (FM/AFM), the insulin-loaded HDL particles were investigated with respect to their shape, interaction with biomembranes, and stimulation effect on living cells.
2. Materials and Methods
2.1. Reagents and Cells
Reagents: Sodium cyanoborohydride (NaCNBH3), CHCl3, CH3OH, CaCl2, NaCl, TriEthylAmine (TEA), 3-AminoPropyl-TriEthoxySilan (APTES), EthanolAmine (ETA), sodium deoxycholate, sucrose, glucose, 4-(2-HydroxyEthyl)-1-PiperazineEthaneSulfonic acid (HEPES), phosphate buffered saline (PBS), Hanks’ balanced salt solution (HBSS), Ham’s F12 culture medium, paraformaldehyde (PFA), dithiothreitol (DTT), penicillin, streptomycin, G418, and fetal bovine serum (FBS) were obtained from Sigma-Aldrich(Vienna, Austria). 1,2-DiOleoyl-sn-glycero-3-PhosphoCholine (DOPC) and 1,2-dioleoyl-sn-glycero-3-[(N-(5-amino-1-carboxypentyl) iminodiacetic acidsuccinyl] (nickel salt) (18:1 DGS NTA(Ni)) were obtained from Avanti Polar Lipids (Birmingham, AL, USA). Insulin polyclonal antibody Alexa Fluor 488 conj was obtained from Bioss Antibodies Inc. (THP Medical Products, Vienna, Austria). Human insulin (recombinant, His6, and N-terminus) was obtained from LSBio (eubio, Vienna, Austria). Biotin-insulin was purchased from Ibt (immunological and biochemical testsystems, Binzwangen, Germany). Alexa Fluor 647 NHS and streptavidin was purchased from Thermo Fisher Scientific (Vienna, Austria).
Cells: CHO-K1 cells stably expressing human insulin receptor and GLUT4-myc-GFP (i.e., CHO-K1-hIR/GLUT4-myc-GFP) have been described in previous studies. Briefly, these cells do not need to be differentiated, are highly sensitive to insulin, and have been well characterized regarding the concentration of insulin receptor present in the plasma membrane. The cells were grown in a humidified atmosphere (≥95%) at 37 °C and 5% CO2 and maintained in Ham’s F12 culture medium supplemented with 100 µg/mL of penicillin, 100 µg/mL of streptomycin, 1% G418, and 10% FBS. The cells were grown on clean glass slides (Ø 15 mm) for 2 days. Before measurements, the cells were starved using Hanks’ buffered saline solution (HBSS) without Ca/Mg for 2 h. As a result, the background/autofluorescence could be reduced by about 20%.
2.2. Lipoprotein Particle Isolation and Labeling
Blood donations, which were obtained from normolipidemic healthy volunteers, were approved by the Ethics Committee, Medical University of Vienna (EK-Nr. 511/2007, EK-Nr. 1414/2016). Lipoprotein particles were isolated as previously described via sequential flotation ultracentrifugation. Briefly, HDL particles were isolated from less dense lipoprotein particles and denser proteins due to the fact that they float at a density range of 1.063–1.210 g/mL. The overall solution density was sequentially increased using KBr, and these particles were separated using ultracentrifugation. The particles’ proteins were covalently linked to Alexa Fluor 647 at a pH = 8.3 according to the manufacturer’s instruction. Free dye was removed via extensive dialysis.
2.3. Insulin Loading of HDL Particles
A total of 50 µL of 18:1 DGS NTA (Ni) (CDGS = 1 mg/mL) dissolved in CHCl3 were dried in a clean glass tube under N2 gas flow while rotating the tube to gain a homogeneous lipid layer. Then, 500 µL of HDL particle solution (Cprotein = 2 mg/mL) was added to the lipid-containing glass tube and incubated for 30 min at 37 °C. Free lipids were removed via a two-step sequential flotation ultracentrifugation according to the protocol described above (Section 2.2). The purified HDL-18:1 DGS NTA (Ni) particles were incubated with 18 µL of 110 µg/mL His6-insulin for 1 h at room temperature. Free His6-insulin was removed via PD-10 desalting columns.
2.4. Immobilization of HDL Particles for Imaging via Confocal Microscopy and Force Spectroscopy Imaging
Two approaches were chosen to control the density of the immobilized HDL particles. First, the glass surface was coated with APTES. In the first case, the HDL particles loaded with 18:1 DGS NTA (Ni) lipid were incubated directly onto the APTES surface, whereas in the second case, the particles were positioned via micro-contact printing, with a concentration of 100 µg/mL in both cases. By using the second approach, the interaction surface with HDL particles was reduced by half for subsequent exchange studies and, hence, led to a decrease in transferable lipids as well. After HDL particle immobilization, insulin-His6 was added to the immobilized HDL particles, and then unbound insulin was removed by multiple washing steps. To reveal the bound insulin molecules microscopically, a fluorescently labeled antibody against insulin was used (see Figure S1 which shows the two functionalized surfaces of homogeneous versus structured HDL particles).
For the transfer experiments, an anti-insulin antibody was added after GUV contact in order to visualize transferred insulin within the target membrane. For the force spectroscopy experiments (Figure S2), force cycles were acquired using silicon cantilevers with a spring constant of 0.2 N/m (NanoAndMore, Wetzlar, Germany —CP-CONT-BSG) and a spherical tip with a nominal radius between 5 and 20 µm. The AFM probes were incubated with 30 µL (1 mg/mL) of streptavidin and subsequently washed by rinsing with PBS; afterward, they were incubated with biotin-insulin at a concentration of 100 µg/mL for 30 min. After incubation, the cantilevers were washed by rinsing with PBS. The insulin-coated spherical tip was moved toward the cell surface of CHO-K1-hIR/GLUT4-myc-GFP. The tip was held in contact at a constant force, and after 20 min, it was again retracted. Simultaneously, HILO microscopy was used to visualize the response of the labeled GLUT4 transporters on the cell membrane.
2.5. Atomic Force Microscopy (AFM)
Imaging and Particle Analysis In agreement with previously published works of other groups, the AFM measurements of HDL particles were adapted for our Atomic Force Microscope (JPK BioAFM—NanoWizard 4, JPK, Berlin, Germany). AFM probes made of silicon nitride with a nominal spring constant of 0.25 N/m and a nominal tip radius between 5 and 8 nm (FASTSCAN-D, Bruker Nano Inc., Camarillo, CA, USA) were used. The exact sensitivity and the spring constant of each cantilever were determined on a clean coverslip in 300 µL of PBS based on a force–displacement experiment and a thermal noise spectrum measurement. Native and insulin-loaded HDL particles were diluted 1:1000. A total of 300 µL of the diluted HDL particle solution were incubated on the clean glass coverslip for at least 5 min and subsequently imaged. The AFM images were obtained by using an advanced imaging mode (Quantitative Imaging mode: QI™ mode) of Bruker. The maximal force was set to 500 pN. Particle analysis (Full Width at Half Maximum (FWHM) and height) was performed with the JPK Data Processing software (V.6.1.163, JPK, Berlin). For an estimation of the central tendency of the sample heights, a model of the data density distribution was performed using “fitdist” (MatLab, Version R2020a, Mathworks, Natick, MA, USA). The model was interpreted with a probability density function using “pdf” ”(MatLab, Version R2020a, Mathworks, Natick, MA, USA). To test whether the height distribution of the different samples originated from the same population, the nonparametric Kruskal–Wallis test was performed. This test is an extension of the Wilcoxon rank-sum test.
2.6. Cell Stimulation and Giant Plasma Membrane Vesicle (GPMV) Formation
CHO-K1-hIR/GLUT4-myc-GFP cells were grown in a 96-well plate and incubated with the test substances (HBSS, 100 nM of soluble insulin, 125 µg/mL of HDL, and 125 µg/mL of insulin-loaded HDL) for 10 min. GPMV buffer (10 mM of HEPES, 2 mM of CaCl2, and 150 mM of NaCl, at a pH of 7.4) and GPMV-forming buffer (25 mM of PFA, 2 mM of DTT, 10 mM of HEPES, 2 mM of CaCl2, and 150 mM of NaCl, at a pH of 7.4) were freshly prepared. The cells were washed three times with the GPMV buffer [47] and incubated in the GPMV-forming buffer for 1 h. All incubation steps were performed in a humidified atmosphere (≥95%) at 37 °C and 5% CO2. Finally, the buffer with the formed GPMVs was transferred into the empty wells of a 96-well imaging plate.
2.7. Confocal Microscopy of GPMVs and Giant Unilamellar Vesicle (GUV)
GPMVs were imaged with a laser scanning confocal microscope (LSM 700 AxioObserver, Zeiss, Vienna, Austria). The microscope was equipped with a Plan-Apochromat 63×/1.40 Oil DIC M27 objective (Zeiss, Vienna, Austria). The LSM 700 operates with solid lasers (polarization-preserving single-mode fibers) at wavelengths of 639 nm and 488 nm. Signals were detected after appropriate filtering on a photomultiplier. Detector amplification, laser power, and pinhole were kept constant for all measurements. The images were analyzed by thresholding the signal; the average pixel value of the signals underneath the obtained mask, which followed the GPMV surface, was calculated in the respective GFP channel.
GUVs were imaged with an inverted laser scanning confocal microscope (LSM510META Confocor3, Zeiss, Vienna, Austria) equipped with a water-immersion objective (Plan-Apochromat, 40×, NA 1.2, Zeiss, Vienna, Austria). Equatorial images of GUVs were recorded at a wavelength of 488 nm via a dichroic beam splitter (488/561/633). The fluorescent signal was detected by means of an avalanche photodiode using a band-pass filter (BP 505–610 nm). The images were analyzed using the Zeiss ZEN V3.6 software with ImageJ V1.53q. DOPC-GUVs were formed using DOPC solution (10 mg/mL in CHCl3:CH3OH, 3:1) as previously published. DOPC-GUVs were transferred into chambers with surface-immobilized insulin-loaded HDL particles and incubated for 5 min. For confocal measurements, GUVs enriched with His6-insulin linked to 18:1 DGS NTA (Ni) lipids were marked with an anti-insulin antibody conjugated to Alexa Fluor 488. The cross sections of GUVs were imaged, and the Membrane Enrichment Factor (MEF) was calculated using Equation (1), where µMembrane = mean intensity value of membrane area per cross section, and µBaseline = mean intensity of background
To test whether the study populations (125 μg/mL of HDL, 100 nM of insulin, and 125 μg/mL of insulin-loaded HDL) were different compared to the basal-level population (i.e., treatment with HBSS), the nonparametric Wilcoxon rank-sum test was performed.
3. Results
Insulin-loaded HDL particles were generated to test their proposed cargo delivery to cells. The insulin molecules were anchored to the outer membrane of the particles. The particles were characterized regarding size, topological shape, loading, and transfer and interaction properties in biomembranes. The HDL particles changed marginally in their topographical appearance (Figure 1). Their transfer and their stimulation properties in artificial (Figure 2) and living cell membranes (Figure 3) were studied.
Figure 1.
Topographical analysis of HDL particle variants. (A,B) show representative topographical images of a HDL (A) and an insulin-loaded HDL particle (B) (same color scale, scale bar = 20 nm). The images were obtained using JPK BioAFM-NaonWizard 4 with the quantitative imaging mode (QI™ mode) at a maximal force of 500 pN using a FASTSCAN-D cantilever with a nominal spring constant of 0.25 N/m and a nominal tip apex radius of 5 nm. (C) shows the probability density function (pdf) of the measured height for HDL (green) and insulin-loaded HDL (violet) particles. (D) Scatter plot and error bar (mean ± error of mean) of HDL (green) particles’ and insulin-loaded HDL (violet) particles’ height. Each data point (circle, triangle) represents the height of an individual particle. The results of the Kruskal–Wallis test are indicated by connecting lines. (** p < 0.01); number of analyzed HDL particles per experiment: # (HDL) = 130, and # (insulin loaded HDL) = 13.
Figure 2.
Interaction of insulin-loaded HDL particles with artificial membranes. (A) Schematic of the lipid exchange process of His6-insulin linked to 18:1 DGS NTA(Ni) lipids. Immobilized insulin-loaded HDL particles exchange lipids with the target membrane (DOPC–GUV). (B) Top inset depicts a representative confocal image of a DOPC–GUV enriched with fluorescent anti-insulin antibodies bound to His6-insulin linked to 18:1 DGS NTA(Ni) lipids. The orange line through the GUV depicts the location of intensity cross-sectional measurement. The bottom graph shows fluorescence intensity (orange line in top inset) of anti-insulin antibody labeled with Atto488 binding to His6-insulin linked to 18:1 DGS NTA(Ni) lipids. (C) shows the scatter plot and error bar (mean ± error of mean) of MEF for every analyzed GUV membrane (N = 111). The calculation of Membrane Enrichment Factor (MEF) was performed via an analysis of the cross sections of GUV membranes (see exemplary image shown in (B)). MEF represents the ratio between mean membrane (green dotted line, µMem) and mean baseline (gray dotted line, µBase) intensities. Mean value ± error of the mean =13.4 a.u. ± 1.2 a.u. (each individual dot in (C) represents a single GUV-MEF).
Figure 3.
Interaction of insulin-loaded HDL particles with eGFP-GLUT4-expressing cells. (A) Schematic representation of the experimental approach to determine stimulation effect. (Left) Interaction and stimulation of insulin receptors of living eGFP-GLUT4-expressing cells with insulin-loaded HDL particles. The stimulation results show the translocation of intracellular eGFP-GLUT4 into the cell membrane. (Middle) Incubation with Giant Plasma Membrane Vesicle (GPMV)-formation buffer and resulting formation of eGFP-GLUT4-translocated GPMVs on the cell membrane. (Right) Extracted eGFP-GLUT4-containing GPMVs and analysis of the fluorescence signal. (B) Representative confocal microscopic images of GPMVs formed from cells incubated with HBSS (left top), HDL particles (right top), 100 nM of insulin (left bottom), and insulin-loaded HDL particles (right bottom) show a base and increased signal of eGFP-GLUT4 in the membrane (equal color scaling, scalebar 2 µm). (C) Scatter plot and error bar (mean ± error of mean) of normalized mean eGFP-GLUT4 signal per GPMV membrane for each stimulation condition in %. Hanks’ balanced salt solution (HBSS) data were used for normalization. Stimulation conditions: HBSS—basal level (black); 125 µg/mL of HDL particles (magenta); 100 nM of insulin (green); 125 µg/mL of insulin-loaded HDL particles (violet). Mean value ± error of the mean: IHBSS = 100%, IHDL = 98.0% ± 2.2%, I100 nM insulin = 127.9% ± 4.5%, and Iinsulin loaded HDL= 117.5% ± 2.0%. The test results of Wilcoxon rank-sum test compared to the HBSS results are indicated by connecting lines. (**** p < 0.0001, n.s. = no significant difference p > 0.05). Number (N) of analyzed GPMVs per stimulation condition: NHBSS = 478, N100 nM insulin = 83, NHDL = 156, and Ninsulin loaded HDL = 328.
3.1. Characterization of Insulin-Loaded HDL Particles
The topological characterization of insulin-loaded HDL particles with respect to HDL was performed using AFM measurements (Figure 1A,B). HDL particles were immobilized on a clean glass surface and subsequently imaged. The lateral size of each particle was analyzed. A statistical test for identifying different populations with respect to HDL particles was performed using the Kruskal–Wallis test. The results reveal that insulin-loaded HDL particles have a marginally increased size relative to native ones (Figure 1C,D). The height analyses of all HDL particle variants yielded the following values: (mean height ± error of mean) HDL = 13.5 nm ± 0.2 nm, insulin-loaded HDL = 16.2 nm ± 0.7 nm; # (HDL) = 130, and # (insulin-loaded HDL) = 14. Successful lipid-anchoring of insulin to HDL particles was tested using a fluorescently labeled antibody against insulin (see Figure S1).
3.2. Transfer of Lipid-Anchored Insulin from HDL Particles to Artificial Membranes
We addressed whether lipid-anchored insulin from HDL particles can be transferred to a target membrane. HDL particles were incubated with DGS-NTA lipids and subsequently purified. These modified HDL particles were immobilized via APTES to the support. Insulin-His6 was added, and then unbound molecules were removed by multiple washing steps. To demonstrate that HDL particles can transfer their lipid-anchored load to membranes solely via these particles, we added Giant Unilamellar Vesicles (GUVs) composed of DOPC lipids to the immobilized HDL particles. After the vesicles had settled, a transfer of lipid-anchored insulin previously linked to HDL particles occurred on the GUVs’ DOPC membrane (Figure 2B top). To visualize the transferred insulin molecules microscopically, a fluorescently labeled antibody against insulin was used (Figure 2A). An analysis (see method section) of the GUVs’ MEF was performed (Figure 2B bottom). The MEF of each analyzed GUV showed an enrichment of the GUVs’ membrane with insulin (MEF ± error of the mean =13.4 a.u. ± 1.2 a.u., Figure 2C).
Taken together, we observed physical transfer of insulin from HDL particles toward the GUV membranes after contact. Previous work [13,50] has demonstrated that LPs transfer/exchange their lipid load not only via receptor-mediated uptake but also via fusion with the target membrane.
3.3. Cell Stimulation via Insulin-Loaded HDL Particles
We tested whether the transfer of lipid-anchored insulin exhibits a biological effect on CHO-K1-hIR/GLUT4-myc-GFP cells via monitoring the translocation of eGFP-GLUT4 to the cell membrane. In comparison, we triggered its translocation by adding soluble insulin or native HDL particles. For the estimation of the basal level, the cells were mock treated with Hanks’ balanced salt solution (HBSS). After stimulation of the cells with each sample, GPMVs were formed, and the mean intensity of translocated eGFP-GLUT4 was analyzed using confocal microscopy (Figure 3). This method ensured that only GLUT4 incorporated into the membrane was assessed, since those close to the cell membrane were no longer observable in GPMVs. To determine the stimulation efficiency, the mean fluorescence of the membranes was normalized to the basal level of HBSS. The following results were obtained: mean ± error of the mean (number of GPMVs analyzed): HBSS (basal level) = 100% (n = 478), 125 µg/mL of HDL = 98.0% ± 2.2% (n = 156), 100 nM of insulin = 127.9% ± 4.5% (n = 83), and 125 µg/mL of insulin-loaded HDL = 117.5% ± 2.0% (n = 328). The statistical analysis was performed using the Wilcoxon rank-sum test (alpha = 5%). With respect to the basal level, incubation with HDL particles showed no significant difference, whereas the positive control with soluble insulin and insulin-loaded HDL showed a significant increase in the mean fluorescent intensity (Figure 3C). To summarize, the results clearly show a significant increase in the translocation of eGFP-GLUT4 into the cell membrane after stimulation via insulin-loaded HDL particles, similar to the physiological response triggered by soluble insulin. Thus, various modes of translocation of GLUT4 are possible, either by lipid-transferred insulin or by insulin being anchored to HDL particles.
4. Discussion
Drug administration requires strategies, processes, and interaction knowledge regarding the absorption and transport of a drug in the body in order to achieve an ideal preventive or therapeutic effect. Approaches for drug delivery systems have advanced substantially, but conventional therapeutics are often hampered by insufficient drug concentrations at the pathological lesions, lack of cell-specific targeting, and various biobarriers. Various natural nanoparticle systems have been utilized to serve as carriers for specific drugs, DNA expression vectors, RNAs, or nutritional supplements. Their unique properties regarding size and distribution, functional surface groups, high payload capacity, and ability to trigger drug release allow researchers to tailor them to the specific requirements of a drug. To avoid off-target effects and improve efficiency, a high cell specificity is essential. In addition, low toxicity of the vehicles themselves is among the most important requirements in the development of nanoscopic carriers.
In this work, HDL particles were utilized as drug carriers because of their main advantages in terms of biocompatibility/degradability and characteristics (i.e., size) as defined by apolipoprotein(s). Hence, hydrophilic biomolecules were anchored to their shell. The novelty of our work includes (i) our method of incorporation of a drug (i.e., his-tagged insulin via DGS-NTA lipid) to an otherwise unaltered, natural nanobioparticle (i.e., HDL particle), and (ii) our methods of particle characterization (i.e., AFM and FM) and biological effect measurement (i.e., confocal imaging of GPMVs). This study focuses on the characterization of the assembled particles, and their uptake and interaction with biomembranes. As an example for a transported drug, insulin was chosen. Insulin was bound to the HDL membrane via lipid anchorage and interaction with artificial membrane, and the response at a cellular level were studied. The conclusion that successful anchoring of insulin to HDL particles via lipids could be performed is supported by the marginal but statistically significant increase in their shape (Figure 1). Surfaces with different densities of immobilized insulin-loaded HDL particles were offered (Figure S1). In this regard, due to the doubled density of the loaded HDL particles, we also expected a doubling of the transferred insulin molecules. Both surfaces yielded saturation of transferred lipid-anchored insulin molecules from the HDL particles to the contacting GUV membrane. Consequently, the same amount of DGS NTA(Ni)-His6-insulin was transferred to the target membrane within 10 min, regardless of the insulin density offered. In past studies, as well as in the membrane experiments shown (see Figure 2 and Figure 3), HDL particles exchange their lipids with the target membrane. It can be concluded from these observations that insulin is also transferred to the target membrane with its lipid anchoring. Thus, a question arises regarding how lipid-anchored insulin stimulates GLUT4 transport. HDL particle-anchored insulin may interact directly with insulin receptor (i.e., particle/cell membrane interaction). Additionally, lipid-anchored insulin in the cell membrane may have the steric ability to interact with its receptor or bind to the receptor of a neighboring cell. To determine whether insulin anchored to HDL particles causes stimulation of GLUT4, insulin was directly immobilized on a spherical AFM tip and guided to the cell membrane. In this way, we generated local stimulation at the target membrane with an insulin-loaded nanopipette. An increase in the translocation of GLUT4-eGFP was observed after the local stimulation via a biotin-insulin tip (Figure S2). Thus, we conclude that local stimulation is possible, and insulin interacts directly with the cell membrane. Therefore, two stimulation effects within a cell matrix may occur, either via direct insulin-loaded HDL particles or via transferred lipid-anchored insulin from the particle to the target membrane.
In this study, HDL particles were altered to understand and improve the delivery of therapeutic agents to biomembranes This work demonstrates the successful loading of HDL particles with insulin, as well as the initiated cellular stimulation of GLUT4 transporters. Their topographical structure changes only slightly due to the incorporation of lipid-anchored molecules. Likewise, the physiological transport pathway is not expected to be affected.
Supplementary Materials
The following supporting information can be downloaded at https://www.mdpi.com/article/10.3390/membranes13050471/s1. Figure S1: Functionalized HDL surfaces; Figure S2: GLUT4 stimulation via functionalized insulin tip.
Author Contributions
Conceptualization, B.P.; methodology, B.P. and J.W.; validation, B.P., M.A. and F.W.; formal analysis, B.P., F.W., M.A. and B.S.; investigation, B.P., F.W., M.A., B.S. and A.H.; resources, B.P. and J.W.; data curation, F.W. and B.S.; writing—original draft preparation, B.P. and F.W.; writing—review and editing, M.A., J.W. and A.H.; visualization, B.P. and F.W.; supervision, B.P. and J.W.; project administration, B.P.; funding acquisition, B.P. and J.W. All authors have read and agreed to the published version of the manuscript.
Funding
This research was funded by the Federal State of Upper Austria, the “LandOÖ Basisfinanzierung”, and the Austrian Science Fund Project P 33481-B. Additionally, this research was funded by Christian Doppler Forschungsgesellschaft (the Josef Ressel Center for Phytogenic Drug Research, Wels, Austria). It was also funded by a research project of the Austrian Competence Centre for Feed and Food Quality, Safety and Innovation (FFoQSI). The COMET-K1 Competence Centre (FFoQSI) is funded by the Austrian federal ministries BMK and BMDW and the Austrian provinces of Lower Austria, Upper Austria, and Vienna within the scope of COMET—Competence Centers for Excellent Technologies. The COMET program is handled by the Austrian Research Promotion Agency (FFG).
Data Availability Statement
The data presented in this study are available from the corresponding author upon request. The data are not publicly available due to restrictions of the involved scientists and facilities.
3D-printed micrometer-scale wireless magnetic cilia with metachronal programmability
by Shuaizhong Zhang, Xinghao Hu, Meng Li https, Ugur Bozuyuk, Rongjing Zhang, Eylul Suadiye, Jie Han, Fan Wang, Patrick Onck, and Metin Sitti
Science Advances; 22 Mar 2023,Vol 9, Issue 12, DOI: 10.1126/sciadv.adf9462
Abstract
Biological cilia play essential roles in self-propulsion, food capture, and cell transportation by performing coordinated metachronal motions. Experimental studies to emulate the biological cilia metachronal coordination are challenging at the micrometer length scale because of current limitations in fabrication methods and materials. We report on the creation of wirelessly actuated magnetic artificial cilia with biocompatibility and metachronal programmability at the micrometer length scale. Each cilium is fabricated by direct laser printing a silk fibroin hydrogel beam affixed to a hard magnetic FePt Janus microparticle. The 3D-printed cilia show stable actuation performance, high temperature resistance, and high mechanical endurance. Programmable metachronal coordination can be achieved by programming the orientation of the identically magnetized FePt Janus microparticles, which enables the generation of versatile microfluidic patterns. Our platform offers an unprecedented solution to create bioinspired microcilia for programmable microfluidic systems, biomedical engineering, and biocompatible implants.
INTRODUCTION
Cilia are microscopic hair-like cellular protrusions with a typical length between 1 and 30 μm beating at tens of Hertz in the low–Reynolds number (Re) regime (Re ≪ 1). They are crucial to the survival and health of many biological systems [including human beings (3)] by performing essential functions, such as self-propulsion, food capture, self-cleaning, cerebrospinal fluid transport, mucus clearance, and egg cell delivery. These intriguing functions have inspired the creation of artificial cilia devices, such as on-chip microfluidic pumps and mixer, self-cleaning and antifouling surfaces, and droplet and particle manipulation platforms. Magnetic artificial cilia (MAC) use magnetic field as a wireless actuating stimulus. Comparing with artificial cilia driven by other stimuli, MAC can instantaneously respond to external magnetic fields and show robust controllability. Moreover, the magnetic actuation offers a safe interaction between the artificial cilia and the surrounding environment because no temperature increase or chemical changes are introduced. Biological cilia often exhibit a more complex beating pattern of metachronal wave motions, namely, adjacent cilia beat with a certain phase difference. Numerical simulations have unveiled that the metachronal motions are critical in enhancing the fluid transportation efficiencies of cilia arrays. The advances of understanding the importance of metachrony trigger the creations of metachronal artificial cilia. In literature, there are two common strategies to create metachronal MAC: (i) apply a nonuniform magnetic field to an array of identical MAC and (ii) design an array of MAC of varying magnetization directions or mechanical properties so they respond heterogeneously to a uniform magnetic field. The latter strategy is preferable because of the ease of encoding the MAC with complex magnetic profiles, leading to more freedom to program the metachrony with various phase differences. Moreover, it usually requires a simpler and cheaper actuation setup, while the first method needs a cumbersome and expensive actuation system. The previously reported metachronal MAC either lack the freedom of programming arbitrary phase differences, which leads to constrained functionalities, or they are too large in size, which limits their applications in microfluidic devices where fluids (such as reagents and cell culture media) are continuously perfused into channels that are in sizes ranging from tens to hundreds of micrometers.
In the context of biomedical applications, MAC arrays can be implanted inside the human body for controlled transportation of biofluids or objects and/or be used to study cells, tissues, and organs in bioengineering. One important design consideration for these applications is the biocompatibility of the materials used. However, the biocompatibility of MAC has not been demonstrated so far. Most of the magnetic composites used to fabricate MAC are known to be toxic to cells, such as hard magnetic neodymium-iron-boron (NdFeB) and soft magnetic nickel and cobalt. Biocompatible paramagnetic materials, such as iron oxide nanoparticles, however, have low magnetic remanence and low coercivity, which require strong actuation magnetic fields and are not able to retain programmed magnetization profiles. Recent studies have shown that the L10 ordered phase of iron-platinum (FePt) is noncytotoxic, nonimmunogenic, and highly biocompatible, while having large magnetic remanence, large coercivity, and good chemical stability. Owing to these combined properties, FePt particles/coatings have been proven to be a suitable candidate to create biocompatible magnetic micromachines. Kadiri et al. demonstrated a facile strategy to fabricate biocompatible FePt nanopropellers for cell transfection by co-depositing Fe and Pt onto silica followed by a single annealing step. Bozuyuk et al. demonstrated biocompatible FePt microrollers that can move upstream against blood flows under magnetic actuation and are compatible with multimodal high-contrast medical imaging.
“Janus” particles, named after the two-faced Roman god Janus, impart drastically different chemical/physical properties and directionality within a single particle by breaking the surface symmetry. Magnetic Janus particles have the unique property of magnetic shape anisotropy, which creates precise magnetic domains with the resolution of the size of a single particle. Recently, we demonstrated the creation of one-dimensional (1D) to 3D programmable magnetic micromachines with an overall size less than 100 μm using the two-photon polymerization (2PP) and magnetic manipulation techniques to selectively link nickel-iron alloy (NiFe) Janus microparticles (JMPs) with gelatin. Although NiFe is soft magnetic, their magnetization programmability was enabled by the inherent magnetic shape anisotropy of the JMPs. Nevertheless, less magnetic torque could be generated in comparison with hard magnetic materials. FePt-based Janus particles could fulfill both the biocompatibility and magnetic programmability requirements. In the previous work, the soft links made of gelatin were not always robust mechanically because they were sensitive to temperature changes and swell. On the contrary, silk fibroin (SF) is a Food and Drug Administration (FDA)–approved protein-based biopolymer, exhibiting low immunogenicity, excellent biocompatibility, tailorable biodegradability, and, more importantly, robust mechanical properties. SF has been applied for flexible electronics, advanced optics, photonics, and tissue engineering scaffolds. 3D printing of SF at micrometer scale has been demonstrated. However, the mechanical properties of SF hydrogel at the length scale of less than 100 μm have not been reported yet. The ability to create robust SF structures at such small scales and being able to characterize and tune their mechanical properties would boost their use in future microscopic applications.
Here, we use hard magnetic FePt JMPs and biopolymer SF to 3D print biocompatible and programmable MAC arrays at a length scale close to biological cilia using 2PP in combination with magnetic actuation controls. Magnetic, mechanical, and biological properties of the fabricated cilia were systematically investigated, showing that our cilia were mechanically tunable and robust, biocompatible, and biodegradable. Upon applying a uniform rotating magnetic field of as small as 3 mT, each cilium performed a whip-like reciprocal motion consisting of a slow forward stroke and a fast backward stroke. The difference in the orientation between neighboring FePt JMPs endowed the MAC array with heterogeneous magnetization directions, initiating a metachronal wave within the MAC array when subjected to a uniform rotating magnetic field. We demonstrated the flexibility of our fabrication platform by creating MAC arrays with designated phase differences and various locational arrangements. Although each cilium beats in a reciprocal manner, liquid transportation in the low Re regime (Re < 0.1) could be fulfilled by breaking the symmetry through attaching a flag-shaped structure on each cilium. We showcased the design and fabrication of MAC arrays to generate translational flows and locally circulating flows. This work could provide an experimental platform for biocompatible and programmable microcilia arrays with a large design space for future potential applications in microfluidic devices and cilia-inspired biomedical soft microrobots.
RESULTS
Fabrication of programmable MAC arrays
The programmable MAC arrays were fabricated by 3D printing an SF beam on the transparent half of the FePt JMPs using a commercial 2PP system integrated with a customized electromagnetic actuation setup (Fig. 1A and fig. S1). The integrated magnetic system enabled positioning and orienting the hard magnetic FePt JMPs (movie S1). The particle magnetization direction was along the normal direction of the plane separating the FePt and silica halves (fig. S2). The details of the fabrication process are as follows (Fig. 1B; see also movie S2). First, the mixture of SF hydrogel precursor solution and FePt JMPs (10 μm in diameter) was filled into a sealed polydimethylsiloxane (PDMS) microfluidic chamber (Fig. 1B and fig. S3). Second, a rectangular SF base (width × height × thickness = 10 μm × 10 μm × 5 μm) was direct laser printed on the glass substrate, serving as an anchor for the cilium. Third, by applying an out-of-plane rotating magnetic field, an FePt JMP was rolled on the glass substrate to a target location. Because the magnetic moment (m) direction of the FePt JMP tends to align with the direction of the applied magnetic field (B), one can adjust the orientation of the FePt JMP by applying an in-plane static magnetic field in the desired direction. Fourth, an SF beam (width × height × length = 1 μm × 1 μm × 10 μm) was printed to connect the FePt JMP and the SF anchor. Fifth, an array of cilia was created by repeating steps (ii) to (iv). For example, one can print three parallel cilia with a 45° phase difference of m. Sixth, the 3D-printed structures were “developed” by flushing the microfluidic channel with deionized (DI) water using a syringe pump at a flow rate of 0.5 μl min−1 for 20 min. This low flushing flow rate helps maintain the structural integrity of the printed SF beams. Last, the programmed cilia arrays were obtained on a glass substrate submerged in water. Owing to the ease of controlling the positions and orientations of the hard magnetic FePt JMPs, MAC arrays with arbitrary phase difference and locational arrangements could be programmed, such as a circular configuration with six cilia pointing outward (phase difference = 60°, Fig. 1A) and a triangular configuration with three cilia pointing at each other (phase difference = 120°; Fig. 1C). In the latter case, each cilium had an additional flag-shaped structure (fig. S4), which can be easily modified owing to the design flexibility and high 3D printing resolution (~100 nm) of the 2PP system. Note that the fabrication precision of the MAC was mainly affected by the accuracy of the FePt JMP positioning. For the 50 MAC samples that we tested, the SD of the MAC length is 0.37 μm, which is 3.6% of the average value (10.4 μm).
Fig. 1. Fabrication of programmable MAC arrays.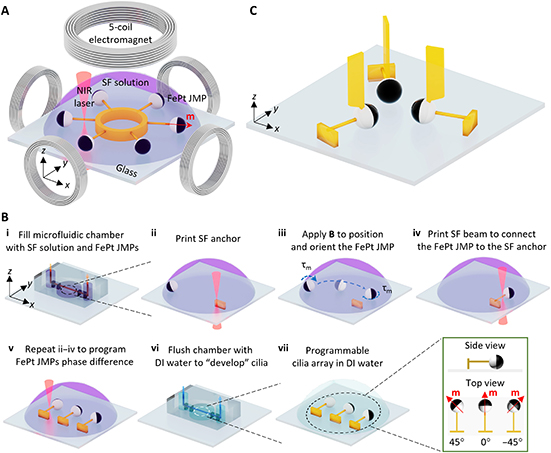
(A) Schematics of the fabrication platform consisting of a five-coil electromagnetic setup integrated inside a 2PP system (3D direct laser writing system) working with near-infrared (NIR) laser (see also fig. S1), showing that a MAC array composed of six cilia in a circular arrangement with a 60° orientation difference (i.e., phase difference) is being printed by cross-linking SF. The integrated electromagnetic setup enables the positioning and orienting of the premagnetized hard magnetic FePt JMPs whose magnetization direction is indicated by the red arrow (see fig. S2 and movie S1). (B) Schematics of the fabrication process of a representative MAC array with three cilia in a line with a phase difference of 45° (see movie S2). (C) Schematics of one representative programmable MAC array consisting of three cilia facing each other in a triangular configuration (phase difference = 120°) with each cilium containing a 3D flag-shaped additional structure, demonstrating the large design space of the platform. The geometry of the flag-shaped structure is shown in fig. S4. Illustrations are not to scale. Photo credit: Meng Li, Xinghao Hu, and Shuaizhong Zhang, Max Planck Institute for Intelligent Systems.
Magnetic, mechanical, and biological properties of the MAC arrays
The magnetic, mechanical, and biological properties of the fabricated MAC arrays were characterized systematically. FePt JMPs were fabricated by co-depositing Fe and Pt on a monolayer of silica particles (10 μm in diameter; SiO2-R-SC223; microParticles GmbH) using a molecular beam epitaxy system (see Materials and Methods). The FePt coating was 60 nm thick (41) and homogeneous (Fig. 2A and fig. S5). X-ray photoelectron spectroscopy (XPS) survey scan measurements revealed that the thin film had a 37 to 63% (±2%) ratio of Fe and Pt, which is within the range to form L10 phase of FePt (42). As shown in Fig. 2B, the FePt JMPs have a coercivity of 350 mT and a remanence of 100 × 103 A m−1 which gives each FePt JMP a magnetic moment (m) of 9.5 × 10⁻¹³A·m2. The high coercivity prevents the FePt JMPs from being remagnetized by the actuating magnetic fields (less than 10 mT). The not-too-low remanence enables the FePt JMPs to locomote swiftly following a small rotating magnetic field (10 mT). In the meantime, the not-too-large remanence causes less aggregation problems comparing with magnetized NdFeB particles; two FePt JMPs brought to contact can still be separated using magnetic controls (movie S3).
Fig. 2. Magnetic, mechanical, and biological property characterization results of the MAC.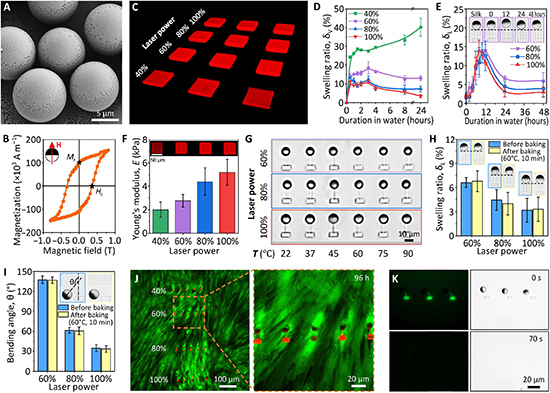
(A) Scanning electron microscopy (SEM) image of the FePt JMPs. (B) Magnetic hysteresis loop of the FePt JMPs. The inset shows the relative direction of the FePt JMPs and the applied magnetic field. (C) 3D oblique view of the confocal images of the SF blocks. (D) Volumetric swelling behavior of the printed SF blocks over time analyzed using the confocal images (see fig. S6). (E) Linear swelling behavior of the MAC over time. The insets show the swelling of one cilium printed with a laser power of 60%. (F) Young’s modulus of the SF blocks (see fig. S7). (G) Top-view optical microscopic images of the MAC under various temperatures, showing no visible shape change. (H) Measured linear swelling ratio of the MAC before and after baking at 60°C for 10 min. The insets show the microscopy images of the MAC before and after baking. (I) Measured maximal bending angle of the MAC under a uniform rotating magnetic field of 3 mT before and after baking at 60°C for 10 min. The insets show the images of a bending cilium printed with a laser power of 60% before and after baking. (J) Fluorescent images of human fibroblast cells after 96 hours cocultured with the MAC, showing no dead cells, which should exhibit a red color. The red dots are the printed SF beams and SF anchors. (K) Fluorescent and bright-field microscopic images of the MAC under a flow of protease XIV solution (1 U ml−1) at a flow rate of 2 μl min−1, showing quick biodegradation of the printed SF. Error bars indicate SDs for n ≥ 5 measurements. Photo credit: Shuaizhong Zhang, Meng Li, and Ugur Bozuyuk, Max Planck Institute for Intelligent Systems.
The mechanical properties of the MAC arrays were investigated using SF microstructures fabricated using a series of laser powers with a constant scanning speed of 10,000 μm s−1. First, time-dependent swelling was studied through measuring the volumetric change of SF blocks (length × width × height = 50 μm × 50 μm × 18 μm) over time (Fig. 2C and fig. S6; Materials and Methods). After an initial swelling and subsequent shrinking process (except for the samples printed at a laser power of 40%), the 2PP-printed SF structures reached a swelling equilibrium state after being soaked in DI water for about 1 day (Fig. 2D). The volumetric swelling ratio is defined by δ, where Vo and Vt represent the volume of the SF-blocks immediately after developing and t hours after soaking in DI water, respectively. In the final equilibrium state, the volumetric swelling ratio for SF blocks printed with a laser power of 40, 60, 80, and 100% was 40, 13, 7, and 3%, respectively. As expected, a higher laser power results in a lower swelling ratio due to a higher cross-linking density in the SF hydrogel network. During the development, unreacted reagents (photoinitiators) and uncross-linked polypeptide chains diffuse into the surrounding water and the cross-linked hydrogel network takes in water and swells. During the first 10 hours, the hydrogel volume kept increasing. Then, it decreased and reached equilibrium after 24 hours. Similar trend was also observed in literature but the reason is unclear.
Next, we directly studied the 1D swelling behavior of the printed cilia by measuring the lengths of the cilia (see Materials and Methods). The results depicted in Fig. 2E show that cilia continuously swelled in the first ~10 hours of development, reaching a maximal linear swelling ratio of around 15% for all cases (60, 80, and 100% laser power). The cilia gradually shrunk in the next 10 hours. After approximately 24 hours of soaking in DI water, they finally achieved an equilibrium state of 7, 4, and 3% for 60, 80, and 100% printing power, respectively. The trend is the same as the aforementioned results of SF blocks, although there is a discrepancy in the values. Here, the linear swell ratio is defined by δ, where Lsilk and Lt represent the length of the SF beam as printed in SF solution and t hours after developing with DI water, respectively. Note the calculated volumetric swelling ratio (1 + δL)3 using the linear swelling ratio of the SF beams is larger than the directly measured δV of the printed SF blocks. This can be explained by a larger surface area/volume ratio of the beam than the block (4.2 μm−1 versus 0.14 μm−1), which facilitates the substance diffusion and water intake. Therefore, SF beams swelled more rapidly than the SF blocks. Moreover, unlike suspended SF beams, one side of the SF blocks was fixed on the glass substrate; hence, their swelling was restricted to a certain extent.
The Young’s modulus (E) of the equilibrated SF blocks (i.e., 1 day soaked in DI water) was measured by nanoindentation using an atomic force microscope (AFM; fig. S7). The results showed that the fabricated SF structures had a Young’s modulus of between 1 and 10 kPa, the same order as soft biological tissues such as human liver. A higher laser power gives a larger Young’s modulus, making it possible to control the mechanical properties of the printed SF structures (Fig. 2F). The viscoelasticity of the SF hydrogels was characterized via dynamic oscillation, showing that the SF hydrogel was elasticity-dominated under a wide range of frequencies (fig. S8).
As the working temperature of microfluidic cilia may exceed the room temperature, for example, in organ-on-a-chip applications where human or animal tissues and/or organs are cultured and studied in a microfluidic chip, we further investigated the mechanical stability of the MAC under elevated temperatures ranging from 22°C (room temperature) to 90°C. All MAC fabricated with a laser power ranging from 60 to 100% at a constant printing speed of 10,000 μm s−1 showed no visible structural deterioration (Fig. 2G). The conclusion stands for MAC printed using different printing speeds as well (fig. S9). To further confirm their mechanical stability, we checked the swelling behavior and actuation performance of MAC arrays before and after baking at 60°C for 10 min under a rotating uniform magnetic field of 3 mT. The results depicted in Fig. 2 (H and I) showed negligible change in the geometry and actuation performance before and after baking. The resilience to temperature change shown by these SF-based MAC makes sample preparation and actuation more repeatable and dependable.
Biological properties of the fabricated MAC arrays were characterized in terms of biocompatibility and biodegradability, as they are the common prerequisites for the feasibility of cilia in biomedical applications. To demonstrate the biocompatibility of the MAC arrays, we cultured them with a human fibroblast cell line. We seeded the fibroblast cells on top of the MAC and observed their viability after 72 hours of culturing using live-dead staining. Fluorescent images showed that the cells were completely viable and exhibited healthy spindle-shaped morphology near and around the MAC arrays (Fig. 2J). Moreover, the printed SF structures can be degraded on demand using enzymes. The SF components of the MAC arrays degraded within 70 s under a flow of protease XIV solution (1 U ml−1) at a flow rate of 2 μl min−1 at room temperature (Fig. 2K and movie S4). Note that the enzyme concentration that we used in this study is orders of magnitude higher than physiological levels. In physiological environment, the silk hydrogel could take weeks or even months to degrade depending on the degree of hydrogel cross-linking, types of enzymes, environmental pH and temperature, etc. This biodegradability enhances the impact of SF materials on applications where eliminating existing structures and/or rebuilding new designs are favorable. In addition, the degradation of SF links turns the anchored FePt JMPs into surface microrollers, which can locomote and perform other functions as reported before. In phosphate-buffered saline (PBS), MAC experienced geometrical shrinkage instead of swelling as in DI water (fig. S10). This is because the ion-rich environment outside the hydrogel created an osmotic gradient that drives water out. In addition, under the same fabrication and actuation conditions, MAC exhibited an approximately 30% larger bending angle in PBS than in DI water.
Actuation of the MAC arrays
The actuation experiments of the MAC arrays were performed using equilibrated 1-day-old samples after developing with DI water. Using four current-controlled electromagnetic coils, we actuated the MAC arrays under an in-plane uniform rotating magnetic field of 3 mT in the counterclockwise (CCW) direction. Each cilium performed a 2D whipping motion consisting of two strokes: (i) a “magnetic stroke” (indicated by the blue line) when the cilium bent CCW mostly following the applied magnetic field and accumulated elastic energy in the beam until the phase lag between the FePt JMP magnetization direction (m) and the applied field direction (B) reached the maximum and (ii) an “elastic stroke” (indicated by the green line) when the cilium released the accumulated elastic energy and whipped back clockwise (CW) to its original position (Fig. 3A and movie S5). The whipping motion has been reported experimentally and numerically by many previous studies, and it resulted from a rotational buckling instability that is induced by the nonlinear relations between internal elastic stress, hydrodynamic forces, and exerted external magnetic torques. Classically, ciliary beating strokes are termed effective/power stroke and recovery stroke for a nonreciprocal motion. However, this is not applicable to our case because of the reciprocal nature of our cilia motion unveiled by recording the strokes with a high-speed camera and confirmed numerically (Fig. 3A, ii). With a CCW rotating magnetic field at 1 Hz, the cilium moved slowly during the magnetic stroke with a tip speed in the order of 100 μm/s and snapped back rapidly during the elastic stroke with a tip speed of 1500 μm/s (Fig. 3B). Here, the local Re is defined by Re = ρνL/η, in which ρ is the density of the fluid, v is the speed of the cilia tip, L is the length of the cilia (approximately 20 μm), and η is the dynamic viscosity of the fluid. For water at room temperature, the local Re during elastic stroke is 0.03. At large Re regimes, as shown by Zhang et al. (Re ~ 100), reciprocal cilia motion can generate sufficient net water flow, but at the low Re regime in our case, viscous effects dominate inertial effects and 2D reciprocal motion is unable to generate a net flow.
Fig. 3. Magnetic actuation of the MAC using rotating uniform magnetic fields.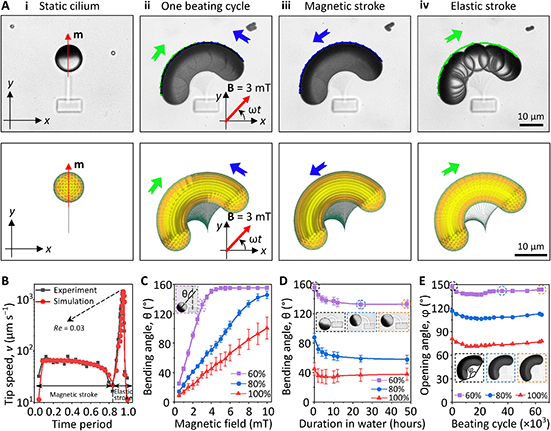
(A) Experimental (top) and numerically simulated (bottom) cilium motion at 1 Hz under a uniform magnetic field of 3 mT rotating in the CCW direction, showing a 2D reciprocal motion (see also movie S5). (i) Bottom view of one static cilium with the red arrow indicating the magnetic moment (m) direction of the FePt JMP. (ii to iv) Time-lapse images of the cilium motion during one beating cycle at 1 Hz. The images are composed of image sequences with an identical time interval of 0.002 s. The blue and green arrows indicate the direction of the magnetic stroke and the elastic stroke, respectively. (B) Cilia tip speed during one beating cycle at 1 Hz obtained experimentally and numerically. (C) Maximal bending angle θ of the MAC as a function of the amplitude of the applied magnetic field. The inset shows the definition of θ. (D) Maximal bending angle θ of the MAC printed over time under a uniform magnetic field of 3 mT rotating in the CCW direction. The insets show the bending of one cilium at times 0, 24, and 48 hours after developing with DI water, respectively. (E) Opening angle ϕ of the MAC as a function of their beating cycles, showing only slight change in the motion. The insets show the time-lapse image of a cilium during one beating cycle at 5 Hz at cycle number 1, 36,000, and 64,500, respectively. The definition of ϕ is indicated in the inset. The MAC reported in (A) and (B) are fabricated with a laser power of 60%. Error bars indicate SDs for n ≥ 5 measurements. Photo credit: Shuaizhong Zhang and Rongjing Zhang, Max Planck Institute for Intelligent Systems.
The maximum MAC bending angle, θ, was measured as a function of the amplitude of the applied rotating magnetic field. As shown in Fig. 3C, the bending angle of the cilia increased linearly with the amplitude of the applied magnetic field until the FePt JMP reached the silk anchor at 160°. The increase of the bending angle with the magnetic field is because of the increased magnetic torque τ = m × B (where m is the magnetic moment of a cilium and B is the applied magnetic field). Because of their smaller elastic modulus, the cilia printed with a lower laser power bent more under the same magnetic field (Fig. 2F). As a result of the swelling and equilibrium of the printed SF hydrogel beam, the bending angle showed a decreasing trend for the first ~24 hours of developing in water as shown in Fig. 3D. After that, the bending angle was stable (for at least another 24 hours). Durability and mechanical stability of materials facilitates their ease of use. We magnetically actuated MAC at 5 Hz for ~4 hours continuously, which corresponds for over 65,000 beating cycles. All tested cilia maintained good 2D whipping motions with only slight variation in the opening angle (ϕ) (Fig. 3E). We did not observe MAC damage after 4 hours of operation; only out of preventing our electromagnetic coil from overheating did we stop the actuation. Moreover, as shown in Fig. 3D, our MAC can maintain their actuation property after at least 50 hours after fabrication. These results show that the SF beams are operated in their elastic deformation range with minimum material deterioration, which demonstrates the actuation robustness of our cilia.
Programmable metachrony
The types of metachronal waves are defined by the relationship between the wave propagating direction and the effective stroke direction. Because our cilia beat in a reciprocal fashion, the traditional definitions are not applicable to define which stroke is the effective stroke. However, to make the discussion easier, we regarded the magnetic stroke as the effective stroke hereafter. Symplectic metachrony indicates that the wave propagating direction and the effective stroke direction are the same; antiplectic metachrony indicates the opposite, and diaplectic metachrony indicates perpendicular. More specifically, for diaplectic metachrony, dexioplectic metachrony and laeoplectic metachrony specify that the angular difference between the effective stroke direction and the wave propagating direction is 90° and −90°, respectively.
By programming the orientation difference, Δψ, between adjacent FePt JMPs in the cilia array, we were able to create programmable metachrony at a size close to natural cilia with arbitrary phase differences and arrangements (movie S6). When the cilia beams were parallel to each other and Δψ > 0 (i.e., from the top view, the FePt JMP on the left-hand side orients more in the CCW direction), the cilia array performed a symplectic metachronal motion (Fig. 4A, i). Obviously, when Δψ = 0, the cilia array beat in synchronization (Fig. 4A, ii). When Δψ < 0, the cilia array performed an antiplectic metachronal motion (Fig. 4A, iii). Diaplectic metachrony could be created by arranging the cilia in a head-to-tail manner while maintaining Δψ ≠ 0 (Fig. 4A, iv). Note that the metachrony could not be changed by altering the rotating direction of the applied magnetic field (movie S6). To validate the accuracy of the MAC fabrication process, we measured the experimental phase difference ΔΦ of seven representative examples, namely, Δψ = −π/3, −π/4, −π/6, 0, π/6, π/4, and π/3. Here, the phase difference ΔΦ is measured by, where Δt is the time lag between neighboring cilia when each cilium reaches its upright position during the magnetic stroke and T is the beating period. The results demonstrated that the deviation between the designed Δψ and experimental ΔΦ is within 5% (fig. S11).
Fig. 4. Programmable metachronal MAC array demonstrations.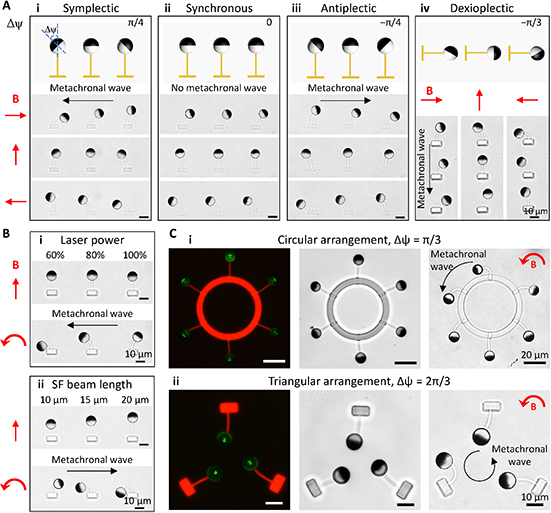
(A) Programmable metachrony by changing the orientation of the FePt JMPs and the arrangement of the MAC array (see movie S6). Δψ indicates the orientation difference of the FePt JMPs between neighboring cilia. The black arrows indicate the direction of the propagating metachronal wave. (B) Programmable metachrony by changing the mechanical properties (i) and the geometry (ii) of the MAC while keeping the orientation of the FePt JMPs the same (see movie S7). The black arrows indicate the direction of the propagating metachronal wave. (C) 2D programmable metachrony with the fluorescent microscopic images (left) showing the SF structures and the bright-field microscopic images (right) showing the orientation of the FePt JMPs and the metachronal motion of the MAC arrays (see movie S8). All the MAC shown here, except for [(B), i], are printed with a laser power of 60%. The uniform rotating magnetic field is kept at 3 mT. Photo credit: Shuaizhong Zhang, Max Planck Institute for Intelligent Systems.
Metachrony could also be created by keeping Δψ = 0 while varying the mechanical properties and/or the geometries of the SF beams such as by changing the printing power and the beam length (Fig. 4B and movie S7). In addition, by taking advantage of the large printing freedom, we could print MAC with designed 2D arrangements. For example, we created MAC array in a circular configuration with cilia tips facing outward (Δψ = π/3) and in a triangular configuration with cilia tips pointing inward (Δψ = 2π/3) (Fig. 4C and movie S8).
Microscale fluid transporting capability
Although different from the working principles of the metachronal waves in biological systems, which are commonly believed to be the hydrodynamic interactions and distal couplings among the cilia bands, our system resembles their biological counterparts in terms of metachronal motion and effective fluid transportation. However, no net flow was induced by a single cilium after a full beating cycle (Fig. 5A, i) because of the reciprocal motion carried out at low Re. To generate a net flow, one needs to break the reciprocal nature of the MAC motion. To do that, we printed a flag-shaped structure on the transparent silica half of the FePt JMP (Fig. 5B and fig. S4). Hereafter, the MAC with the additional flag-shaped structure is named F-MAC. Under a rotating uniform magnetic field (6 mT in the CCW direction), while the F-MAC body (SF beam and FePt JMP) still beats reciprocally, the additional flag moved nonreciprocally. The motion was both observed experimentally and confirmed numerically (Fig. 5B, fig. S13, and movie S9). This nonreciprocity was derived from the drastically different beating speed of the F-MAC body between the elastic stroke and the magnetic stroke (Fig. 5C). The 15-times-faster beating speed during the elastic speed led to stronger hydrodynamic drag forces on the flag structures, resulting in larger flag bending and thus smaller sweeping area and less fluid propulsion (note S1). The bending of the flag can be described by the dimensionless Sperm number, Sp, which defines the ratio of viscous-to-elastic forces acting on each cilium. Sp is defined as L[8π2ηf/EI]1/4, where L is the length of the flag (30 μm), η is the viscosity of the liquid (1 mPa·s for water), f is the beating frequency of the flag, E is the Young’s modulus of the flag (~2 kPa according to Fig. 2F), and I = tw3/12 is the area moment of inertia of the flag with t and w as the thickness (2 μm) and width (10 μm) of the flag, respectively. The calculated Sp for 5-Hz magnetic beating is approximately 1, a balance between the viscous forces and the elastic forces, indicating that negligible flag shape change is induced during the magnetic stroke. Because the cilia move much faster during the elastic stroke, the equivalent beating frequency is larger than the actuating frequency. Thus, the Sp during the elastic strokes is considerably larger than 1, indicating the dominance of the viscous forces that induce shape changes to the flag during the elastic strokes. Thus, a nonreciprocal motion is generated.
Fig. 5. Fluid transporting capability of a single cilium.
(A) Time-lapse (left) and particle tracking (right) images of the generated flow by a single cilium over a period of 30 s (see movie S10). The overlapping images are composed of 150 consecutive images of 30-s videos. The observation layers for (i) to (iii) were 10, 40, and 40 μm above the substrate, respectively. The red arrows in (ii) and (iii) indicate the flow direction. The results of the static control experiments are shown in fig. S12. (B) Bottom-view microscopic images (top), oblique-view schematics (middle), and top-view modeling results (bottom) of the F-MAC beating at 5 Hz, showing the deflection of the flag-shaped structure during the magnetic (blue arrows) and elastic (green arrows) strokes and the induced instantaneous flow (white lines in the modeling results). The red dashed lines indicate the projected flag on the substrate plane. See also fig. S13 and movie S9. (C) F-MAC tip speed during a single beating cycle at 5 Hz. (D) Measured flow speed generated by both a single normal MAC and an F-MAC. (E) Maximal bending angle θ of the F-MAC as a function of the amplitude of the applied magnetic field immediately and after 24 hours of developing with DI water. The inset shows the microscopic image of an F-MAC bending at 10 mT and the definition of θ. All the MAC beams and the flag-shaped structures shown here are printed with a laser power of 60 and 40%, respectively. The applied uniform rotating magnetic field is 3 and 6 mT for the normal MAC and the F-MAC in (A) to (D), respectively. Error bars indicate SDs for n ≥ 5 measurements. Photo credit: Shuaizhong Zhang and Rongjing Zhang, Max Planck Institute for Intelligent Systems.
As shown in Fig. 5A (ii), the nonreciprocal motion of the F-MAC that was attributed to the difference of the flag sweeping areas (note S1) could generate a net flow in the negative y direction (parallel to the long axis of the SF beam; see also movie S10). The flow direction did not change from changing the rotating direction of the applied magnetic field [Fig. 5A (iii) and movie S10]. Note that the maximal local Re of the F-MAC was 0.07 (Fig. 5C), indicating that the F-MAC is operating in the regime where viscous effects dominate over inertial effects. We analyzed the flow quantitatively using a customized Python code (see Materials and Methods). The speed of the generated net flow by a single F-MAC beating at 5 Hz was around 10 μm s−1 at a height level of 40 μm above the glass substrate (which is the top edge of the flag; Fig. 5D). The bending behavior of the F-MAC was also studied as a function of the applied magnetic field. As shown in Fig. 5E, the bending angle increased almost linearly with the magnetic field, reaching a bending angle of 125° at 10 mT. After 24 hours of soaking in water, the bending angles did not show a statistical difference between all magnetic field amplitudes, demonstrating a good mechanical stability of the printed structures. Moreover, high-speed videos show that our F-MAC could follow the applied magnetic field of up to 100 Hz (the highest frequency our setups can achieve), and no stepping-out was observed (movie S11). Although the bending angle of the F-MAC at 100 Hz obviously decreased, it can be remedied by increasing the magnitude of the applied magnetic field.
Here, we demonstrated the microfluidic transportation of the F-MAC array by creating well-controlled complex flow patterns such as local circulating and vortical flows. These flow patterns are inspired by the feeding function of cilia in coral reefs, and they have potentials to be applied in cell transportation and trapping and mixing flows for biological and chemical analysis. First, we studied the impact of metachrony on the generated flow patterns. The F-MAC arrays were arranged vertically with a pitch of 40 μm. Figure 6A shows that both synchronous and dexioplectic motion could generate translational flows while laeoplectic motion only induced local chaotic flows. This is probably caused by the so-called shielding effect of neighboring cilia: The flow induced by each cilium is obstructed by the neighboring cilia. The F-MAC with a laeoplectic metachrony shows larger intercilia shielding effect, which leads to local chaotic flows indicated by the chaotic movement of the tracer particles (Fig. 6A). Quantitative analyses revealed that dexioplectic metachrony enhanced the fluidic flow by 150%, while the laeoplectic metachrony actually decreased the flow comparing with the synchronous motion (Fig. 6B). Note that as the net flow direction generated by a single F-MAC is along the negative y direction, based on the common definition of the effective stroke in the same direction with the generated flow, the laeoplectic metachrony and the dexioplectic metachrony shown here are equivalent to the antiplectic metachrony and the symplectic metachrony, respectively. To avoid confusions with the aforementioned definitions in the “Programmable metachrony” section, we will keep our metachrony definition consistent here.
Fig. 6. Programmable flow patterns.
(A) Bottom-view optical microscopic images (left) and particle tracking results (right) of the F-MAC arrays with different metachronal configurations. The phase difference of the laeoplectic and dexioplectic metachrony is π/3 and −π/3, respectively. The particle tracking images are composed of 150 images over a 30-s period. The black arrows indicate the flow direction, and the red arrows mark the rotating direction of a 6-mT uniform magnetic field (see movie S12). (B) Measured flow speed generated by laeoplectic, synchronous, and dexioplectic F-MAC arrays at different heights above the substrate. (C) Schematic of the circular F-MAC arrangement (left) and the time-lapse particle tracking results (right). The particle tracking image is composed of 300 images over a 60-s period. The black arrows indicate the flow direction, and the red arrow marks the rotating direction of a 6-mT uniform magnetic field. The results under a rotating magnetic field in the CW direction can be found in fig. S14 (see movie S13). (D) Measured flow speeds generated by the circular F-MAC array at different heights above the substrate under different rotating directions of the magnetic field. All the MAC beams and the flag-shaped structures shown here are printed with a laser power of 60 and 40%, respectively. Error bars indicate SDs for n ≥ 5 measurements. Photo credit: Shuaizhong Zhang, Max Planck Institute for Intelligent Systems.
More complex flow patterns could be created by rationally arranging the F-MAC array. For example, when we arranged the F-MAC in a circular configuration with a phase shift of π/3, a circulating flow outside the cilia array could be generated simultaneously with a mixing flow inside the SF circle (Fig. 6C). At a height level of 40 μm above the glass substrate, the outer flow rate reached 25 μm s−1 under a 6-mT rotating field as opposed to a background drifting flow of ~3 μm s−1 under no applied field (Fig. 6D). Another example is the inward mixing flow generated by a triangularly configured 3-MAC array (fig. S15), which can find applications, for example, for particle/cell trapping and sample mixing. Vast possibilities could be explored in the future leveraging the programmability of individual cilium and the 3D printing flexibility for various local arrangements.
DISCUSSION
We have developed wirelessly actuated programmable microfluidic cilia that are composed of FePt JMPs and SF hydrogels at the length scale close to biological cilia. FePt and SF rendered our cilia system biocompatible, allowing its potential applications for biomedical and health care devices. SF also added biodegradability and tunable mechanical characteristics to our design. The high remanence of FePt JMPs in synergy with the low stiffness of SF led to large actuation deformation of our cilia under an external magnetic field of less than 10 mT. In addition, the superior mechanical stability of SF contributed to the robustness of our design over time and under elevated temperatures. Moreover, by adjusting the orientation of the identically magnetized hard FePt JMPs individually, we were able to create a programmable metachrony with controllable phase differences. The metachrony programmability was based on the orientational difference of the FePt JMPs between adjacent cilia, enabling wave propagation along the cilia array under a global rotating magnetic field. Both linear 1D arrangements (including symplectic, antiplectic, and diaplectic metachrony) and 2D arrangements (triangular and circular) could be created. Theoretically, we can fabricate 1D cilia arrays with arbitrary phase differences. However, technically, because of the generation of air bubbles when connecting the SF beam to the opaque FePt halves of the FePt JMPs, only phases ranging from −90° to +90° can be created using the current method. One could extend this range through modifying the fabrication process, such as by printing a transparent assisting ring on the FePt JMPs before connecting the SF beam to the FePt part. In addition to changing the orientation of the FePt JMPs, metachrony could also be created by introducing variations in the mechanical properties (by tuning, for example, the laser power and/or the laser scanning speed) and/or the geometries (such as the length-to-width ratio) of the neighboring SF beams.
2PP technology enabled the fabrication of sophisticated 3D architectures, yielding nonreciprocal cilia motion and designated cilia arrangements to generate both translational and complex net microfluidic flows. The nonreciprocal motion of the F-MAC, observed experimentally and confirmed numerically, was realized by taking advantage of the huge difference between the moving speeds during the two beating strokes (magnetic and elastic strokes). We found that the dexioplectic metachrony enhanced the fluid transportation by 150% while the laeoplectic metachrony inhibited the flow comparing with the synchronous motion. Previous studies have shown that both metachronies enhance liquid transportation, a result from the interplay of cilia pitch, wave speed, and channel geometry. The discrepancy between our observation and previous studies can be attributed to the different underlying mechanisms of the nonreciprocal motion: Our cilia have the additional flag structure with reciprocal beating motion, while natural cilia have a simple geometry but with nonreciprocal beating trajectories.
For future work, our method can be used to create MAC with nonreciprocal motion by linking multiple FePt JMPs in a head-to-tail fashion to form the cilia body. The magnetic and actuation programmability arises from the different orientations of neighboring FePt JMPs. One could study their fluid transporting performance with various cilia pitches and metachronal wavelengths in non-Newtonian liquids such as blood and mucus. In addition, we also envisage the realization of cell/particle manipulation (such as transporting, trapping, and repelling) using our cilia by designing starfish larva–inspired cilia arrays. The current 2D arrangement of FePt JMPs can also be improved to be 3D with the help of sacrificial layers. With the help of a sacrificial mold featured with microwells, one could speed up the fabrication process by locating the Janus particles batch by batch instead of one by one, which is currently the most time-consuming step in our fabrication process.
We envision that our robust biocompatible and biodegradable cilia array could encode unprecedented functionalities into artificial cilia at the micrometer length scale to boost their applications in microfluidics, biomedical engineering, and functional surfaces. In addition, cilia in human bodies such as brains, lungs, windpipes (or trachea), and fallopian tubes play very important roles such as mucus propulsion and fluid and egg cell transportation. Our biocompatible MAC could be fabricated on conformable substrates (such as SF thin films) in the future and be implanted to manipulate particles/cells and perform sensing tasks.
MATERIALS AND METHODS
Fabrication platform of the MAC
The fabrication platform of the MAC consists of a commercially available 2PP-based direct laser writing system (Photonic Professional, Nanoscribe GmbH, Germany) and a 5-coil electromagnetic coil setup (fig. S1). A 63× 1.4 numerical aperture oil-immersion objective (Carl Zeiss AG, Germany) was used for 3D microprinting the MAC. A refractive index matching oil (Immersol 518 f; Carl Zeiss Microscopy GmbH) was applied onto the objective to successfully detect the SF solution–substrate interface. The laser power of the 2PP system was 50 mW, which produced a printing power of 20, 30, 40, and 50 mW at a laser intensity of 40, 60, 80, and 100%, respectively. Unless otherwise specified, the laser scanning speed was kept constant at 10,000 μm s−1.
Fabrication of the PDMS microfluidic chip
The microfluidic chip was fabricated using a molding process with PDMS [10:1 (w/w) ratio of the monomer to the cross-linking agent] as precursor materials. The master mold was fabricated by standard photolithography. The PDMS chip, punched with two holes of 1 mm in diameter as inlet and outlet, was bonded to a clean cover glass with dimensions of 12 mm by 12 mm (Marienfeld Superior, Paul Marienfeld GmbH & Co. KG) by oxygen plasma–treating both the PDMS chip and the cover glass, followed by baking in an oven at 90°C for 2 hours. After filling the chamber with the mixture of SF solution and FePt JMPs, the PDMS chip was covered with a thin film of PDMS with thickness of 100 μm after injecting the mixture of SF solution and FePt JMPs to prevent evaporation.
Fabrication and characterization of the FePt JMPs
The FePt JMPs were fabricated by co-depositing Fe and Pt on a monolayer of nonporous silica (SiO2) particles (10 μm in diameter; SiO2-R-SC223; microParticles GmbH) using a custom-built molecular beam epitaxy system under an ultrahigh vacuum condition (≈2 × 10⁻⁹ to 5 × 10⁻⁹ mbar). Monolayers of the silica particle were prepared using the drop-casting method on an oxygen plasma–treated Si wafer. Fe was evaporated from an effusion cell, and Pt was evaporated from an electron beam evaporator. Both processes were manually controlled to achieve desired deposition rates, which can be measured by a quartz balance. Therefore, an atomic composition ratio of 37 to 63% of Fe and Pt was achieved, which is within the ratio range of the L10 phase of FePt. During the deposition, the substrate holder was constantly rotating to have a homogenous deposition of FePt thin film of 60 nm. This thickness in combination with the prescribed Fe-Pt ratio enables good magnetic properties while causing less aggregation problems.
Energy-dispersive x-ray and XPS measurements were conducted with a Thermo Fisher Scientific Theta Probe system for angle-resolved x-ray photoelectron spectroscopy. Magnetic characterizations were performed with a VSM (MicroSense, EZ7, Lowell, MA). These characterizations were done using the as-fabricated FePt JMPs on the Si wafer. The FePt JMPs used for fabricating the MAC were magnetized along the interface normal direction with a 1.8-T magnetic field when they were still on the Si wafer (fig. S2A). After magnetization, the FePt JMPs were released from the Si wafer by ultrasonication in DI water. There were approximately 1000 FePt JMPs per microliter in the final solution.
Preparation of the SF precursor
SF was regenerated from Bombyx mori silkworm cocoons following the established protocols.
1) Ten grams of cocoons was cut into small pieces and soaked in 4 liters of boiling 0.02 M sodium carbonate/DI water solution for 30 min. This step is to remove the sericin glue that binds the SF fibers together.
2) After degumming, the SF fibers were soaked in 4 liters of DI water for 20 min, and this step was repeated two more times to fully remove dissolved sericin. Note that SF is not water soluble at this point, so after rinsing and soaking, one can just handle the fiber bundles as normal solid.
3) The rinsed SF fibers were taken out of water and laid flat on a clean surface to be fully dried in air at room temperature overnight.
4) The dried SF fibers were dissolved in 9.3 M lithium bromide (LiBr)/DI water solution in a glass beaker. To reach a concentration of 20% w/v, for example, 20 ml of 9.3 M LiBr solution was added onto 4 g of dried SF fibers, which were tightly packed in the glass beaker. 5) Then, the beaker was covered with aluminum foil and kept in an oven at 60°C for 2 hours to allow the SF fibers to dissolve completely.
6) The sample was then dialyzed in 4 liters of DI water for 48 hours with eight changes of water to remove the LiBr and obtain an SF aqueous solution. Water changing was more frequent at earlier times because the solution contains a higher concentration of LiBr at the beginning of the dialysis. For example, we started dialysis at time 0 hours and changed water at time 1, 3, 6, 21 (overnight), 25, 30, and 45 hours (overnight) and collect the solution inside the dialysis tubing at time 48 hours.
7) To remove any solid residues, the SF aqueous solution was centrifuged at 8000 rpm for 20 min at 4°C. This step was repeated until no more visible impurities were presented in the solution.
8) The final SF aqueous solution had a concentration around 6% w/v with a batch-to-batch variation. The exact concentration can be determined by drying a known volume of the solution and then weighing the dried film. The SF solution was stored in a closed tube in a 4°C refrigerator to elongate its shelf time.
The SF solution used for fabricating the MAC was diluted to 5% w/v by adding DI water. Before use, it was filtered using a syringe filter with a pore size of 5 μm to remove impurities. Tris(2,2′-bipyridyl)ruthenium(II) chloride hexahydrate (Ru) and sodium persulfate (SPS) (Sigma-Aldrich) were added into SF solution to make it photocrosslinkable. First, 0.05 M Ru stock solution and 0.05 M SPS stock solution were prepared separately. Then, in 100 μl of 5% w/v SF solution, 2 μl of Ru stock solution was first added and mixed, and 4 μl of SPS solution was then added and mixed. Last, after sonicating the FePt JMPs solution for 20 s, 2 μl was added to the SF mixture. The final concentrations of Ru, SPS, and FePt JMPs in the precursor ink are ~1 mM, ~2 mM, and 20 μl−1, respectively. The whole preparation process was conducted in an environment without ultraviolet (UV) light. The precursor ink was used immediately after preparation.
SF swelling characterization using confocal fluorescent microscopy
The tested samples (length × width × height = 50 μm × 50 μm × 18 μm) were 2PP-printed on a glass slide using various laser powers under a constant scanning speed of 10,000 μm s−1. For each printing laser power, three identical hydrogel blocks were printed using the same precursor composition as that for fabricating the MAC. The samples were immersed in DI water and immediately observed under an inverted confocal microscope (Leica SP8 confocal microscope, Wetzlar, Germany) with a 20× objective lens. The confocal imaging was conducted using exciting laser of 522 nm, z stack range of 30 μm, and z step of 1 μm. Conventionally, to calculate object volume from 3D images, one sets a brightness threshold to generate bi-value images, separating the object from the background. The threshold method is sensitive to fluorescent intensity, which can be affected by laser power, imaging gain, postprocessing, and so on; a small change of the set threshold value can yield markedly different volume values. In our case, the hydrogel samples of different printing laser powers have different fluorescence values, and their fluorescence intensity decreases overtime. Thus, setting one threshold cannot obtain comparable results between different laser power and different time duration. After some exploration with the software, we eventually used an unsharp mask filter with maximum strength (100), maximum gamma value (10), and a high threshold value (253) to separate hydrogel blocks from the background and exclude all the areas of lower contrast (background). This works for the 3D images of all samples with different fluorescence intensities. The obtained convex volume values are stable under different laser powers, imaging settings, and various hydrogel fluorescent intensities and prevented human-introduced errors as in threshold-deciding. Among all the calculated parameters, we chose the convex volume to represent the volume of each hydrogel block. The original volume was measured immediately after developing the printed hydrogels in DI water, annotated as time 0. We kept monitoring the volumetric change for the following 100 hours, but as the fluorescent intensity of the SF hydrogel became weaker as soaking time passed, the images acquired after 24 hours had such a low signal-to-noise ratio that the software could not identify the true block boundaries. Therefore, we only measured the volume of the SF blocks for the first 24 hours.
SF Young’s modulus characterization using AFM nanoindentation
The SF samples used for characterizing the Young’s modulus were printed using the same parameters as that for the SF swelling characterization. The as-printed samples were thoroughly rinsed with DI water and followed with soaking in DI water for 24 hours to reach hydrogel equilibrium before measurements. The AFM nanoindentation measurements were conducted using a commercial AFM microscope (NanoWizard 4, JPK Instruments) with both the AFM cantilever and the hydrogel samples immersed in DI water for the entire time. The AFM cantilever (CP-CONT-BSG-B-5, NanoAndMore, GmbH) has a 10-μm-diameter spherical indenter attached to the tip. The cantilever was calibrated before each measurement. Specifically, the sensitivity (how much deflection per photodiode output) was calibrated by pressing the cantilever tip on an impressable substrate (glass slide in our case) so that the cantilever deflection Δd equals the z-motor displacement Δz (readily controlled and recorded) (fig. S7A). The calibrated sensitivity was 53.87 nm V−1 in our case by averaging sensitivity values from five different spots. The spring constant was then calibrated by fitting the thermal noise spectrum in the software and determined to be 0.484 N m−1. The z-motor approaches the sample at a speed of 1 μm s−1. The cantilever extension set point was set to 10 nN, at which point the approaching stops and z-motor moves away from the sample to retract the cantilever. For each SF block, a central area of 10 μm by 10 μm was indented using the force mapping mode with 4 × 4 points. Before the cantilever moved to the next point, after full retraction of the current sampling point, a 10-s waiting time was executed to allow the indented soft gel to recover. The Hertz model was used to fit the extension curve to obtain the Young’s modulus, E, of the SF blocks. The force baseline and the contact point were also fitted parameters. The fitting range was determined by plotting the indentation δ-fitted E curve to identify the plateau position (fig. S7B). In the case of the SF blocks printed with a laser power of 60%, the fitted E values reached a plateau after an indentation depth of 350 nm. The fitting range was set to 500 nm to fit all curves of these SF blocks. Each fitting result was checked for fitting quality; poorly fitted or abnormal curves were discarded. The E values in the central 50% range for each SF block were used to calculate the mean and SD.
To validate the used AFM measurement parameters and the fitting method, we performed bulk mechanical tests because the two methods (microscopic and macroscopic) should give theoretically the same results for the same material. We used a reference agarose gel to validate the measurements because it is impossible to 2PP-print a bulk-sized SF block, which should take days and during which the SF precursor solution would have completely cross-linked. Using the same AFM cantilever and the same testing procedure, the obtained modulus of a 0.8% agarose gel thin film was determined to be 15.1 ± 1.3 kPa. Bulk cylindrical (3 mm thick and 8 mm in diameter) 0.8% agarose gel samples were characterized by compression (TA Discovery Hybrid HR-3 rheometer with a 20-mm top plate), and the measured modulus was 14.8 ± 2.1 kPa, which fits well with the AFM results.
SF rheological analysis
The oscillation rheological measurement was conducted with bulk SF hydrogel samples using a TA Discovery Hybrid HR-3 rheometer. The silk hydrogel precursor had the same composition as that for fabricating the MAC, but instead of 2PP-printed, it was cross-linked under 365-nm UV light for 30 min in a cylindrical PDMS mold with a diameter of 20 mm and depth of 3 mm. The mold was covered with a transparent glass slide during the UV exposure to prevent solution evaporation. The cross-linked SF hydrogel was immersed in DI water for 1 hour before the test. For the rheometer setup, we used a parallel top plate with a diameter of 20 mm. The SF hydrogel was placed on the bottom plate, and the top plate was slowly lowered to bring full contact with the hydrogel but without significant pressing by limiting the axial force below 0.05 N. We first conducted strain amplitude sweep at 6.28 rad s−1 (1 Hz) to identify the linear viscoelastic region to be below 0.06%, in which region the hydrogel network structure is not irreversibly broken. Then, we did a frequency sweep in the range of 0.1 to 620 rad s−1 under a constant 0.01% strain.
MAC beam swelling characterization
The swelling of the MAC beams at room temperature was characterized by measuring their lengths using the inverted optical microscope of the 2PP system with the 63× oil-immersion objective. The tested samples were printed with various laser powers under a constant scanning speed of 10,000 μm s−1. At least five MAC were fabricated and measured for each laser power. The lengths of the MAC beams were measured before and after developing with DI water and PBS, respectively, over a period of 48 hours in a sealed microfluidic chamber.
The qualitative swelling of the MAC beams under elevated temperature was tested using a digitally controlled microscope heating stage (Pola vis P390) under a Zeiss Axio Imager M2 microscope with a 20× objective. The tested samples were printed with various laser powers under a constant scanning speed of 10,000 μm s−1. At least five MAC were fabricated and measured for each laser power. The as-fabricated samples were developed with DI water and soaked in DI water for 24 hours to reach hydrogel equilibrium before testing. The temperature was ramped from room temperature to 90°C with a 10°C step. At each temperature, the samples were retained for 10 min to reach temperature equilibrium. The qualitative swelling of SF bridges fabricated with various laser powers and scanning speeds were also tested using the same method. The quantitative swelling of the MAC beams before and after baking at 60°C were measured using the optical microscope of the 2PP system with the 63× oil-immersion objective. The baking was done using a commercial hot plate for 10 min, and the lengths of the MAC beams after baking were measured after the samples cooled down to room temperature.
MAC bending characterization
The bending performance of the MAC was characterized using the inverted optical microscope of the 2PP system with the 63× oil-immersion objective. The tested samples were printed with various laser powers under a constant scanning speed of 10,000 μm s−1. At least five MAC were fabricated and measured for each laser power. The maximum bending angle θ of the MAC beating at 0.5 Hz in DI water or PBS was measured from recorded videos of 100 frames per second (fps).
Biocompatibility and biodegradability tests
Biocompatibility tests of the MAC were conducted with human fibroblast cells, CRL-2522. The cells were obtained from the American Type Culture Collection (Rockville, MD, USA). The cells were precultured in Gibco Minimum Essential Media supplemented with 10% v/v fetal bovine serum, penicillin (50 UI ml−1), and streptomycin (50 μg ml−1) in a humidified, 37°C, 5% CO2 polystyrene cell culture flask. For the biocompatibility experiments, glass slides containing the MAC were sterilized and then incubated with fibronectin (50 μg ml−1) for 2 hours at 37°C. To ensure a thorough sterilization, the PDMS microfluidic chips were removed before sterilization. The treated slides were then transferred to 35-mm cell culture flasks, and 0.5 × 10⁶ cells were seeded. After 96 hours, the viability of the cells was examined with the LIVE/DEAD Viability/Cytotoxicity Kit (Invitrogen, Thermo Fisher Scientific, Waltham, MA) using a fluorescence microscope (Eclipse Ti-E; Nikon, Tokyo, Japan). The tested MAC were printed with various laser powers under a constant scanning speed of 10,000 μm s−1. At least five MAC were fabricated and measured for each laser power.
The biodegradability test of the MAC was conducted at room temperature under a flow of protease XIV solution at 1 U ml−1 (protease from Streptomyces griseus, type XIV; Sigma-Aldrich) at a flow rate of 2 μl min−1 controlled by a syringe pump (KD Scientific Inc., Holliston, MA). Three MAC printed with a laser power of 60% and a scanning speed of 10,000 μm s−1 were tested under an inverted microscope (Zeiss Axio Observer A1, Carl Zeiss, Oberkochen, Germany). A video was taken at a frame rate of 10 fps. Both bright-field and fluorescent microscopic images were taken before and after the experiments. The used MAC were developed with DI water and soaked in DI water for 24 hours before the biodegradable test.
Characterization of the MAC motion and the generated fluidic flow
The actuation experiments of the MAC were performed using equilibrated 1-day-old samples after developing with DI water. The normal MAC and F-MAC were actuated under an in-plane uniform rotating magnetic field of 3 and 6 mT, respectively, produced by a custom-built four-coil electromagnetic setup. A high-speed camera (Phantom Miro M310, Vision Research, Ametek Inc.) connected to the Zeiss Axio Observer A1 inverted microscope was used to record the MAC motion at a frame rate of 500 fps. The MAC tip speed was analyzed with the Manual Tracking add-on in ImageJ. The time-lapse images shown in Fig. 3 and fig. S13 were composed by stacking the high-speed images using the Z Project function in ImageJ.
For fluid transporting experiments, the MAC were developed with DI water seeded with 2-μm tracer particles at a flow rate of 0.5 μl min−1 using a syringe pump (KD Scientific Inc., Holliston, MA). The fresh normal MAC and F-MAC were actuated at 5 Hz under an in-plane uniform rotating magnetic field of 3 and 6 mT, respectively. The generated flows at different height levels above the glass substrate were recorded by the high-speed camera at a frame rate of 50 fps. The tracking of the tracer particles was performed using an in-house Python script with the Trackpy package (66), which was validated using the Manual Tracking add-on in ImageJ. The time-lapse images shown in Figs. 5 and 6 were composed by stacking the high-speed images at a 10-frame interval using the Z Project function in ImageJ. Note that the tracked trajectories of the tracer particles in the particle tracking images shown in Figs. 5 and 6 are not the results of the tracer particles moving completely for 30 or 60 s because some particles are going out of focus and unable to be tracked and some particles are entering and exiting the observed area now and then. The flow speeds shown in Figs. 5D and 6 (B and D) were obtained by averaging the velocities of the tracer particles within a surface area of 300 μm by 400 μm over a time period of 30 s, within a surface area of 400 μm by 400 μm over a time period of 60 s, and within a surface area of 375 μm by 500 μm over a time period of 30 s, respectively.
Acknowledgments
We thank A. Aghakhani for providing the Python code for tracking the tracer particles, A. Shiva and N. Krishna-Subbaiah for helping with Nanoscribe 3D printing, and A. Shiva for helping with the VSM measurements.
Funding: S.Z., X.H., and M.L. were funded by the Alexander von Humboldt Foundation. J.H. and F.W. were financially supported by the China Scholarship Council under the grant number of 202006280382 and 202104910060, respectively. This work was funded by the Max Planck Society and the Fundamental Research Funds for the Central Universities. M.S. was also funded by European Research Council (ERC) Advanced Grant SoMMoR project with grant no. 834531.
Author contributions: S.Z., X.H., and M.L. conceived and designed the research, performed all experiments, and wrote the manuscript. U.B., E.S., J.H., and F.W. assisted with the experimental procedures. R.Z. performed the numerical simulation, and P.O. supervised such simulation study. M.S. participated in the research conception, design, and discussions and supervised the whole study. All authors participated in manuscript editing.
Competing interests: The authors declare that they have no competing interests.
Data and materials availability: All data needed to evaluate the conclusions in the paper are present in the paper and/or the Supplementary Materials.
Cell clusters softening triggers collective cell migration in vivo
by Cristian L. Marchant, Abdul N. Malmi-Kakkada, Jaime A. Espina & Elias H. Barriga
Cell clusters softening triggers collective cell migration in vivo. Nat. Mater. 21, 1314–1323 (2022). https://doi.org/10.1038/s41563-022-01323-0
Abstract
Embryogenesis, tissue repair and cancer metastasis rely on collective cell migration. In vitro studies propose that cells are stiffer while migrating in stiff substrates, but softer when plated in compliant surfaces which are typically considered as non-permissive for migration. Here we show that cells within clusters from embryonic tissue dynamically decrease their stiffness in response to the temporal stiffening of their native substrate to initiate collective cell migration. Molecular and mechanical perturbations of embryonic tissues reveal that this unexpected mechanical response involves a mechanosensitive pathway relying on Piezo1-mediated microtubule deacetylation. We further show that decreasing microtubule acetylation and consequently cluster stiffness is sufficient to trigger collective cell migration in soft non-permissive substrates. This suggests that reaching an optimal cluster-to-substrate stiffness ratio is essential to trigger the onset of this collective process. Overall, these in vivo findings challenge the current understanding of collective cell migration and its physiological and pathological roles.
Main
A wide variety of biological processes such as embryogenesis, tissue repair and cancer metastasis rely on the migration of individual cells or on the coordinated movement of cell clusters via a process named collective cell migration (CCM)1,2. The interaction between migrating cells, or clusters, and the mechanical properties of their substrates have been widely studied in vitro3 and more recently in vivo4,5. Thus, it is well established that stiffer substrates favour individual and CCM and in vitro evidence support the idea that the elastic properties of migrating cells and their environment are directly dependent6,7. However, recent in silico and in vitro evidence indicates that this may not be the case when cells are plated on compliant surfaces, such as those observed in some in vivo environments8,9. Hence, whether and how cells or group of cells that migrate in a dynamic and convoluted in vivo environment adjust their mechanical properties in relation to the substrate remains unclear. Here we study the mechanical interplay between migrating cell clusters and their native substrate in vivo using as a model the collective migration of the Xenopus laevis cephalic neural crest (NC), a mechanosensitive embryonic cell population whose invasive ability has been likened to cancer10. We find that cells in these migrating clusters dynamically decrease their stiffness in response to substrate stiffening thus triggering CCM. This behaviour is mediated by a mechanosensitive pathway involving Piezo1-mediated microtubule deacetylation. We further show that cell clusters can be stimulated to migrate by biochemically decreasing microtubule acetylation, even when in soft substrates, suggesting that an optimal cluster-to-substrate stiffness ratio is involved in CCM onset.
Reduction of cluster stiffness at the onset of CCM in vivo
The NC forms at the border of the neural plate10 and it is clear that their CCM is mechanically triggered by stiffening of the head mesoderm, a tissue that cells within the NC cluster use as a migratory substrate in vivo4,11,12 (Fig. 1a). However, whether the NC adjusts its elastic properties in response to mesoderm stiffening and the molecular mechanism mediating this response remain unknown. To address this, we first measured the apparent elastic moduli (referred to here as stiffness) of wild-type mesoderm and NC from non-migratory to migratory stages by using in vivo atomic force microscopy (iAFM) (Fig. 1b, iAFM controls in Extended Data Fig. 1 and Methods). Our iAFM measurements revealed that NC stiffness is reduced at the onset of CCM, reaching similar values to those registered in the mesoderm at this stage (Fig. 1c). These results indicate that, as proposed in silico and in vitro8,9, migrating clusters resting on a soft substrate are not necessarily soft and that stiff surfaces do not always induce cell cluster stiffening. In contrast, we observed that mesoderm stiffening seems to reduce the elastic properties of the NC in vivo.
Fig. 1: NC cells reduce their stiffness at the onset of CCM in vivo.
a, Diagram represents a cross-section of a X. laevis embryo showing the development of NC (HM, head mesoderm; ML, mediolateral; AP, anteroposterior; DV, dorso-ventral). Cephalic or cranial NC originates from ectoderm at the border of the neural plate and their CCM is triggered by stiffening of the head mesoderm, the NC migratory substrate. b, Schematic showing the regions measured by iAFM in wild-type or treated embryos, black arrows point to the recorded regions. c, Spread of data for each condition as stated in the figure, red lines represent the mean and whiskers the standard deviation (s.d.) (two-tailed t-test ****P < 0.0001, ***P = 0.0004, CI = 95%, nnon-migratory mesoderm = 12, nmigratory mesoderm = 11, nnon-migratory NC = 11, nmigratory NC = 12 embryos; 64 indentations were performed per embryo). d, Top left inset in the graph correspond to a simplified representation of our mathematical model used to obtain Rg2. Briefly, the behaviour of cells (which are connected between them, red dots, and connected to the substrate, green dots) was simulated at varying stiffness values when spreading on a substrate of fixed stiffness (magenta). The result of these simulations is shown as a chart were Rg2 calculations under different Esub/Ecell regimes are presented, lines represent Rg2 over time. e, Comparison of in silico (shaded blue lines) and ex vivo (shaded black lines) Rg2 calculations (Esub/Ecell > 1 in both conditions). Inset showing potential outcomes of Rg2 ≅ tγ as an output of cell directionality; directionality extracted from in silico (solid blue lines) and ex vivo (solid black lines) Rg2 ≅ tγ are shown.
In light of these observations, we next sought to gain further insights into the effect of NC stiffness on cell migration by integrating our in vivo AFM data into a three-dimensional active particle computational model using the agent-based framework13,14,15 (Supplementary Note). In the model, individual cells are represented as spherical agents that interact with both other cells within the cluster and with their substrate (inset Fig. 1d). Our simulations take as an input the ratio of the substrate (sub) to cell (i) stiffness (Esub/Ei) with Ei in the range of stiffness values recorded in the NC from non-migratory to migratory stages (roughly 150 to 500 Pa), and Esub was set at roughly 150 Pa, which is the stiffness of the mesoderm at migratory stages (simulation details in Supplementary Note). Then, the effect of (Esub/Ei) in the spreading of cells within a cluster was determined through the collective variable radius of gyration squared16,17,18 (Rg2, details in Methods). Briefly, the ability of cells within a cluster to directionally spread can be described as an increase in Rg2 as a function of time (t), (inset Fig. 1e). Thus, while low Rg2 values with γ < 1 as well as short and non-persistent cell tracks report poor migration, larger increases in Rg2 values with γ > 1 and longer as well as persistent tracks will account for effective and directional migration17,18. Our simulations reported that clusters effectively spread at higher Esub/Ei values, as shown by rapid increases in Rg2 (Fig. 1d). We also observed a high degree of directional motion as revealed by extremely high γ values (solid blue line Fig. 1e) and long as well as persistent cell tracks (Extended Data Fig. 2). Consistently, the dynamics of wild-type NC cells spreading from clusters plated on permissive substrates ex vivo, in which an Esub/Ei of roughly 1 fitted our in silico observations in terms of Rg2 increases and directionality (grey and black lines in Fig. 1e), as well as in cell trajectories (Extended Data Fig. 2). On the other hand, we found that at low values of Esub/Ei there is no major change in Rg2 (Fig. 1d) and individual cell tracks were short and no persistent reflecting poor and non-directional motion (Extended Data Fig. 2). Our in silico data postulate that if cells within a NC cluster are stiffer than their substrate, they should fail to migrate and that to collectively migrate the NC require reducing their stiffness. This agrees with our measurements at non-migrating stages, where Esub/Ei was low (Esub/Ei roughly 0.22) when compared to higher Esub/Ei recorded at the onset of CCM (Esub/Ei roughly 0.90) (Fig. 1c).
Microtubule deacetylation triggers CCM in vivo
Next, we explored the mechanism by which the NC adjust its elastic properties to collectively migrate, as this would allow us to further validate our model predictions and to experimentally demonstrate the impact of the recorded decrease of NC stiffness in CCM. While several cytoskeletal components contribute to cell stiffness19, recent in vitro evidence proposes a central role for microtubule acetylation in tuning cell mechanics both directly and indirectly20,21,22. Given that acetylation of the lysin 40 of α-tubulin (K40-Ac) is relevant for cell motility in vitro23, an interesting possibility is that this post-translational modification could mediate the adjustment of NC mechanics in response to mesoderm stiffening. Our in vivo analyses revealed that at non-migratory stages the NC display high levels of microtubule acetylation with subsequent reduction when transiting into migratory stages (Fig. 2a–c). To confirm that this reduction in acetylation is required for the onset of CCM in vivo we grafted control NC expressing wild-type α-Tubulin-GFP or hyperacetylated NC expressing an α-Tubulin mutant that mimics hyperacetylation (K40Q-GFP, ref. 24) into wild-type host embryos (Fig. 2d,e). While control NC grafted into wild-type host embryos collectively migrated, hyperacetylated NC displayed inhibition of CCM, as reflected by comparing their net displacement to the control (Fig. 2f–i, controls in Extended Data Fig. 3). Complementarily, we addressed whether the observed reduction in microtubule acetylation (Fig. 2a–c) is sufficient to trigger NC CCM. For this we grafted control or hypoacetylated NC (expressing K40R-GFP, ref. 24) into non-migratory wild-type host embryos (Fig. 2j,k). While control NC grafted into wild-type host embryos did not migrate, hypoacetylated NC displayed premature CCM (Fig. 2l–o; controls in Extended Data Fig. 3). Together, these in vivo experiments show that a reduction in microtubule acetylation is essential to allow the onset of NC CCM in vivo.
Fig. 2: Microtubule deacetylation allows the onset of CCM in vivo.
a–c, NC undergo deacetylation in vivo. a, Schematic showing the plane of sectioning (HM, head mesoderm; ML, mediolateral; AP, anteroposterior; DV, dorso-ventral). b, In the upper panel, representative confocal projections of transverse cryosections showing highlighted NC nuclei (cyan) and fibronectin (magenta) at non-migratory and migratory stages; in the lower panel, colour-coded projections of the acetylated α-Tubulin channel are shown (scale bar, 100 μm); an inset from the NC region emphasizing the signal differences between both stages is shown in the upper right corner (scale bar, 50 μm). a.u., arbitrary units. c, Normalized acetylated α-Tubulin fluorescence intensity; spread of data from the indicated conditions is shown, red lines represent median and whiskers represent interquartile ranges (two-tailed Mann–Whitney ****P < 0.0001, CI = 95%, nnon-migratory = 17, nmigratory = 17 embryos). d–o, Graft experiments. d, Diagram of wild-type (WT) stage 17.5 (premigratory) NC grafted into stage 17.5 wild-type host embryos. e, Diagram of hyperacetylated stage 17.5 NC grafted into stage 17.5 wild-type host embryos. f,g, Embryos displaying the results of the grafts shown in d and e, respectively. h, Percentage of embryos displaying NC migration; histograms represent the mean and error bars the s.d. i, Normalized displacement of NC along the dorso-ventral axis; red lines represent mean and whiskers s.d. (two-tailed t-test, ****P < 0.0001, CI = 95. In f and g, ncontrol = 22, nhyperacetylated = 22 animals). j, Diagram of wild-type stage 17.5 NC grafted into wild-type stage 14 (non-migratory) host embryos. k, Diagram of hypoacetylated stage 17.5 NC grafted into stage 14 wild-type host embryos. l,m, Embryo displaying the results of the grafts shown in j and k, respectively. Open neural plate highlighted in white lines with its width indicated by red lines. n, Percentage of embryos displaying NC premature migration; histograms represent media, error bars s.d. o, Normalized displacement of NC along the dorso-ventral axis; red lines represent mean and whiskers s.d. (two-tailed t-test, ****P < 0.0001, CI = 95. In l and m, ncontrol = 20, nhypoacetylated = 20 animals). Panels in b,f,g,l,m are representative examples of at least three independent experiments (scale bars in f,g,l,m, 200 μm).
Microtubule acetylation modulates cell and cluster stiffness
To quantify the impact of microtubule acetylation on NC stiffness we used in vivo AFM (Fig. 3a). As previously observed the stiffness of wild-type NC showed a consistent reduction from non-migratory to migratory stages, but this trend was no longer observed in hyperacetylated NC, as this treatment yielded higher stiffness values (Fig. 3b). On the other hand, hypoacetylated NC displayed low stiffness values when compared to the control (Fig. 3b). Thus, to confirm whether the impact of microtubule acetylation in NC migration can be explained by its influence on NC stiffness, we integrated our AFM results into our theoretical framework. For this, we simulated the behaviour of clusters containing cells with stiffness values recorded from control, hyperacetylated and hypoacetylated NC when migrating in a permissive substrate (Supplementary Note). Our simulations confirmed that while control tracks and Rg2 index were consistent with a migratory and directional behaviour, hyperacetylation treatments yielded shorter cell tracks with lower and constant Rg2 index, reflecting a poor migratory behaviour of cells within these clusters (Extended Data Fig. 4). On the other hand, hypoacetylation generated rapid and overall higher increases in Rg2 that was consistent with large and more directional individual tracks, indicating that low levels of acetylation favour migration (Extended Data Fig. 4). To validate our model predictions more accurately, we analysed the impact of microtubule acetylation in the migratory behaviour of NC clusters containing control, hyperacetylated and hypoacetylated cells in an ex vivo migration assay and extracted experimental Rg2 index, and cell tracks for these conditions (Methods and Extended Data Fig. 4). Our ex vivo results reproduced the model predictions with cell migration being reduced by microtubule hyperacetylation and enhanced by hypoacetylation (Extended Data Fig. 4 and Supplementary Video 1). Together, these results indicate that microtubule acetylation affect NC stiffness and with that the onset of CCM.
Fig. 3: Microtubule deacetylation modulates NC cell stiffness.
a–g, AFM measurements. a, Diagrams showing in vivo AFM measurements (ML, mediolateral; AP, anteroposterior; DV, dorso-ventral). b, Spread of data for each condition; red lines represent median and whiskers represent interquartile ranges (two-tailed Mann–Whitney test, ****P < 0.0001, ***P = 0.0009, CI = 95%, nControlNCSt13 = 13, nControlNCSt21 = 10, nHyperacetylatedNCSt21 = 12; nHypoacetylatedNCSt21 = 10 embryos; 64 indentations per embryo). c, Diagrams showing ex vivo single cell AFM measurements. d, Spread of data is shown; red lines represent median and whiskers represent interquartile range (two-tailed Mann–Whitney test, ****P < 0.0001, ***P = 0.0002, CI = 95%, nControl = 10, nHyperAcet = 10, nHypoAcet = 10 cells; 25 indentations per cell). Table inset in d compares the stiffness of hyperacetylated NC and clusters obtained in b and d. e, Diagram showing in vivo AFM measurements in control and E-cadherin knockdown (E-cadMO) embryos. f, Spread of data is displayed; red lines represent mean and whiskers s.d. (two-tailed t-test, ****P < 0.0001, CI = 95%, nControl = 8, nEcadMO HyperAcet = 8 embryos; 64 indentations per embryo). g, Graph compares data from b, d and f; red lines represent mean and whiskers s.d. (two-tailed t-test, *P = 0.0221, CI = 95%, nHyperAcetCollective = 12 embryos, nHypeAcetSingle = 10 cells; nEcadMO+HyperAcet = 8 embryos). h–m, Graft experiments. h, Wild-type stage 17.5 (premigratory) NC grafted into wild-type host embryos. i, Embryos at stage 24 (migratory) displaying migration. j, Stage 17.5 NC from hyperacetylated embryos treated with E-cadherin morpholino were grafted into stage 17.5 wild-type host embryos. k, Embryos at stage 24 (migratory) in which migration was inhibited. l, Percentage of embryos displaying NC migration; histograms represent mean, error bars s.d. m, Normalized displacement of NC along the dorso-ventral axis; red lines represent mean and whiskers represent interquartile ranges (two-tailed Mann–Whitney test, ****P < 0.0001, CI = 95. In i and k, nWT>WT = 18, nEH>WT = 16 animals). Panels in i,k are representative examples of at least three independent experiments (scale bar, 200 μm).
Next, we sought to gain further insights about the level and the mechanism by which microtubule deacetylation control the observed reduction of NC stiffness. Individual cell tracks extracted from Rg2 calculations (Extended Data Fig. 4) and ex vivo mosaic experiments (Extended Data Fig. 5 and Supplementary Video 2) elicited a cell autonomous effect of microtubule acetylation in NC spreading. Thus, we next addressed whether the effects in NC stiffness observed after perturbing microtubule acetylation find their origin at the single cell level. Single cell AFM measurements (Fig. 3c and Methods), confirmed that while hypoacetylation reduces the elastic properties of isolated NC cells, hyperacetylation increases NC cell stiffness (Fig. 3d), reproducing the trend observed when measuring NC clusters in vivo (Fig. 3b). The impact of hyperacetylation in cluster stiffness was slightly higher than its impact at the single cell level (inset table in Fig. 3d). One potential explanation for this could be a retention of E-cadherin at cell–cell junctions25; indeed, we tested this and observed that hyperacetylation retained E-cadherin at the NC junctions (Extended Data Fig. 6). Yet, the inhibition of E-cadherin in hyperacetylated NC reveals a partial but not statistically significant effect on the stiffness of NC clusters in vivo (Fig. 3e–g). Furthermore, the inhibition of E-cadherin in hyperacetylated NC did not rescue CCM (Fig. 3h–m) and E-cadherin knockdown per se was not sufficient to promote premature NC migration (Extended Data Fig. 6), unlike what we observed upon microtubule hypoacetylation (Fig. 2j–o). This suggests that while being a hallmark for the mechanically triggered onset of NC CCM4, E-cadherin reduction may not be the main contributor to the decrease of NC stiffness. Altogether, these results indicate that microtubule deacetylation is one of the main components of the mechanism that reduces NC cell and in turn cluster stiffness to allow the onset of CCM in vivo.
Substrate stiffening promotes microtubule deacetylation
Next, we asked whether mesoderm stiffening, which is known to trigger NC migration4, mediates the decrease of NC stiffness by fine-tuning microtubule acetylation. To test this, we first softened the mesoderm by using a method relying on the targeted injection of an active form of myosin phosphatase-1 (ca-Mypt1)4,26 (Fig. 4a, Extended Data Fig. 7 and Methods). Targeted injection of ca-Mypt1 was sufficient to decrease mesoderm stiffness, as we have previously shown4 and to inhibit the decrease in NC stiffness, by maintaining similar levels to those observed in wild-type non-migratory embryos (Fig. 4b). Then, to corroborate whether microtubule deacetylation also depends on mesoderm stiffening we used a controlled ex vivo environment that mimics the stiffness cells within NC clusters experience at non-migratory and migratory stages4 (Methods and Extended Data Fig. 7). In agreement with our in vivo observations (Fig. 2b,c), cells within NC clusters plated on soft substrates displayed high levels of microtubule acetylation but these levels were drastically reduced in cells from clusters plated on stiff surfaces (Fig. 4c,d). Moreover, from our model we can extract that modifying cell stiffness should feedback into the interaction of cells with their substrate via force generation, which is required for cell movement and comparable to experimental cell traction force (Supplementary Note). As a consequence, our traction force microscopy (TFM) analyses showed that microtubule acetylation affect the traction of NC clusters ex vivo (Extended Data Fig. 8). Notably, modifying microtubule acetylation in vivo did not alter mesoderm stiffness (Extended Data Fig. 8).
Fig. 4: Mesoderm stiffening control microtubule deacetylation via Piezo1-mediated mechanosensing.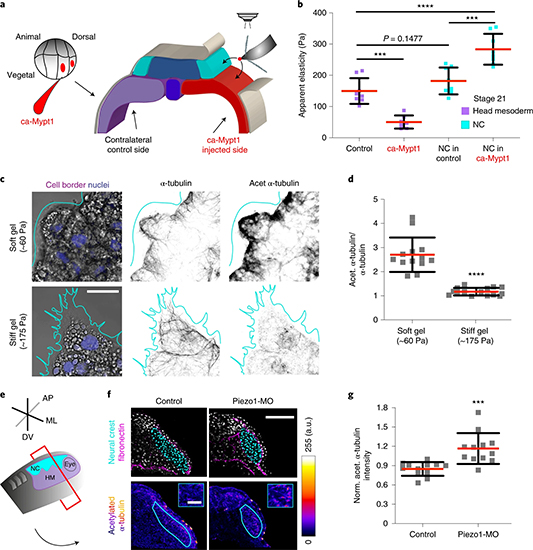
a, Schematic showing the regions measured by AFM, black arrows indicate the recorded region. b, Spread of data for each condition; red lines represent mean and whiskers s.d. (two-tailed t-test ****P < 0.0001, ***P < 0.0006, CI = 95%, ncontrol mesoderm = 8, nca-Mypt1 mesoderm = 7, nmigratory NC in control = 8, nmigratory NC in ca-Mypt1 = 8 embryos; 64 indentations per embryo). c, Immunofluorescence analysis showing acetylated α-Tubulin and α-Tubulin signal in NC platted on soft or stiff hydrogels (nuclei in magenta and NC border in cyan) (scale bar, 20 μm). d, Normalized fluorescence intensity ratio of acetylated α-Tubulin versus α-Tubulin; red lines represent mean and whiskers s.d. (two-tailed t-test, ****P < 0.0001, nsoft = 13 clusters; nstiff = 15 clusters). e–g, Piezo1 regulates microtubule acetylation in vivo. e, Schematic showing the plane of sectioning (HM, head mesoderm; ML, mediolateral; AP, anteroposterior; DV, dorso-ventral). f, Upper panel, confocal projections of transverse cryosections showing highlighted NC nuclei (cyan) and fibronectin (magenta); lower panel, colour-code image of the acetylated α-Tubulin channel (scale bar, 100 μm); upper right inset emphasizes the signal differences between both treatments in the NC (scale bar, 50 μm). g, Normalized acetylated (norm. acet.) α-Tubulin fluorescence intensity, spread of data is shown; red lines represent mean and whiskers s.d. (two-tailed t-test ***P = 0.004, CI = 95%, nControl = 12, nPiezo1-MO = 12 embryos). c and f are representative confocal projections from three independent experiments.
Piezo1 mechanosensing mediates microtubule deacetylation and CCM
We next explored the molecular mechanism by which NC sense and translate mesoderm stiffening into deacetylation. To shed light on this, we inhibited membrane mechanosensing by performing incubations with GsMTx4, an inhibitor of stretch activated channels (SACs)27. GsMTx4 incubation led to high levels of acetylation when comparing treated and control NC clusters (Extended Data Fig. 9). But as GsMTx4 inhibits several SACs, we next searched for specific SACs that could mediate this effect in the NC. RNA-sequencing (RNA-seq) libraries from isolated migratory NC (Methods) revealed that the stretch activated channel Piezo1—a well-established mechanosensor28,29—is expressed by NC cells (Supplementary Table 1). Thus, we tested the role of Piezo1 on microtubule acetylation by using a validated morpholino designed to knockdown Xenopus Piezo1 (Piezo1-MO)30,31. Piezo1 knockdown in the NC led to increased microtubule acetylation levels both ex vivo (Extended Data Fig. 9) and in vivo (Fig. 4e–g), revealing a role for Piezo1 in mediating microtubule acetylation in native contexts.
In addition to these effects in microtubule acetylation, both GsMTx4 incubation and the targeted knockdown of Piezo1 in NC drastically impaired NC CCM in vivo (Fig. 5a–c,e,f). Furthermore, our ex vivo analysis of Rg2 index revealed that the migratory ability of Piezo1 knockdown cell and clusters were reduced when compared to the control (Extended Data Fig. 10 and Supplementary Video 3). Since Piezo1 controls several cellular processes32 one possibility is that the observed effects on cell migration may be due to off-target effects. To address this, we performed an epistatic experiment in which Piezo1-MO was injected into hypoacetylated NC (Piezo1-MO + HypoAcet). This co-injection was sufficient to rescue the effect of Piezo1 knockdown in NC migration in vivo and ex vivo, confirming the specificity of our results (Fig. 5d–f, Extended Data Fig. 10 and Supplementary Video 3). Next, to confirm that the defects in NC microtubule acetylation and CCM observed on Piezo1 knockdown are related to cell stiffness we measured the impact of Piezo1-MO in NC stiffness by using iAFM. Our measurements revealed that Piezo1-MO injection in the NC was sufficient to cell-autonomously abolish the decrease of NC stiffness that we observed at the onset of CCM in wild-type embryos and that hypoacetylation was also sufficient to rescue this effect (Fig. 5g,h). These results indicate that Piezo1 is required to fine-tune NC mechanics in response to mesoderm stiffening by allowing microtubule deacetylation and in turn CCM in vivo.
Fig. 5: Piezo1 fine-tunes NC mechanics via microtubule acetylation to allow the onset of CCM in vivo.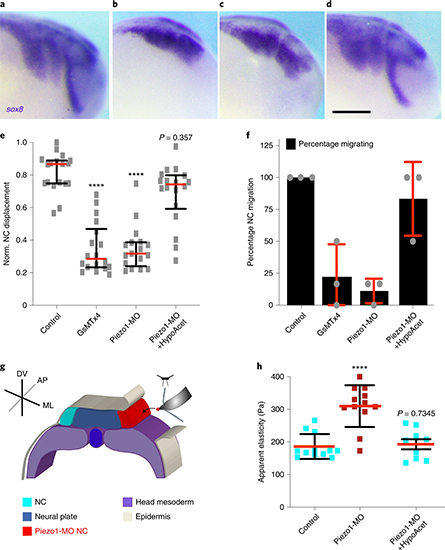
a–f, In situ hybridization analysis of NC CCM in vivo. a–d, Lateral views of sox8 hybridized embryos (scale bar 200 μm): treatments; control (a), GsMTx4 (b), Piezo1-MO (c) and Piezo1-MO+HypoAcet (d). e, Normalized (norm.) displacement of NC along the dorso-ventral axis; red lines show median and whiskers represent interquartile ranges (Kruskal–Wallis test P < 0.0001, CI = 95%, ncontrol = 17, nGSMx4 = 18, ncPiezo1-MO = 17, nrescue = 16 embryos). f, Percentage of embryos displaying NC migration histograms represent media, error bars are s.d. Panels are representative examples from at least three independent experiments. g,h, iAFM measurements. g, Diagram showing iAFM measurements in control or Piezo1-MO treated NC (ML, mediolateral; AP, anteroposterior; DV, dorso-ventral). h, Spread of data for each condition is shown; red lines represent mean and whiskers s.d. (two-tailed t-test, ****P < 0.0001, CI = 95%, nControl NC = 12, nPiezo1-MO NC = 12 embryos, nPiezo1-MO+HypoAcet NC = 9 embryos).
Soft clusters migrate in compliant native substrates
Considering our results, our next goal was to dissect whether NC require a threshold value of substrate stiffness to migrate or whether lowering their elastic properties to match softer substrates would be sufficient to allow CCM. Since we found that microtubule deacetylation reduces NC stiffness to allow CCM in vivo, we next tested whether hypoacetylation is sufficient to allow CCM in compliant substrates, in which wild-type cells do not normally migrate4. As an initial approach, we simulated migration of cells within clusters at control and hypoacetylated stiffness values when exposed to a soft substrate that resembles the stiffness of a non-migratory mesoderm (roughly 50 Pa). Our simulations confirmed that control clusters struggle to migrate on soft substrates as reflected by the shorter length of their individual tracks and flat Rg2 index (Fig. 6a,c). Unlike those, individual cell tracks and Rg2 values of hypoacetylated NC clusters elicited a migratory behaviour on these soft substrates (Fig. 6b,c), suggesting that hypoacetylated cells could migrate in compliant surfaces. To confirm these results in vivo, the migration of wild-type or hypoacetylated NC was assessed after grafting into wild-type embryos or into embryos with softened mesoderm. As expected, wild-type control NC clusters grafted into wild-type hosts collectively migrated, but their migration was inhibited when grafted into softened embryos (Fig. 6d,e,g,h). Hypoacetylated NC effectively migrated by following stereotypical paths when grafted into these softened native environments (Fig. 6f–h). As a consequence, with these observations we found a strong correlation between the Esub/Ei calculated from our in vivo AFM data and the net distance that NC migrated in embryos under all the treatments we analysed (Fig. 6i). Thus, on the basis of these results it is tempting to speculate that a threshold value of substrate stiffness may not be as essential for CCM as it is achieving an optimal Esub/Ei ratio. Yet, our results also show that reducing cell and in turn cluster stiffness requires substrate stiffening (Fig. 4b). Thus, we propose that a ‘stiff substrate’ is not only a permissive platform that supports CCM, but that substrate stiffening play a major informative role in the mechano-molecular feedback loop by which cells within clusters attain an optimal cell-to-substrate stiffness ratio to migrate in mechanically dynamic and often compliant native substrates.
Fig. 6: Soft cell clusters migrate in compliant native environments.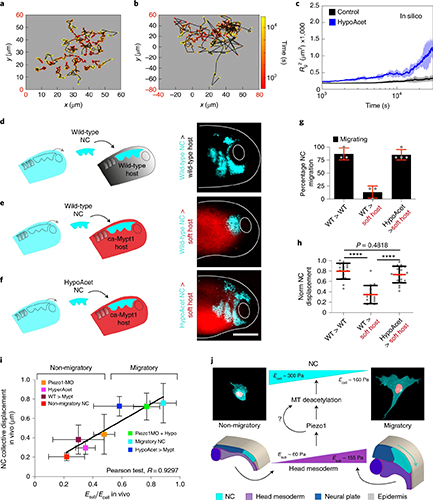
a–c, In silico results for the predicted behaviour of controls and hypoacetylated cells and clusters plated on soft substrates. a,b, Cell tracks depicting individual cell trajectories (note the differences in the x and y axes scales when comparing, highlighted in red): control (a) and HypoAcet (b). c, In silico Rg2 calculations showing collective cell behaviours under the indicated conditions: solid lines represent mean and shade the s.d. d–h, Graft experiments. d, Wild-type premigratory (stage 17.5) NC grafted into wild-type host embryos. e, Wild-type premigratory NC grafted into softened host embryos. f, Hypoacetylated premigratory NC grafted into softened hosts (scale bar, 200 μm). g, Percentage of embryos displaying NC migration; histograms represent mean and error bars s.d. h, Normalized displacement of NC along the dorso-ventral axis; red lines represent mean and whiskers s.d. (two-way ANOVA P < 0.0001; two-tailed t-test, ****P < 0.0001, CI = 95. In g and h, nwt into wt = 16, nwt into softened = 15, nhypoacetylated into softened = 20 embryos). Scale bar, 200 μm. d–f are representative examples from at least three independent experiments. i, Summary of the strong correlation we found between the cell-to-substrate stiffness ratio obtained from all our in vivo AFM measurements and the net displacement of NC along the embryo in under the same treatments (Pearson test, R = 0.9297). j, Schematic providing a mechanistic overview on how the mechano-molecular feedback loop that underly onset of CCM in vivo operates (detailed in Outlook).
Collectively, our work reveals that substrate stiffening leads to a reduction in the stiffness of cells within migrating clusters and that this unsuspected mechanical cellular response is essential for CCM in vivo, as it allow clusters to achieve an optimal cell-to-substrate stiffness ratio in response to substrate stiffening. Mechanistically, we found that this substrate mediated reduction on NC stiffness is achieved via Piezo1 regulation of microtubule deacetylation (Fig. 6j). Thus, our data have the potential to affect our approach to several physiological and pathological processes that require CCM, such as embryogenesis, tissue repair and cancer invasion.
Outlook
According to in vitro results, cells within clusters resting on soft substrates are softer than when exposed to a stiffer environment7,33,34. Despite this, recent evidence argues that cell and substrate stiffness are independent when cells are plated onto compliant surfaces8,9, with particular implications for cancer11. Our in vivo work reinforces this idea as we observed that NC cells and, in turn, cluster stiffness are higher than the stiffness recorded in the head mesoderm (its substrate) and that mesoderm stiffening induces NC softening, offering an alternative or complementary scenario to the current view on how cell stiffness is influenced by substrate stiffening. These results are also relevant for our understanding of cancer biology as in some malignant contexts cancer cells became softer.
Furthermore, our data reveal that microtubule acetylation affect the stiffness of individual NC cells to control cluster mechanics and migration. Still, whether microtubule acetylation affect cell stiffness in a direct or indirect manner remains elusive. On the basis of the current knowledge in the field we foresee at least three scenarios: (1) that microtubule acetylation could directly affect cell mechanics, as acetylated microtubules are more stable and stiffer, unlike deacetylated microtubules20,36; (2) that microtubule acetylation operates by controlling the activity of GEF-H1 and with that actomyosin contractility, as it has been recently proposed in vitro22,37 and (3) a combination of scenarios 1 and 2 may emerge owing the complexity and dynamic nature of the in vivo migratory environment. Regardless, whether our observations are due to a direct or indirect effect, our data position microtubule deacetylation as a key player of the mechano-molecular feedback loop by which NC cells mediate the reduction in cluster stiffness at the onset of CCM in vivo.
On the other hand, our data on E-cadherin confirmed that the elastic properties of NC cells and in turn clusters are primarily, but eventually not exclusively, controlled by microtubule acetylation. Still switching E- to N-cadherin is a hallmark of NC epithelial-to-mesenchymal transition38, and we have previously shown that substrate stiffening is involved in this cadherin switch4. Thus, our current study invites to further dissect the hierarchical or relative contribution of microtubule acetylation and cadherin switches to the onset of CCM in NC and eventually in other cellular contexts.
Moreover, we reveal that Piezo1-mediated mechanosensing controls NC microtubule deacetylation, cell mechanics and CCM in vivo. Still, the molecular signalling by which Piezo1 controls microtubule acetylation and whether this mechanosensitive pathway operates in other biological contexts remains to be determined. Another relevant question is how force that is sensed at the substrate is transmitted across the 3D NC cluster. This topic is under intense research and several studies point to the role of cell–cell junctions as mediators of mechanical force across migrating clusters39,40,41. Indeed, N-cadherin can transmit traction force37,39 and the NC requires N-cadherin to collectively migrate42. Thus, an interesting possibility is that N-cadherin may transduce force from the mesoderm across the NC cluster during CCM.
We also showed that inducing hypoacetylation was sufficient to allow CCM in soft native substrates. This result confirmed that lowering cell stiffness is sufficient for cells to migrate regardless of the mechanical nature of their environment. Further studying these observations can affect our understanding of processes such as cancer cell migration, as recent data indicate that these cells often migrate across soft viscoelastic native tissues8,43, such as the ones reported here. In addition, we can expect that when experiencing a soft non-migratory surface, Piezo1 activity may be low in the NC. This lack of active mechanosensing could eventually explain why cells do not adjust their stiffness to the substrate in these compliant contexts, as they do in stiff substrates, further confirming the instructive nature of substrate stiffening.
Since microtubule acetylation, cell-substrate mechanics and CCM are essential for a variety of biological processes such as embryo development, tissue repair and cancer, we predict that our observations will be of general interest across the biological and physical sciences. Broadly, our data contribute to the growing body of evidence arguing that mechano-molecular feedback loops, such as the one described here, coordinate morphogenesis in physiology and disease.
Methods
All animal experiments were approved by Ethics Committee and the Animal Welfare Body of the Instituto Gulbenkian de Ciencia (IGC) and by the Direção Geral de Alimentação e Veterinária. All institutional, project and personal licences are in place.
X. laevis manipulation to obtain embryos
Adult animals were maintained at 18 °C in a temperature-controlled environment and embryos were obtained by in vitro fertilization38. Briefly, induction of ovulation was performed in adult females by injecting chorionic gonadotrophin (Intervet); after ovulation, oocytes were in vitro fertilized by mixing with a sperm solution. On successful fertilization, embryos were staged by following developmental tables47 and maintained between 14 and 18 °C.
In situ hybridization and riboprobes and messenger RNA in vitro transcriptions
In situ hybridizations were performed by following a step by step protocol48. In brief, an antisense template DNA for the NC marker sox8 (ref. 49) was generated by linearizing with EcoRI (New England Biolabs). Then a digoxigenin-labelled probe against sox8 (ref. 49) was transcribed in vitro by using this linearized plasmid as a template and by following the instructions of a commercial in vitro Transcription System (Promega P1420). Templates for wild-type α-Tubulin-GFP (Addgene 56450); hyperacetylated α-Tubulin (K40Q-eGFP, Addgene 105302) and hypoacetylated α-Tubulin (K40R-eGFP, Addgene 105302) were generated by PCR, using the following primers: T7-promoter containing forward primer 5′-ggaggtctatataagcagagtaatacgactcactataggctggtttagtgaaccgtc-3′ and a reverse primer 5′-tacgcgttaagatacattgatgagtttggacaaaccacaacta-3′. Transcription was performed with a T7 transcription kit (mMESSAGE mMACHINE, AM1334 for T7). Templates for all other mRNA in vitro transcriptions (membrane GFP (mGFP), nuclear RFP (nRFP), CA-MYPT1) were generated by digesting with NotI (New England Biolabs) and transcribed with an Sp6 transcription kit by following the fabricant instructions (mMESSAGE mMACHINE SP6, Thermo-Fisher AM1340 for Sp6).
Morpholino and mRNA injections
Fertilized eggs were dejellied for 5 min with a solution containing 0.5 g of cysteine (Sigma) and 500 μl of 5 N NaOH, dissolved in 25 ml of ddH2O. All injections were performed with pulled glass needles that were calibrated to inject 10 nl on a gas pulse of 20 psi for 0.2 s. Depending on the type of experiment, different stages and/or blastomeres were injected (specified in each figure). For cell labelling, 250 pg of mGFP and or nRFP were injected per blastomere. For targeted NC injections, embryos at eight-cell stage were injected near the division point of a dorsal and a ventral blastomeres of the animal pole, with: 17 ng of a morpholino designed against Xenopus Piezo1 (Piezo1-MO 5′-CACAGAGGACTTGCAGTTCCATCCC-3′); or 22 ng of Xenopus E-cadherin (Ecad-MO 5′-AACCAGGGCCTCTTCAACCCCATTG-3′). These morpholinos were synthesized by GeneTools and previously validated in X. laevis Piezo1-MO (ref. 30) and Ecad-MO50. The same strategy was used to inject wild-type α-Tubulin-GFP; hyperacetylated α-Tubulin and hypoacetylated α-Tubulin24. For targeted mesoderm injections, 1 ng of CA-MYPT4 or mGFP plasmids were injected into dorso-vegetal blastomeres at the 16-cell stage.
GsMTx4 incubations in vivo and ex vivo
For GsMTx4 incubations, embryos were incubated in a solution containing 100 μM of GsMTx4 (08GSM001, Smartox TebuBio) dissolved in dimethyl sulfoxide (Thermo-Fisher). Embryo incubations were performed from stage 13 (non-migratory) to stage 22 (migratory) and immediately processed for in situ hybridization. For ex vivo incubations, NC explants were taken from embryos at stage 15 (non-migratory) (as described below). Then NC clusters were let to attach and spread in a fibronectin dish for 30 min, incubated with 5 μM GsMTx4 for roughly 3 h and immediately processed for immunofluorescence.
Ex vivo NC culture, spreading assay and graft experiments
NC dissection
Devitellinized embryos were placed in a dish containing plasticine and filled with embryo media Marc’s Modified Ringer (containing 0.2 mM CaCl2·2H2O, 10 mM NaCl, 0.1 mM MgCl2·6H2O, 0.2 mM KCl, 0.5 mM HEPES with pH 7.1–7.2). Embryos were immobilized by gently holding them with plasticine and the epidermis was removed with a hair-knife tool. The NC was anatomically identified and removed with the hair knife. Explants were transferred to a dish containing Danilchik’s medium (1 mM MgSO4(7H2O), 5 mM Na2CO3, 4.5 mM KGluconate, 53 mM NaCl, 32 mM NaGluconate, 0.1% BSA and 1 mM CaCl2; pH was adjusted to 8.3 with Bicine).
Dispersion assay
To analyse the migration of NC ex vivo we used a collective spreading or dispersion assay. To do this, dissected NC clusters were platted into a fibronectin-coated glass bottom dish (μ-Dish, 35 mm diameter, Ibidi). NC were allowed to attach, and their migration and dispersion was recorded by time-lapse. These assays have been widely used as a readout of the ability of cells within a NC cluster to migrate, mostly because in the absence of constrains or biasing cues wild-type clusters radially spread. This allows for the analysis and comparison of several motility parameters among treatments48.
Graft experiments NC explants were removed as described in NC dissection. Then the donor NC was carefully placed into host embryo by using a hair knife. To hold the grafted NC in place, a piece of cover-glass (0.1 mm thick) was positioned over the grafted NC. After roughly 1 h, the coverslip was removed, and the embryos were imaged when reaching the stages required for each experiment.
Polyacrylamide (PAA) hydrogels preparation
Soft gel mixes contained: 550 µl of 7.6 mM hydrochloric acid (HCL), 330.5 µl of double-distilled water (ddH2O), 0.5 µl N,N,N′,N′-tetramethylethylenediamine (TEMED) (Sigma), 20 µl 2% bis-acrylamide (BioRad), 70 µl of 40% acrylamide (BioRad), 20 µl 0.1 M NHS (N-hydroxysuccinimide, Sigma-Aldrich), 4 µl of 200 nm diameter beads resuspended at 0.2 µM (Invitrogen) and 5 µl of 10% ammonium persulfate (GE HealthCare) (prepared just before use). Stiff gels mixes contained: 550 µl of 7.6 mM HCL, 258.5 µl of ddH2O, 0.5 µl of TEMED (Sigma), 25 µl 2% bis-acrylamide (BioRad), 137 µl of 40% acrylamide (BioRad), 20 µl of 0.1 M NHS (N-hydroxysuccinimide, Sigma-Aldrich), 4 µl of 200 nm diameter beads resuspended at 0.2 µM (Invitrogen) and 5 µl of 10% ammonium persulfate (GE HealthCare) (added just before use). A 12-μl drop of PAA mix was placed into the hydrophilic glass of a glass bottom dish (FD5040-100). The PAA mix was covered with a hydrophobic 13-mm diameter × 0.1 mm glass coverslips that were prepared fresh by coating them with PlusONE Repel-Silene ES (GE Healthcare) for 15 min at room temperature and dried with an air pistol. Polymerization proceeded for 45 min at room temperature in a humidifier chamber. The coverslip was carefully removed, and gels were washed three times for 2 min with 10 mM HEPES.
Gel functionalization
Fibronectin was covalently linked to the soft or stiff gels by immersion of the gels into a solution containing 0.2 M EDC ((1-ethyl-3-(3-dimethylaminopropyl)carbodiimide hydrochloride), Calbiochem), 0.1 M NHS (N-hydroxysuccinimide, Sigma-Aldrich), in 0.1 M MES buffer (in milliQ water, pH 5.0, 2-(N-morpholino)-ethane sulfonic acid, Sigma-Aldrich). After washing twice with PBS, gels were incubated with 0.1 mg ml−1 of fibronectin for 1 h 45 min at room temperature. Fibronectin was washed with PBS and the crosslinking-reaction was quenched by incubating the gels for 15 min with 0.32% ethanolamine (Sigma-Aldrich) in PBS. Fluorescent Fibronectin (Cytoskeleton, Inc., HiLyte 488) was used to determine gel functionalization (Extended Data Fig. 7).
TFM
For TFM51, gels were prepared and functionalized as described above, but the acrylamide mix was adjusted to yield a stiffness of roughly 400 Pa, as estimated by AFM. TFM gel mix: 550 µl of 7.6 mM HCL, 315.5 µl of double-distilled water (ddH2O), 0.5 µl of TEMED (Sigma), 30 µl of 2% bis-acrylamide (BioRad), 75 µl of 40% acrylamide (BioRad), 4 µl of 200 nm diameter beads resuspended at 0.2 µM (crimson beads, Invitrogen), 20 µl of 0.1 M NHS (N-hydroxysuccinimide, Sigma-Aldrich) and 5 µl of 10% ammonium persulfate (GE HealthCare). Once plated in these gels, cells were imaged for 25 min (with a frame rate of 2 min). Then, cells were removed by gently adding TrypLE (Gibco) for 10 min, and decellularized gels were imaged at the same rate for 25 min. Traction was then calculated by using a combination of built-in ImageJ and MATLAB based plugins and software52.
Crysectioning
Embryos were fixed in a solution containing 4% formaldehyde, 0.25% Glutaraldehyde and 0.1% Tween-20, all dissolved in 1× PHEM buffer (60 mM PIPES, 25 mM HEPES, 10 mM EGTA and 4 mM MgSO4·7H2O). Fixation was overnight at 4 °C and then dehydrated in 100% methanol for at least 2 h at room temperature. Then the samples were rehydrated by using a battery of methanol/PBS 1× 75–50–25% washes, 10 min for each solution and finally incubated with PBS 1×. The embryos were then incubated twice for 15 min in 0.25% NaBH4/PBS w/v and washed with PBS1x. Then, embryos were embedded and oriented in a gelatine solution. Gelatine blocks were frozen at −80 °C in precooled isopentane. Samples were then sectioned in 20-μm slices using a cryostat (CM-3050S, Leica) and collected in SuperFrozen Slides (VWR International). The slides were dried overnight at room temperature and processed for immunostaining, as described below.
Immunostaining in glass, hydrogels and cryosections
Fibronectin (mAb 4H2 anti-FN, DSHB)53 and acetylated α-Tubulin (T6793, Sigma-Aldrich)54 or E-cadherin (5D8, DSHB)4,38,50 were used for immunostaining in histological sections. To remove the gelatine after cryosectioning the samples were washed twice with PBS for 15 min at 37° and blocked for 2 h with 10% normal goat serum (NGS). Antibodies were diluted at 1:500 (anti-acet-α-Tubulin) and 1:1,000 (anti-fibronectin) in 10% NGS, incubated overnight at 4 °C and washed three times with 0.1% PBS-T (PBS, 0.1% Tween-20). Alexa-fluor (Thermo-Fisher) secondary antibodies were diluted 1:350 in 10% NGS with 1/400 DAPI (for nuclear staining). The samples were incubated in this mix overnight at 4 °C and washed three times with 0.1% PBS-T.
For acetylated α-Tubulin and α-Tubulin detection ex vivo, explants were fixed in Buffer PHEM 1× containing (4% formaldehyde; 0.25% glutaraldehyde; 0.1% Tween-20) for 10 min at room temperature, then subsequently treated with 0.25% NaBH4 in PBS w/v for 10 min and washed with PBS 1×; permeabilization was done with PBS 0.1% Triton X-100 for 7 min at room temperature. Then the explants were blocked with 10% NGS for 30 min. The primary antibody anti-acetylated α-Tubulin and anti-α-Tubulin54 were diluted at 1:500 and 1:1,000, respectively, in 10% NGS and incubated overnight at 4 °C. Explants were washed three times with PBS 0.1% Tween, incubated overnight at 4 °C with secondary antibody and diluted at 1:350 in 10% NGS. DAPI was diluted at 1:1,000 and mixed with the secondary antibodies.
Immunostaining on hydrogels proceeded as described above but the washes with agitation were replaced by rinses that were carefully performed (seven rinses each time). MOWIOL (EMD Millipore) was used as the mounting medium. Images were acquired as described below and fluorescence intensity was analysed using the measurement tool from ImageJ.
Microscopy and time-lapse live imaging
Time-lapse imaging Images for dispersion assays were acquired every 5 min at 18 °C using an upright microscope Zeiss Imager Z2/Apotome.2 equipped with a motorized stage and a camera (Hamamatsu Orca flash 4.0 v.2). A ×10 W objective (N-Achroplan ×10/0.3 M27 (FWD = 2.6 mm), Zeiss) was used.
In situ hybridization imaging and grafts
All images were captured at room temperature in agarose dishes containing PBS, using a dissecting microscope (MZ FL III, Leica) equipped with a camera (DFL420, Leica) and imaging software (IM50, Leica). Magnification was ×3.2.
Immunofluorescence imaging
Most of the images were acquired at room temperature using a Zeiss LSM980 system, equipped with two PMT and one GaAsPand, a ×40 W objective (C-Apochromat ×40/1.1 W Corr M27, Zeiss); same microscope, but a C-Apochromat ×25/1.515 oil immersion objective was used for the TFM experiments. Camera, filter wheels and shutters were controlled by Zeiss’s ZEN Blue v.3.0. Images in Extended Data Fig. 3 and Extended Data Fig. 6 were acquired with a Leica Stellaris 5 confocal system by using a ×63/1.4 oil immersion objective with ×1 or ×0.75 optical zoom, respectively. Images in Extended Data Fig. 7b were acquired in a Leica Thunder by using a HC PL APO ×20/0.80 PH2 objective. Camera, filter wheels and shutters were controlled by built-in Leica softwares.
iAFM measurements
All AFM measurements were by using a FLEX-ANA (Nanosurf) automated AFM device, fitted with a x–y motorized stage and an automated software for experimental setup and analysis (ANA Software, Nanosurf).
In vivo AFM measurements
In our previous study we used cantilevers coated with a roughly 40 μm bead for in vivo AFM measurements of the mesoderm as a tissue4. Here, we used cantilevers coated with roughly 10 μm diameter colloidal spheres (CP-qp-SCONT-BSG-B-5, sQube). This tip size (10 μm) secured that our indentations capture the mechanical properties of the NC or the mesoderm and not the convolution of both. Cantilevers were mounted on the AFM device and their spring constants were calculated using the thermal noise method55. Only cantilevers with spring constants between 0.01 and 0.03 N m−1 were selected. Before use, we controlled that these cantilevers still capture tissue level stiffness (Extended Data Fig. 1; explained below in the section AFM tissue deformation control). Then, embryos were mounted in a plasticine dish and indentations were performed as described in Extended Data Fig. 1. The following modulation parameters were used: maximum indentation force, 10 nN; approach speed, 5 μm s−1; retraction speed was 55 μm s−1 and sample rate, 2,400 Hz.
For single cell AFM measurements in this experiment, the AFM head was set in a Leica Thunder inverted fluorescent microscope. This allowed to image cells with a HC PL APO ×20/0.80 PH2 objective while acquiring AFM data. A smaller cantilever coated with a roughly 2-μm diameter colloidal tip was used (CP-qp-SCONT-Au-A-5, sQube). After calculating their spring constant, 25 indentations were performed per cell in a region of interest of 10 × 10 μm2. The following modulation parameters were used: maximum indentation force, 2 nN; approach speed, 5 μm s−1; retraction speed, 55 μm s−1 and sample rate, 2,400 Hz.
AFM tissue deformation control
To control that after reducing the cantilever bead size from 40 to 10 μm, we were still capturing the elastic properties of the NC as a collective, so we recorded the displacement of nRFP-labelled cell nuclei while applying a typical in vivo indentation. The same modulation parameters used for in vivo AFM measurements. Nuclei displacement on indentation was estimated with a built-in iterative particle image velocity ImageJ plugin and the same plugin was used to plot displacement maps.
Data analysis and image treatment
AFM data analysis
In both cases, force–distance curves were fitted to a Hertz model for a spherical indenter, with applied force F, Young’s modulus E, Poisson’s ratio v, indenter radius r, indentation depth δ and apparent elastic moduli K = E/(1 – ν2), referred as ‘stiffness’ in the text and as ‘apparent elasticity (Pa)’ in the y axis of each chart. Force–distance curves were selected on the basis of their shape (example in Extended Data Fig. 1b)56. Then the apparent elastic moduli from in vivo AFM indentations were extracted at maximum indentation depth by using the built-in ANA AFM analysis software. Next, a 1 μm indentation depth was used to extract apparent elasticity from single cell indentations, as previously defined57. For single cell measurements, AtomicJ was used to identify the contact point and dissect 1 μm indentation depth. Then the median of each embryo or cell was calculated and processed for further statistical analyses.
In vivo analysis of NC migration For in situ hybridization and grafted embryos, the length of the NC was obtained and normalized against the total dorso-ventral length of the embryo. Lengths were obtained using the built-in measurement tool from ImageJ and further analysed as described in Statistical analysis.
Ex vivo analysis of NC spreading To extract the collective and individual dynamics from spreading NC clusters we used the squared radius of gyration (Rg2), a suitable parameter to assess the trajectories and dynamics of migrating cells and clusters16,17,18. Rg2 is an experimentally accessible output that allows for comparison of both simulations and ex vivo dispersion/spreading assays, and is defined as: where N is the number of cells, is the position of cell i at time t and is the centre of mass of all cell positions. Rg2 is the mean squared distance from the centre of the cell cluster and measures the average space that cells explore17. We also extracted the effectiveness of cell migration by quantifying the time dependence of Rg2. By fitting the time dependence of radius of gyration squared to a power law function , we extracted the power exponent γ. An increase in radius of gyration squared with a power law exponent γ > 1 is indicative of efficient cell spreading compared to γ = 1, which is indicative of a random walk18 (inset in Fig. 1e). To extract the trajectory of cells from ex vivo experiments we used an ImageJ-based manual tracking plugin. Then these tracks were used to calculate and plot Rg2 results by using custom made MATLAB codes. Data were further analysed as described in the Statistical analysis section.
Image treatment
The z-stacks, maximum projections and time-lapse movies were created using ImageJ software. Adjustment of display map levels, re-sizing and addition of scale bars and pseudo colour were applied with ImageJ and/or Adobe Photoshop. In Fig. 4f the background was pseudo coloured in Adobe Illustrator.
RNA-seq experiments and analyses
The quality of the extracted RNA was assessed using HS RNA Screen Tape Analysis (Agilent Technologies), libraries were generated by SMART-Seq2 and a Fragment Analyzer (AATI) was used for their quantification and to determine their quality. Libraries were then sequenced in a NextSeq500 Sequencer (Illumina) using a 75 SE high-throughput kit. Sequence information was extracted in FastQ format using the bcl2fastq v.2.19.1.403 (Illumina). Informatic analysis was carried out by the IGC Bioinformatics Unit by mapping the obtained sequences against the reference genome of X. laevis, version XENLA_9.2_Xenbase.gtf (v.9.2).
Statistical analysis
No software was used for sample size determination. No randomization of the experiments was performed as, because of the nature of our experiments, only viable embryos and cell clusters were considered for analysis. Moreover, mis-injection was not included for in situ hybridization analysis meaning that the authors were not blinded to allocation while performing and/or analysing the experiments. For any of the mentioned cases, after selections, all parameters were measured at random.
Each experiment was repeated at least three times. Every set of data was tested for normality test using the, d’Agostino–Pearson and/or Shapiro–Wilk test in Prism7 (GraphPad). For paired comparisons, significances were calculated Prism7 with a Student’s t-test (two-tailed, unequal variances) when the distributions proved to be normal. If a data set did not pass the normality tests, the significances were calculated with Mann–Whitney (two-tailed, unequal variances). For multiple comparison of data with normal distribution unpaired one-way analysis of variance (ANOVA) with Bonferroni test correction was performed, while non-normal distribution data sets were analysed with Kruskal–Wallis corrected with Dunn’s test. Individual comparisons were calculated only when multiple comparisons showed P > 0.05 and significances in these cases were calculated in Prism7 as described for paired comparisons. The confidence interval in all experiments was 95% and as a detailed description of statistical parameters it is included in all figure captions.
Linking Friction Scales from Nano to Macro via Avalanches
by Tyler Salners, John F. Curry, Adam R. Hinkle, Tomas F. Babuska, Nicolas Argibay, Frank W. DelRio, Michael Chandross & Karin Dahmen
Original Paper Open access Published: 20 June 2022 Volume 70, article number 82, (2022)
DOI https://doi.org/10.1007/s11249-022-01619-x
Abstract
Steady-state fluctuations in the friction force of molybdenum disulfide (MoS2), a prototypical lamellar solid, were analyzed experimentally for newton-scale forces and computationally via molecular dynamics simulations for nanonewton-scale forces. A mean field model links the statics and the dynamics of the friction behavior across these eight orders of magnitude in friction force and six orders of magnitude in friction force fluctuations (i.e., avalanches). Both the statistics and dynamics of the avalanches match model predictions, indicating that friction can be characterized as a series of avalanches with properties that are predictable over a wide range of scales.
Understanding the shear strength of lamellar solids like MoS2 and graphene, materials that are widely used for their exceptional lubricity (i.e., low shear strength), is important for many engineering applications where traditional fluid lubricants cannot be used. Commonly used in mechanisms that operate in inert environments, such as in hermetic enclosures or exposed to the vacuum of space, MoS2 films in the form of engineered coatings can undergo a transition to low friction coefficients (µ) during use, a phenomenon commonly referred to as “run-in.” This transition in friction behavior is accompanied by structural changes of the coating surface and the formation of a transfer film on the mating counterface, generating a self-mated contact. The first few cycles of sliding cause shear-induced reorientation of the constituent atoms, leading to the formation of large, basally oriented MoS2 sheets at the shearing interface parallel to the direction of sliding. These self-mated sulfur-terminated lamellae interact through weak van der Waals forces that easily shear and provide low steady-state friction coefficients (µ < 0.05). In cases where the MoS2 films are sufficiently pure, devoid of adsorbate contaminants, and basally oriented, superlubricity can be achieved, which is associated with friction coefficients µ < 0.01. Additionally, in this low friction regime, wear rates are also low, corresponding to the removal of as little as one molecular layer per sliding pass. When in the steady-state friction regime, shearing planes of highly ordered MoS2 can display persistent fluctuations in friction force (as shown in Fig. 1a and b) that have been attributed to stick–slip behavior. In this regime, atoms in adjacent lamella periodically become stuck in mutual local potential wells.
Fig. 1
a Friction force measured in a UHV tribometer. Vertical red lines mark the start and end of a single avalanche. S is the total drop in force, while T is the difference between start and stop times. b Friction forces from MD simulations show similar fluctuations. c The force-drop rate profile of the single experimental avalanche and the maximum force-drop rate Γmax. We use only experimental data from the steady-state regime, as shown in (d). Note in (b), the flat sections are not actually flat, but slightly curved downward, and thus the region between the red lines is one single avalanche
Here, we try to understand these low friction coefficients and wear rates from the statistics of fluctuations in the friction force that arise from underlying slip avalanches. An avalanche describes the cascading nature of failure events, experimentally observable as sharp drops in friction force. To understand the statistics of these avalanches, we model friction of MoS2 lamellae via the slipping of elastically coupled weak spots between material layers. These weak spots arise from the natural variations at the interface between the two sliding layers. Weak spots are regions that are most prone to slipping. Without thresholds to sliding, sliding would proceed smoothly in response to an applied external force. Heterogeneities at the interface, for example via local asperities, introduce a local threshold force to sliding, implying that the interface will remain stuck (or ‘pinned’) for small external forces. In response to a small force increase the interface slips in avalanches until it is pinned again by new asperities. Only for forces larger than a critical force, i.e., large enough to overcome all asperities, will the interface keep slipping. That critical force constitutes a critical point that separates the pinned regime from the sliding regime. If we drive the system with a soft loading spring the system self-organizes to operate near the critical force. In that case it responds with avalanches that are widely distributed in size with statistical distributions that are characterized by scaling exponents and scaling functions. These only depend on a few basic properties such as symmetries, dimensions, interaction ranges, etc., but not on the microscopic details of the system. Below we describe a simple microscopic model that captures the basic properties and makes predictions for these universal exponents and scaling functions that can then be compared to experiments.
The statistics of these friction force avalanches resemble those in a chaotic regime of friction described in, as well as sudden stress drops arising from internal friction during deformation of a wide range of solids across a broad range of length scales. The model suggests that this behavior is similar because the underlying mechanism in all cases is slip avalanche weak spots. Predictions from this model have been confirmed by recent experiments on internal friction during slow compression of bulk metallic glass specimens; in these materials, the weak spots are shear transformation zones (STZs) that predominantly slip in shear bands. Here, we show the statistics and dynamics of friction force avalanches measured in macroscale tribological experiments on sputter-deposited MoS2 thin films. The results are compared with data from nanoscale molecular dynamics (MD) simulations of shear between MoS2 lamella and predictions from a simple analytic model for the slip statistics during friction. The application of renormalization group methods to this simple analytic model enables the determination of aspects of the slip statistics and dynamics that are independent of microscopic details and therefore apply across a wide range of scales. We find good agreement between the experiments, simulations, and theoretical mean field theory (MFT) model.
In plastic deformation experiments, avalanches manifest as sudden drops in stress with statistics and dynamics that are described well by a simple MFT model of coupled weak spots undergoing slip. For friction, avalanches are observed as sudden drops in friction force with weak spots corresponding to local asperities at the interface. We define (sometimes referred to as the displacement field) as the interfacial offset since time of a weak spot at location. With an applied shearing force elastic forces from all other asperities and asperity pinning due to pinning forces the displacement field u(r,t) evolves in time according where η is an effective viscosity-like constant that sets the time scale of the slips and depends on the microscopic details of the system. Renormalization group calculations show that elastic interactions are sufficiently long range so that mean field theory, which approximates to be a constant, gives the correct scaling behavior in the physical dimension for slips along a shear band or frictional surface. Thus, we take the mean field limit by assuming each site couples to the average force of all other sites with where J characterizes how strongly the slipping weak spots interact, i.e., it really is an “elastic coupling coefficient.” To make contact with the physical system of interest, the change in local friction of a weak spot slipping at position r′ is defined as where represents the effective bulk loading stiffness. The friction force at any asperity can surpass a failure threshold value and slip to reduce its friction force to an arrest force The elastic interactions mediate the transfer of this released energy to other asperities and may trigger more slips in what we refer to as an avalanche. To mimic periodic noise during an experiment (e.g., from noise in the electrical circuits to measure forces or ringing of the force sensors), we overlay friction force traces produced by our model with a signal resembling the periodic noise.
Friction force fluctuations of MoS2 were measured in ultra-high vacuum (UHV; 1 × 10⁻⁹ torr) with a linear-reciprocating micro-tribometer at a 10 kHz acquisition rate (Fig. 1a and c). Force measurements were achieved via capacitance probes that measure the deflection of a custom dual-axis cantilever. On the end of the cantilever, a spherical probe (the counterface) is held fixed while the substrate is displaced parallel to the contact plane using a motorized stage. To establish a reference dataset for system noise, measurements were performed while the probe was out of contact and the stage was moving, and also while in contact with the stage stationary. More information regarding measurement uncertainty for force measurements can be found in the previous manuscripts. Experiments consisted of bidirectional sliding cycles at a normal force of 0.2 N and sliding speed of 1 mm/s. The 3.2-mm-diameter spherical probes, made of 440C stainless steel, were brought into sliding contact against 440C stainless steel polished coupons with an approximately 100-nm-thick pure MoS2 film deposited using an N2 spray impingement process. Each experiment consisted of 500 bidirectional cycles with a 2-mm-long stroke length. MoS2 coatings under shear typically show a run-in period where friction coefficients and wear rates evolve from high (µ > 0.1) to low (µ < 0.05) as the surface structure transitions from amorphous (or near-amorphous, depending on the deposition method) to ordered lamellae. To capture the physics of the steady-state regime, only the final 400 cycles of each experiment were used to extract magnitudes S, lengths T, and force-drop rate Γ of the friction force avalanches (Fig. 1d). The method to extract the avalanche sizes and durations from the data is as follows: zero crossings of the time derivative of the friction signal from positive to negative indicate when avalanches (i.e., force drops) start (t = tstart). At the following zero crossing from negative to positive the avalanche ends (t = tend), see Fig. 1a, b. The avalanche duration T is then defined as and the avalanche size S is equal to the amount by which the friction force dropped during the duration.
Friction force microscopy (FFM) measurements were performed on an Asylum MFP-3D atomic force microscope (AFM). MoS2-coated silicon substrates were mounted inside a humidity sensing cell on the sample stage. The humidity cell was attached to high-purity nitrogen (N2), such that the cell was maintained at a positive gas pressure and the relative humidity was close to that of the dry N2 source. Rectangular quartz-like cantilevers with SiO2 colloidal spheres were used to facilitate a well-defined contact geometry (Nanosensors CP-qp-SCONT-SiO probes with a sphere radius of R = 1 μm). The normal force calibration Cz and spring constant kz for a single probe were measured with the thermal fluctuation method; multiple Cz and kz values resulted in means and standard deviations of Cz = 1.48 ± 0.02 nN/V and kz = 14.6 ± 0.2 pN/nm. The lateral sensitivity S of the probe was assessed with the extended wedge method; multiple S values resulted in S = 12.8 ± 1.9. Following calibration, the probe was brought into contact with the MoS2 until a normal photodiode voltage Vz = 5.26 V was reached, translating to a normal force Fn = 7.8 nN. Repetitive, single-line scans were performed over a 1 μm distance at a frequency of 0.10 Hz. The lateral photodiode voltage during the trace Vxt and retrace Vxr were measured for each cycle. For each Vxt and Vxr pair, the friction loop width W = (Vxt − Vxr)/2 and offset Δ = (Vxt + Vxr)/2 were calculated to determine friction force Ff = Cz(S)(W) and coefficient of friction μ = (S)(W)/Vz. The Ff data from the steady-state μ region (final 400 cycles) were analyzed for avalanches.
MD simulations were performed using a reactive force field at a fixed shear velocity of 1 m/s. Two sets of simulations were performed: (1) one with MoS2 single crystals (15 square lamellae of MoS2 ≈ 9 nm on a side) to study commensurate (high friction) contact and (2) another with a single sheet rotated by 30° to study incommensurate (low friction) contact; details of the procedure are in. Friction forces from the simulations showed persistent fluctuations like those in the experiments (Fig. 1b). This enabled a determination of sizes, durations, and force-drop rates for the avalanches in the steady-state sliding regimes (after ≈ 100 ps and ≈ 35 ps of sliding for the commensurate and incommensurate cases, respectively).
The distribution P(S) of force-drop sizes S (Fig. 1a, b) scales as P(S) ~ S−τ, with universal (i.e., detail-independent) exponent τ. The prediction for τ depends on whether there is slip weakening (τ = 2) or not (τ = 3/2). This scaling holds for S within a power law scaling interval. The interval is bounded by an upper cutoff Smax that depends on experimental tuning parameters such as static and dynamic friction, machine stiffness, sample size, and driving rate. The region [Smin, Smax] is often referred to as the scaling regime, and the exponent τ is a critical exponent. To normalize scaling regimes with the macroscale experiments (for better comparison in a single figure), we scaled the size of MFT + noise simulations, commensurate MD simulations, incommensurate MD simulations and FFM experiments by = 2.75 × 10⁻⁶ N, 2275 N, 9000 N, and 1.75 × 10⁻³ N, respectively. Similarly, the durations were rescaled by = 1.4 × 10⁻⁵ s, 49 × 109 s, 87.5 × 10⁹ s, and 15 s, respectively, and the maximum force-drop rates by = 0.54, 4.64 × 10⁻⁸ N/s, 1.03 × 10⁻⁷ N/s, and 1.5 × 10⁻⁴ N/s, respectively. We extracted several universal scaling properties from this regime and compared them to the critical exponents and scaling functions predicted by the MFT model (Fig. 2).
Fig. 2
CCDFs of a size C(S) and b duration C(T). a, b are plotted with error bars calculated with a Bayesian technique with 95% confidence interval. Distributions of c fluctuation duration and d maximum force-drop rate vs. size. c, d are plotted with error bars from the standard error in a log binned average over size. The power law slopes predicted by the MFT model are plotted as black dashed lines. All units were normalized to the UHV experiments via three parameters (S0, T0, G0). The power laws are predictions for an infinite size system without noise or oscillations and overlapping blue data points in (b) stem from the discrete durations of AFM avalanches
To avoid ambiguities from varying histogram bin widths [31], we focus on power laws in the complement of the cumulative distribution function (CCDF), or one minus the integral of the probability distribution function (PDF) . The CCDF of avalanche size is the probability to have an avalanche of size S or larger, and scales as (Fig. 2a) with τ = 3/2 in the absence of slip weakening. Similarly, the CCDF of avalanche durations scales as , where T is the bin size (Fig. 2b) with α = 2. Avalanches are predicted to proceed in time such that the distribution of sizes scales as (Fig. 2c), where angle brackets denote the average.
The size-averaged maximum force-drop rate scales as (Fig. 2d). Historically, is the fractal dimension of the avalanches in the scaling regime, with σ describing the stress dependence of the largest avalanche in the scaling regime, z describing the scaling of the duration of avalanches with their diameter, and describing the scaling of the correlation length near criticality. Within error bars, all critical exponents obtained in experiments and simulations were consistent with the MFT simulations with emulated machine noise (see Supplemental Information, section c). To strengthen agreement, we compared to stricter predictions. Two of the most stringent validations are the time profiles of the average force-drop rate as a function of size and duration, or Γ-profiles. The Γ-profiles of N = 21 avalanches within a bin size centered at Si were averaged to obtain the size-averaged Γ-profile is the force-drop rate of the nth avalanche in the ith bin, where N is the number of avalanches in the bin Si. Time was offset such that all avalanches start at t = 0 (tj = t − t0, where t0 is the avalanche start time). The MFT model predicts that the averaged force-drop rates, drawn from different size bins in the scaling regime of C(S), have the same form as the universal scaling function
Figure 3a, c, and e (left column) show that plotting collapsed the profiles. The experimental noise caused deviation from the analytical prediction at small values of t/S0.5, however, when the experimentally determined periodic noise signal was included in the MFT model, the deviations were nearly the same (Fig. 3c and Supplemental Information). Matching the functional form of scaling functions was a more stringent test of the theory than merely matching power law exponents. As shown below, we find good agreement between experiments and theory for two different scaling functions and four exponents.
Fig. 3
Average force-drop rate profiles for a, b UHV macroscale experiments, c, d MFT calculations with added noise, and e, f MD simulations. Profiles computed from n avalanches found in a narrow size bin centered on Si are shown here in the left column insets for three bins in the scaling regime. Markers are shown with error bars calculated from the standard error in a log binned average over time. The size averaged profiles are predicted to collapse onto each other when rescaled by Si−1/2 (left column) and T−1 (right column). The results for experiments and simulations are consistent with MFT
In addition, C(T) followed a power law in the duration scaling regime (Fig. 2b). Averaging the force-drop rate time profiles of avalanches of about the same duration Ti gave the duration averaged Γ-profiles MFT predicts that avalanches in this regime obey the scaling law. Figure 3b, d, and f (right column) show that this prediction also matches experiments and MFT with added noise. The noise in the experiments again obscured the shapes, here for both small and large t/S0.5, and the MFT with noise showed similar deviations (Fig. 3d). In summary, we see strong agreement between the experiments and the model predictions for (1) the avalanche statistics, as seen in the scaling exponents of the statistical distributions, and (2) the avalanche dynamics, described by the average Γ-profiles that match the predicted critical scaling functions. This agreement between theory and experiments indicates that the fluctuations in the friction force indeed reflect the underlying critical point predicted by our simple MFT model. That is an important result because the model predicts that the statistics and dynamics of these fluctuations should be universal and independent of the microscopic details and the scale of the system. In other words, the MFT predicts that friction experiments on different materials should yield similar results, and that the results from the lab scales should be transferrable to systems on much larger or much smaller scales, as long as the symmetries, dimensions, and interaction ranges are the same.
System oscillations paired with periodic noise limited our analysis to regimes away from spikes in the power spectrum (see Supplemental Information). Although the scaling regime in the experiments spans less than two orders of magnitude, the agreement of our data with more than six measures including scaling collapses with universal scaling functions suggests that the data strongly support model predictions. It is the robust scale invariance predicted by the model that explains why both UHV experiments at mN scales and MD simulations at nN scales follow the same MFT scaling behavior. As predicted by MFT, both experiments and simulations showed a distinct scale invariance, reflecting an underlying critical point. The agreement in friction force fluctuations across six orders of magnitude suggests a common thread of slipping elastically coupled weak spots, as described by MFT.
The MFT model is not necessarily expected to describe experimental results for small event sizes and durations, as it is designed to describe only long wavelength and low frequency regimes where universal behavior is found. At small scales, microscopic details come into play and deviations between MFT and experiments are unsurprising. Such deviations can be seen in CCDFs (Fig. 2a, b) for small sizes and durations. Interestingly, in the small size and duration regime, experimental results more closely matched MD simulations with incommensurate contacts. While the registry of experimental systems is unknown, the two simulation cases (i.e., commensurate and incommensurate) represent bounding cases and suggest that macroscale steady-state low friction consists of primarily incommensurate shear (see Supplemental Information).
Moreover, there was no evidence for critical avalanches in the AFM FFM data (Fig. 2). However, this was again expected, considering the single-asperity nature of FFM: Avalanches in FFM involve slipping of the entire contact area, i.e., the entire tip slides on the surface until it is caught by a strong enough asperity. The model presented here predicts that power law scaling is only seen when the slipping size is much smaller than the size of the contact area. If that is not the case then the model predicts that finite size effects prevent the emergence of power law scaling, because the tip size sets a length scale that destroys scale invariant behavior. We estimated a ratio of slipping area-to-contact area, for the largest avalanche, and found it to be of order 1000 to 1 for the AFM experiments. Thus, these dramatic finite size effects explain the absence of scaling of avalanches in AFM data. On the other hand, for the MD simulations, we find this ratio to be 1.0 and for the UHV experiments it is 2.5. If the largest slip is comparable to the contact area, then all smaller slips in the experiment are smaller than the contact area, and power law scaling can emerge as predicted. We note that the MD simulations do not have multiple, simultaneous slip locations, but instead the whole interface slides at once. Importantly, there are layers beyond the interface that also slip, so in this case our model can be understood as describing the slipping of elastically coupled layers.
Importantly, we point out that the AFM data can still be described by our model, albeit in a parameter regime where the slips are large compared to the contact area (or system size). Similar effects can be achieved in the model, for example for large slip weakening in the system, and in a somewhat different way also for effectively soft loading springs. Either way this type of behavior is seen in model parameter regimes where the system is not close to a critical point and thus the avalanches are not power law distributed. Thus, these model predictions match the observations from the AFM experiments also.
Finally, new modeling work (arxiv:2204.02795) further supports the idea that friction force fluctuations should match our model with weakening, based on comparison to simulations of a rate and state model. We note importantly here that, though the slope of the size and duration CCDF in the mentioned work are steeper than the MFT prediction without weakening (instead being a closer match to the prediction of the model with weakening), our MFT + noise simulations suggest this is simply a consequence of the periodic machine noise. It will be interesting to see if the exponents resembling those of the weakened model will persist in experiments without machine noise.
In summary, the results demonstrated that friction behavior of lamellar solids, and possibly materials in general, can be accurately described by our MFT model, and that this framework can be used to understand the similarities and differences between macroscale and nanoscale friction measurements. The framework can also be used to transfer friction results between scales, predict future friction behavior, and diagnose and quantify potential changes in friction over time. As friction is linked to plastic deformation, the broad agreement with predictions from the MFT model suggests the possibility of linking friction force statistics with internal friction and wear rates as a future application.
Acknowledgements
TS and KD gratefully thank William McFaul for helping to understand oscillations and Spencer Rooke for helping with error analysis. FWD acknowledges support from the Center for Integrated Nanotechnologies, a Department of Energy office of Basic Energy Sciences user facility. The work was funded by the Laboratory Directed Research and Development program at Sandia National Laboratories, a multi-mission laboratory managed and operated by National Technology and Engineering Solutions of Sandia, LLC, a wholly owned subsidiary of Honeywell International, Inc., for the U.S. Department of Energy’s National Nuclear Security Administration under contract DE-NA0003525. Any subjective views or opinions that might be expressed in the paper do not necessarily represent the views of the U.S. Department of Energy or the United States Government.
Funding
The authors have not disclosed any funding.
A study on the modulation of alpha-synuclein fibrillation by Scutellaria pinnatifida extracts and its neuroprotective properties
Mahdyeh Sashourpour,Saber Zahri ,Tayebeh Radjabian,Viktoria Ruf,Francisco Pan-Montojo ,Dina Morshedi
Published: September 28, 2017 https://doi.org/10.1371/journal.pone.0184483
Abstract
Aggregation of alpha-synuclein (α-SN) is a key pathogenic event in Parkinson’s disease (PD) leading to dopaminergic degeneration. The identification of natural compounds inhibiting α-SN aggregation may have a major role in treating PD. Different Scutellaria species are known as valuable medicinal plants, primarily due to their high flavonoid levels. Scutellaria pinnatifida (S. pinnatifida) is endemic to Iran; however, the knowledge of its pharmaceutical properties is limited. Here we report that S. pinnatifida extracts have an anti-fibrillation effect on α-SN aggregation and neuroprotective properties on PC12 and primary dopaminergic neurons. Treatment during α-SN fibril formation with S. pinnatifida extracts showed that the extractions performed with dichloromethane (DCMEx) and n-butanol (BuOHEx) strongly inhibited α-SN fibrillation. TLC-based analysis revealed that S. pinnatifida contains a great amount of flavonoids with high antioxidant properties as shown using a radical scavenging assay. Further analysis using HPLC and Mass spectroscopy on the DCMEx revealed the presence of baicalein in this extract. We then selected the more efficient extracts based on cell viability and ROS scavenging on PC12 cells and tested their neuroprotective properties on primary dopaminergic neurons. Our results showed the extracts strongly protected against α-SN oligomers. Surprisingly, they also neutralized the severe toxicity of paraquat. Therefore, S. pinnatifida may be a potential valuable medicinal herb for further studies related to the treatment of PD.
Introduction
Parkinson’s disease (PD) is a chronic neurodegenerative disorder with severe medical and social impacts affecting more than 1% of people over the age of 65. If there is no access to accurate treatment, it is anticipated that the prevalence of this acute disease will be quickly expanded in the progressive ageing societies [1]. PD is mostly characterized by degeneration of dopaminergic neurons in the substantia nigra [2] leading to severe symptoms such as resting tremor, bradykinesia, muscular rigidity [3]. Strong evidence supports that aggregation of alpha-synuclein (α-SN) has a critical role in the pathogenesis of PD and other diseases, together known as synucleinopathies [4]. α-SN is a highly conserved protein, which is very abundant in the central nervous system (CNS) [5]. α-SN is a natively unfolded protein [6], changing its conformation into semi- helical structures by interaction with bio-membranes, especially negatively charged membranes. Under unknown conditions, α-SN tends to form amyloid fibrils with high ß-sheet contents [7]. Some aggregated species of α-SN formed along the fibrillation are very toxic and are able to intrude the functions of different organelles such as mitochondria, endoplasmic reticulum and plasma membrane [8–10]. Furthermore, it may increase the oxidative stress causing severe damages in dopaminergic cells [11,12]. It has been shown that some natural compounds like herbal flavonoids, including variable groups of polyphenols, are able to prevent aggregation and/or neurotoxicity of α-SN, and could thus potentially be useful to treat PD. Some well-known flavonoids such as baicalein, (-)-epigallocatechin-3-gallate (EGCG), scullcap flavones and wogonin were shown to influence diverse aspects of the neurodegenerative process, especially regarding α-SN aggregation. Most of these substances are strong inhibitors of α-SN oligomerization in both cell-free and cellular systems [13,14]. Some of them can even disaggregate and remodel preformed fibrils into monomers or nonpathogenic oligomers [15–18]. In this regard, it was recently shown that baicalein moderates some of the clinical symptoms induced by oral-rotenone in a PD mouse model and that this reduction is associated with a considerable reduction in the formation of α-SN oligomers [19]. The neuro-protective properties of EGCG have been confirmed in an MPTP induced mouse model of PD [20]. Furthermore, flavonoids are known to be radical-scavenging compounds that help to decrease oxidative stress [21]. The antioxidant activities of baicalein, scullcap flavones and wogonin have a close correlation with their neuroprotective effects [22,23]. Flavonoids also protect neuronal cells against the deleterious effects caused by inflammatory reactions [24,25]. It has been reported that these anti-inflammatory effects are due to their impact on the NF-κB pathway [26–28].
During the past decades, the use of herbal medicines as major natural factories of complex compounds has increased dramatically. In this regard, various species of the Scutellaria genus should be taken into consideration for pharmaceutical studies due to their remedial secondary metabolites, particularly flavonoids [22]. The genus of Scutellaria includes approximately 300 species. One of them, Scutellaria baicalensis is well known in Chinese traditional medicine and has been clinically used to treat allergies, hyper lipidemia, arteriosclerosis, and inflammatory diseases [29]. There is little information on the pharmaceutical properties of the Iranian species, Scutellaria pinnatifida (S. pinnatifida) [30–32]. It was determined that among 60 different Iranian herbs only 6 S. pinnatifida varieties have high anti-oxidant activity against linoleic acid peroxidation [31]. In another study, using the aerial parts of S. pinnatifida, it was shown that the methanolic extract (MeOHEx) had more antibacterial activity than the DCM extract (DCMEx), but DCMEx exhibited more antioxidant activity [32]. It was also indicated that its root CH2Cl2 extraction induced specifically apoptosis in some cancer cell lines [30]. However, its activity against α-SN fibrillation and its neurotoxicity or its protective effect against environmental toxins has never been investigated before. Therefore as a part of our ongoing research on the inhibition of α-SN amyloid fibrillation/ neurotoxicity, we screened the effect of different extracts from S. pinnatifida in these processes. In the current study, we find that S. pinnatifida inhibits amyloid fibrillation and protects against α-SN neurotoxicity. Furthermore, we also analyzed the antioxidant activity of the extracts and the neuroprotective effect against two well-known PD-related toxins, paraquat and rotenone, on primary dopaminergic neurons.
Materials and methods
Chemicals
Thioflavin-T (ThT), Congo red (CR), AlCl3·6H2O, acetic acid, 1, 1dipheny l-2-picrylhydrazyl radical (DPPH), paraquat, rotenone, baicalein were purchased from Sigma (USA). HPLC grade methanol, ethanol, n-hexane, dichloromethane, ethyl acetate, n-butanol, di-phenyl boric acid ethanol amine and polyethylene glycol were obtained from Merck (Germany). Other compounds were also purchased from Merck (Germany).
Expression and purification of α-SN
Recombinant human α-SN-containing pNIC28-Bsa4 plasmid was transformed into Escherichia coli BL21 (DE3) pLysS cells (Novagen, Madison, WI, USA). Expression was induced with IPTG and α-SN was extracted and purified according to Huang et al [33]. Briefly, the purification of α-SN was carried out in three steps, including osmotic shock, anion-exchange and size exclusion chromatography. Finally, the sample was purified using an Amicon Ultra Centrifugal Filter (10kDa). The concentration of the purified protein was determined using the Pierce BCA Protein Assay Kit and samples were freeze-dried and stored at -20°C in aliquots. The final purified α-SN was tested with native-PAGE and SDS-PAGE, and also with Western blotting using specific monoclonal antibody against α-SN (data not shown). Far-CD spectroscopy also indicated the random coil structure for the purified protein in its monomeric form (Fig 1N).
Fig 1. Effects of different extracts of S. pinnatifida on α-SN fibrillation.
(A) ThT fluorescence intensity; and (B) CR absorbance measurements of α-SN alone and in the presence of MeOHEx, HexEx, DCMEx, EtOAcEx, and BuOHEx. The spectrum of CR alone is also shown. (C) Kinetic analysis of DCMEx effect on the fibrillation of α-SN at different concentrations (1, 10 and 100 μg/mL) monitored by ThT fluorescence emission at 488nm. (D-I) Fluorescence microscopy images; Images include of protein aggregates untreated and treated with the extracts. By using Image J, analysis of the fluorescence particles’ density present in each image has been carried out and shown in the right bottom of the image. (J-M) AFM images of α-SN aggregates in the absence and the presence of the selected extracts after incubation for 24 h. (N) CD spectra of monomeric and fibril forms of α-SN in the absence and presence of the selected extracts of S. pinnatifida. Error bars = SD, n = 3, * represents P < 0.05, and *** represents P < 0.005. https://doi.org/10.1371/journal.pone.0184483.g001
Plant materials and extraction
The root of S. pinnatifida was collected in Jun 2014 from the Damash area. Damash is a village in Jirandeh Rural District, Amarlu District, Rudbar County, Gilan Province, Iran with geographic coordinates of 36.7566° N, 49.8100° E and is out of the protected areas at the north part of Iran. The plant was identified by Dr. Attar at the Herbarium of Tehran University (Tehran, Iran) where a voucher specimen (herbarium no: 45950-TUH) has been deposited. No permissions for collecting the plant were obtained because the plant was not in the list of endangered plants of Iran. The name of this plant is not mentioned in the IUCN protection list (http://www.iucnredlist.org/). Also in the book entitled “a preliminary survey of endemic, rare and endangered plant species of Iran", that introduced endangered plants of Iran, there are no mention of this plant. It is in LC category and is not endangered according to the herbarium book code IRAN. Furthermore, the plant grows in the wide extends of the North, North East and West of Iran. In order to prepare various extracts from S. pinnatifida, the root was carefully washed with water and dried under shade at room temperature. The dried plant root was powdered using an electric blender (Bosch MKM6003, Germany). About 10 g of the powdered material was extracted with a mixture of methanol and water with a 9:1 ratio (v/v) using a bath sonicator (Badelin SONOREX Digital 10P). Samples were sonicated 3 x 15 min. After filtrating with a Boehner funnel, the filtrated solution was centrifuged (3000 rpm, 5 min) to remove small suspended particles. The lyophilized (labogeen ScanCool, Denmark) methanolic extract (MeOHEx) was sub-extracted with n-hexane (HexEx), dichloromethane (DCMEx), ethyl acetate (EtOAcEx) and n-butanol (BuOHEx) serially, based on a two-phase solvent system. In this process, 0.3 g of lyophilized MeOHEx was distributed in 10 mL water. The water-distributed sample was sub-extracted with an equal volume of the immiscible solvents. Each extract was lyophilized again and re-suspended in a solvent of DMSO and buffer or DMSO and culture media with a ratio of 1 to 10 (v/v). In the next step 10μL of each re-suspended extract solution was added to 90 μL of the subjected samples in which the finally concentration of the extract was 100 μg/mL. The concentration of DMSO in the subjected samples was 1% (v/v). Effects of DMSO on the fibrillation/cytotoxicity of α-SN were also assessed.
Induction of α-SN fibrillation and treatment with the extracts
140 μM of recombinant α-SN protein was dissolved in 1 mL of TNE buffer (30 mM Tris-HCl, 1 mM EDTA and 0.1 mM NaNO3, pH 7.5) and then incubated at 37°C for 24 h with a fixed shaking speed (85 rpm) in a shaking water bath (Thermo Scientific HAAKE Shaking Water Bath (SWB25)) to allow fibril formation. To assess whether the different extracts of S. pinnatifida could inhibit α-SN aggregation, the same reaction was performed in the presence of the extracts in DMSO as the final solvent. In each treated sample 1 to 10 v/v of the re-suspended extract was added in which the final concentration ratio of the protein to extract was 20:1 w/w. As control some samples were treated with the same volume of DMSO.
Generation of α-SN oligomers.
Generation of α-SN oligomers for the experiments with dopaminergic neurons was done as follows. α-SN was fluorescently labeled with an amino reactive red fluorescent dye (Alexa Fluor-647) as described previously [34]. Fluorescently labeled α-SN and unlabeled α-SN were mixed at a ratio of 1:5. Hereupon, oligomer formation was induced at a concentration of 50 μM α-SN in the presence of 100 μM Al3+ under constant shaking (1400 rpm) at 37°C for 30 minutes and confirmed by single molecule fluorescence spectroscopy (S1 Fig). Oligomers were stored at -80°C. Oligomer formation was verified by single molecule fluorescence spectroscopy.
Assessment of the fibril formation
ThT assay. α-SN aggregation was monitored using ThT fluorescence by using a 500 μL tris (pH 7.4, 50 mM) solution containing 1.5 μM α-SN, and 20 μM ThT. The fluorescence intensity was measured at room temperature using a Varian Cary Eclipse fluorescence spectrophotometer (Mulgrave, Australia) and setting the excitation and emission wavelengths at 440 nm and 450–550 nm, respectively.
Congo red (CR) absorbance assay.
Formation of fibrillar aggregates was also assayed using a fresh CR solution. CR was dissolved at a final concentration of 1 mg/mL in a buffer containing 150 mM of NaCl and 5 mM of Na2PO4 (pH 7.4). A 10 μL of the incubated sample was added to 490 μL of the CR solution and incubated for 5 min. Absorbance spectra were measured from 400 to 600 nm by the PGT80+UV–Visible spectrometer (Leicestershire, England) [35]. In some cases, interaction of CR with some forms of the aggregates (especially fibrillar forms) resulted in red shifting of the position of the absorbance maxima. The way to quantify red shifting is through the spectral center of mass (υg) [36]. υg is defined based on Eq (1):
Eq (1)
Where Fi is the emission at a wavenumber, υi, and the sum is carried over all wavenumbers where Fi > 0.
Fluorescence microscopy analysis.
15 μL of the incubated protein were added to a 15 μL of ThT solution (with 15 μM of ThT). The mixture was incubated at room temperature for 5 min and after spreading onto a microscopic slide, it was studied by a fluorescence microscopy (Ceti Inverso TC100 microscope, Medline scientific, Oxon, UK). Image analysis was performed via Image-J 1.44 P. The area occupied by the fluorescent particles was compared between different samples by adjusting color threshold parameters in fixed numbers (Hue: 45–117, Saturation: 100–255, Brightness: 100–255).
Circular Dichroism (CD) spectropolarimetry.
Far-UV CD spectropolarimeter was used to analyze the secondary structure of α-SN. Using an AVIV 215 CD-spectropolarimeter, we analyzed structural changes induced in α-SN in the presence of the plant extracts. To conduct these experiments, 10 times diluted α-SN samples, treated with MeOHEx, DCMEx and BuOHEx were prepared and spectral properties of the incubated protein were monitored using a 0.1 cm diameter cell. CD spectra of TNE buffer with or without 1% resuspended extracts (in DMSO (was recorded and subtracted from the protein spectra and the CD signal given as ellipticity.
Atomic Force Microscopy (AFM) imaging.
The incubated α-SN in a fibril formation condition was diluted 20 times with deionized water, then a small aliquot (10 μL) was deposited on a freshly cleaved mica sheet. The treated mica sheet was allowed to be air- dried. AFM was performed at room temperature by a NanoScope IIId controller from Veeco Instruments Co. (Plainview, NY, USA) with a silicon probe (CP-CONT-PM, sphere without coating). Imaging was performed under the tapping modality.
Assessment of the antioxidant activity of the extracts
The antioxidant activity of the extracts was evaluated using 2, 2-Diphenyl-1- picrylhydrazhyl (DPPH) as previously described by Kim et al [37].
Briefly, a methanolic solution of DPPH (0.002% w/v) was prepared. 1 mL of DPPH was mixed with 1 mL of the crud extract or sub-extracts of S. pinnatifida. The absorbance was monitored at 517 nm after 30 min of incubation at room temperature and in the dark using a PGT80+UV–Visible spectrometer (Leicestershire, England). The antioxidant activity (AA) was calculated using Eq (2):
Eq (2)
where AO is the absorbance of the blank (1 mL of 0.002% (w/v) DPPH + equal volume of methanol) and AS is the absorbance of the samples.
Determination of total flavonoids content
The total flavonoids content of S. pinnatifida extracts were determined using the AlCl3 method [38]. This method is based on the formation of a flavonoid-aluminum complex. 100 μL of the extract was added to an equal volume of a 2% AlCl3·6H2O solution (2 g AlCl3·6H2O per 100 mL methanol). After shaking vigorously, the sample was incubated at room temperature for 10 min. Then the absorbance was measured at 430 nm with a UV-Vis spectrophotometer using a PGT80+UV–Visible spectrometer (Leicestershire, England). Quantitative determination of total flavonoids was done based on the standard curve of baicalein. The contents of the flavonoid compounds were expressed as milligram baicalein equivalents to gram of dry weight.
TLC was also performed in order to detect total flavonoid compounds in the plant extracts [39]. 30 μL of the extracts were spotted on the silica gel G60 F254-pre-coated TLC plates (10× 20 cm). The plates were then placed in a chromatography chamber and saturated with a mobile phase solvent (n-butanol–acetic acid- water, 10:1:5, v/ v/ v) at room temperature.
The developed plate was air-dried and then sprayed with a 1% solution of the flavonoid-specific reagent, diphenylboric acid ethanolamine in methanol. After drying with 5% polyethylene glycol, the presence of flavonoids was visualized under UV light at 366 nm in a camera equipped chamber [40].
HPLC and Mass spectroscopy (MS) analysis.
To assess of the presentation of baicalein in DCMEx, HPLC and Mass spectroscopy (MS) analysis were carried out using pure baicalein (Sigma-Aldrich, 11712) as a standard. The HPLC apparatus was a Smartline model (Kenuer, Germany) with a quaternary pump and a reversed phase column C18 Eurospher-100 (5 μm particle, 125 mm × 4 mm) coupled with a UV-VIS detector (D-14163 model). Data were processed by Software ChromGate (version 3.1). Mobile phases consisted of water with 0.2% glacial acetic acid (solvent A) and acetonitrile (solvent B) in gradient mode. Initial condition was A–B (90:10, v/v), linearly changed to A–B (35:65, v/v) after 20 min. and holded at the same ratio for 10 min. Then the percentage of mobile-phase A increased to 90% after 35 min and reached 0% after 45 min. The flow rate was kept at 1 mL/min. The injection volume was 20 μL, and peaks were monitored at 277 nm. Samples were filtered through a hydrophilic PTFE membrane filter with a 0.45 μm pore size before injection. Peak of baicalein was identified by congruent retention time.
MS analysis of baicalein was conducted on an Agilent 6410 Triple Quadruple mass spectrometer, coupled to an Agilent 1200 series liquid chromatography equipped with an auto sampler (1200 series) and a diode array detector (1200 series). Experiments were carried out with an ESI source in a positive ion mode. The fragmentor was set at 80 and the collision energy on 35v. The solvent program was set as a flow rate of 0.5 mL/min with 90% Methanol and 10% water contain 0.1% formic acid. The source was operated using 300°C drying gas (N2) at 6 L/min, nebulizing gas adjusted at 10 psi and capillary voltage adjusted at 4000V. Multiple reaction monitoring (MRM) detection was employed using nitrogen as the collision gas, with a dwell time of 150 ms for each transition; the transition monitored for baicalein was m/z 271→123.
Culture of PC12 cells and primary mesencephalic dopaminergic neurons PC12 cells were cultured in Dulbecco’s Modified Eagle’s Medium (high glucose) supplemented with 10% fetal bovine serum, 100 units/mL penicillin (Pen), and 100 μg/mL streptomycin (Strep). The cells were incubated in a humidified incubator at 37°C under an atmosphere containing 5% CO2.
All animal procedures were performed according to the German Law for Animal Experiments (Tierversuchsgesetzt) and were approved by the Regierung von Oberbayern (The government from Bayern, Germany). Primary mesencephalic neuronal cell cultures were prepared as previously described [41]. Briefly, E14.5 embryos were obtained from C57JBL6 pregnant mice after cervical dislocation. Brain mesencephali were dissected under the microscope and digested with Trypsin-EDTA 0.12% (Life Technologies, USA) for 7 min. The trypsin reaction was then stopped by adding basic medium (BM), containing Neurobasal A medium (Gibco), 1 mg/mL Pen/Strep, 10% FCS and 200 mM L-Glutamine, and cells were mechanically dissociated using a fire-polished Pasteur pipette. Medium was fully replaced after 5 min, centrifugation at 1200 rpm, aspiring the supernatant and adding 8 mL of fresh BM to the pellet. Concentration of cells in the medium was estimated using a Neubauer chamber and a 100 μL of medium containing 106 cells /mL plated per well in a 96-well plate (Greiner Sensoplate, Germany). Then a 20 μL of medium was removed from the well and 24 h later 1/3 of the media was replaced with fresh BM. On DIV3 half of the medium was replaced with B27 one, containing Neurobasal A medium, 1mg/mL Pen/Strep, 200 mM L-Glutamine and B-27 supplement; and on DIV5 all medium was replaced by B27 medium. Treatment was administered on DIV7 and DIV 9 cell and cells were fixed on DIV10.
To determine the optimal concentration of the plant extracts to be used on the dopaminergic neurons, we tested different extract concentrations, including 1, 10 and 100μg/mL, on the cultured neurons.
Cell toxicity assessment on PC12 cells and dopaminergic neurons.
The effect of the plant extracts on the α-SN-induced cell death on PC12 cells was estimated by measuring MTT reduction. This assay is based on the conversion of the yellow tetrazolium salt (MTT) to the purple formazan by mitochondrial dehydrogenase of live cells [42]. Briefly, PC12 cells (3×10⁴ cells/200μL/well) were added to the wells of 96-well plates. To study the cytotoxic effects of α-SN in the presence and absence of the extracts, a 10% (v/v) dilution of fibrillated α-SN, incubated for 24 hours in the presence or absence of MeOHEx, DCMEx and BuOHEx extracts, or just the extracts as controls were added to PC12 cell cultures for 24 h. After treatment, culture medium was replaced with new medium and MTT solution was added to the cells (with a final concentration of 0.5 mg/mL). Plates were incubated at 37°C for 4 h. The solution was then removed, and the precipitated formazan crystals were solubilized in a 100 μL DMSO. Absorbance was measured at 570 nm using a plate reader (Expert 96, AsysHitch, Ec Austria).
To further characterize cytotoxicity of α-SN and the protective effect of the extracts, the proportion of apoptotic and necrotic PC12 cells, Annexin V and Propidium iodide (PI) positive respectively, was determined by flow cytometry. For this, PC12 cells were seeded on a 6-well microtiter plate (5x10⁵cells/well) and treatment as described above was performed on DIV1. At the end of the incubation period, PC12 cells were harvested, washed with cold PBS and resuspended in 500 μL of the binding buffer. The cells were double stained with the fluorescein isothiocyanate (FITC)-conjugated Annexin and PI, according to the instructions of the kit (The FITC Annexin V/PI Dead Cell Apoptosis Kit, Invitrogen), kept at a dark place for 15 min just before analysis. Samples were then loaded on the BD FACSCalibur flow cytometer (Becton Dickinson, Franklin, Lakes, NJ, USA) to analyze the proportion of different kinds of dead cells. Flowing software v.2.5 was then used to discriminate early or late apoptosis.
The protective effect of the DCMEx and BuOHEx/EtOAcEx (in a ratio of 1:1 (w /w)) against α-SN oligomers-, paraquat- and rotenone-induced cell death on dopaminergic neurons was assessed through manual counting of immunostained TH+ neurons after treatment. Briefly, neurons were prepared and plated on 96 well plates as described above. On DIV7, the neurons were treated with 10 μM α-SN, 10 nM rotenone and 12.5 μM paraquat alone or together with 1μg/mL of DCMEx or 100μg/mL BuOHEx/EtOAcEx for three days. After this time, cells were life stained using DCFH-DA to perform the intracellular Reactive Oxygen Species (ROS) assay (see section 2.12) or were fixed using 4% paraformaldehyde for immunocytology (see section 2.11).
Dopaminergic TH+ neurons were observed using an inverted fluorescence microscope (Olympus) under a 20x objective. The diameter of every well was scanned in two perpendicular directions (i.e. top to bottom and left to right) and total TH+ neurons were counted for every well.
Immunocytology of mesencephalic cell cultures.
4% PFA fixed neuronal cell cultures were washed 3x10 min in phosphate buffered saline (PBS), blocked using a blocking solution (BS) (0,2% Triton X-100 in PBS and 5% donkey serum (DS)) for 1 h at room temperature, and incubated with a mouse anti-TH (Clone LNC1,1:500, Millipore, MAB318) primary antibody in BS overnight at 4°C. On the next-day cells were washed 4x10 min with PBS, incubated with a donkey Alexa® 555 anti-mouse secondary antibodies for 1 h at room temperature and washed 4x10 min with PBS.
Intracellular ROS assay.
The level of intracellular ROS in PC12 and primary mesencephalic neuronal cultures was measured using a fluorogenic and plasma membrane permeant dye, DCFH-DA (2, 7-dichlorofluorescein diacetate). After diffusing into the cell, DCFH-DA is deacetylated enzymatically and later oxidized by ROS into a fluorophore compound, 2’, 7’–dichlorofluorescein. Briefly, PC12 cells were seeded into 96-well plates (3.0x10⁴ cells /well/200μL) and cultured for 24 h. On the next day, cells were treated with 20μL of 7 h-aged fibrillated α-SN alone or in combination with the extracts. Mesencephalic neurons on the other side were treated as previously described. In both cases, after treatment, cells were washed one (mesencephalic neurons) or two (PC12 cells) times with FBS free DMEM and incubated with 20 μM DCFH-DA at 37°C for 30 min. Extra DCFH-DA was removed by washing the wells with phosphate-buffered saline (PBS, 0.01 M, pH 7.4). Fluorescence intensity was measured using 480 nm excitation and 520 nm emission with a Varian Cary Eclipse fluorescent spectrophotometer (Mulgrave, Australia) for PC12 cells and a Fluostar OPTIMA (BMG Labtech, Germany) for mesencephalic neurons.
Results
Extracts obtained from ground root of S. pinnatifida have strong inhibitory effects against α-SN fibrillation To analyze the effects of S. pinnatifida root extracts on α-SN fibrillation, its fine- ground root was dissolved in a 90% methanol solvent and sonicated. Subsequently, the lyophilized methanolic extract (MeOHEx) was sub-extracted with n-hexane (HexEx), dichloromethane (DCMEx), ethyl acetate (EtOAcEx) and n-butanol (BuOHEx) serially, based on a two-phase solvent system. The purified recombinant α-SN protein was incubated under fibrillating conditions in the absence or presence of the different extracts of S. pinnatifida root. To examine the effects of the S. pinnatifida extracts, we used ThT to assess fibril formation. In the presence of some extracts, especially DCMEx and BuOHEx the fibril formation of α-SN after 24h significantly decreased (see Fig 1A).
The result of CR absorbance assay is shown in Fig 1B. When amyloid fibrils interact with CR, they induce a characteristic increase in absorption and a red shift in the absorption maximum. The analysis data of the spectral center of mass (Eq (1)) has been presented in S1 Table.
In the presence of incubated α-SN, the CR’s center of mass shifts from 497.7 to 514.2 nm. Treatment of α-SN with HexEx had almost no effect on the shifting. However, in the present of the other extracts the CR’s center of mass showed a 50% reduction in the red-shift. Nevertheless, we observed some changes in the pattern of CR absorbance when CR was added to the pre-treated α-SN. In these cases other aggregated forms of the protein may interact with CR and change the absorbance spectrum of CR. It is established that CR can interact with other structures apart from amyloids [43].
To analyze in more detail the inhibitory activity of DCMEx on α-SN fibrillation, the kinetic of α-SN fibrillation was investigated in the presence of 1, 10 and 100 μg/mL of DCMEx. As shown in Fig 1C, the activity of DCMEx against fibrillation is dose dependent and at the low concentration, 1μg/mL, DCMEx did not show any considerable inhibitory activity. In spite of this result, we will show that the presence of 0.1 μg /mL DCMEx in the media has a protective activity on the treated cell against the toxic oligomeric forms of α-SN.
As the fluorescence emission of ThT is significantly increased when ThT interacts with the fibrillar forms of α-SN, it was used in fluorescence imaging study [44]. As shown in Fig 1D–1I, we observed differences in the density of fluorescent particles in the different treatments. The density of the fluorescent particles in each sample was calculated and the data was shown in each image in a box.
We then investigated whether the treatment with the root extracts modulated the morphology of α-SN aggregates using AFM. As shown in Fig 1J–1M, typical fibrils were abundantly found in the untreated sample (J) but in the samples treated with the MeOHEx (K), DCMEx (L), or BuOHEx (M) just non-fibrillar particles were formed.
CD analyses were carried out to qualitatively assess the structural changes induced on α-SN protein by the presence of the S. pinnatifida extracts. Fig 1N illustrates the far-UV CD spectra α-SN after 24 h of incubation in the presence and absence of the selected extracts compared to the monomeric form of the protein. After incubation, α-SN had a strong negative peak approximately at 218 nm, indicating beta sheet structures. The CD spectrum analysis of the monomeric form of α-SN showed a random coil structure with a sharp negative peak around 200 nm. The samples treated with the extracts did not exhibit visible peaks around 200 or 218 nm, suggesting that, although the native monomeric form was not stabilized, protein aggregates’ species did not have high contents of beta sheet structures.
S. pinnatifida extracts have radical scavenging activity and high levels of flavonoids It is believed that oxidative stress plays a major role in pathogenesis of neurodegenerative diseases, especially PD [45]. To monitor the antioxidant activity of the extracts, DPPH dye assay was carried out. As indicated in Table 1, most extracts except HexEx exhibit a strong antioxidant activity with able to neutralize DPPH radicals.
We assumed that this antioxidant activity was due to the flavonoid content of the extracts. We therefore measured the total flavonoid content of the crude extract and the sub-extracts using AlCl3 (Table 1).
The results of the AlCl3 assay showed that different levels of flavonoids were present in the analyzed extracts. MeOHEx, DCMEx, and BuOHEx presented high level of flavonoids. In contrast HexEx contained considerably lower level of flavonoids. By using a specific dye for flavonoids in the TLC (diphenylboric acid ethanolamine) we also found with a different method that MeOHEx, DCMEx, and BuOHEx contain flavonoids. Interestingly, when compared to a standard of Baicalein (a well-known flavonoid) that was also loaded on the TLC, the DCMEx showed a strong wide band at the same height like the baicalein band. A similar result was obtained through HPLC analysis of the DCMEx, showing a peak with a retention time of 13 min., similar to the one observed when analyzing the baicalein standard with the chromatogram (S2 Fig).
In order to determine more detail of the extract, we also performed a MS analysis [46], which confirmed the presence of baicalein in the sample. The MS analysis was performed on the positive ion mode. The electrospray ionization of baicalein produced protonated molecular ions at m/z 271.4. Based on the major product ions in the product ion mass spectrum, MRM transition was selected m/z 271.4→123.1 for baicalein (S3 Fig).
Protective effects of S. pinnatifida extracts on PC12 cells against the cytotoxicity of α-SN To evaluate the toxicity of α-SN on PC12 cells and the protective effect of S. pinnatifida extracts, we used the MTT assay on PC12 cells after incubation in the presence of α-SN fibrillated alone or fibrillated in the presence of MeOHEx, DCMEx, or BuOHEx. First we tested the toxicity of the extracts alone. At the concentrations in which DCMEx had the highest significant effect on α-SN aggregation (100 μg/mL, final concentration in PC12 media of 10 μg/mL) it also showed high neurotoxicity (S4A Fig). However, we observed no toxicity when 1 μg/mL of the extract was present in the media, which corresponded to adding 10 μg/mL to α-SN during fibrillation.
No remarkable cytotoxic activity was observed when the cells were treated with 100 μg/mL of MeOHEx or BuOHEx (S4A Fig). Our results show that short-term incubated α-SN (7 h incubated in fibrillating conditions) had a significant lethal effect on PC12 cells (48% of cell death) in comparison with the untreated cultured cells. Adding the protein pre-incubated with 100 μg/mL BuOHEx (10 μg/mL final concentration in the media) and with 10 μg/mL DCMEx (1 μg/mL final concentration in the media) increased the viability of PC12 cells when compared to untreated α-SN (Fig 2A).
Fig 2. Assessment the cytotoxicity of α-SN on PC12 cells in the presence of the extracts.
(A) Cell viability measuring by MTT assay. PC12 cells were treated with 7 h-aged incubated α-SN in the absence and presence of different extracts. (B-D) Analysis of the cell death type using Annexin V/PI method: Living cell (Annexin V−/PI−) populations were located in the lower-left quadrant, the apoptotic cells were in the lower-right quadrant, late apoptotic (Annexin V+/PI+) populations were located in the upper-right quadrant, and necrotic cell (Annexin V−/PI+) populations were presented in the upper-left quadrant.(E) ROS production assay. Fluorescence intensity was measured at 480nm excitation and 520nm emission. The significance was set at P<0.05.* The data are the means of three independent experiments ± SEM. https://doi.org/10.1371/journal.pone.0184483.g002
In contrast, the addition of α-SN pretreated with 100 μg/mL of DCMEx (10 μg/mL final concentration in the media) lead to a significant increase in cytotoxicity when compared to treatment with α-SN alone, probably due to the toxicity of the extract in this concentration.
Annexin V/PI staining showed an increase in the number of apoptotic cells in the presence of 7h-aged amyloid fibrils (Fig 2C). Pretreatment and the presence of BuOHEx with α-SN also reduced the apoptotic rate (Fig 2D).
We also analyzed the antioxidant properties of S. pinnatifida extracts at the cellular level. Staining with DCFH-DA showed that treatment with 7h-aged α-SN increased the intracellular ROS production (63%). However, pretreatment of α-SN with EtOAcEx or BuOHEx during the incubation period and their presence in the cell culture significantly reduced ROS production (Fig 2E).
S. pinnatifida extracts protect dopaminergic neurons against α-SN oligomers and paraquat toxicity
We wanted to analyze the neuroprotective effect of DCMEx on dopaminergic mesencephalic murine neurons. Based on the DPPH results, we also treated the cells with a mixture of EtOAc and BuOH to combine the antioxidant and neuro-protective activity of both compounds. In order to mimic the pathophysiological process and investigate the intracellular neuroprotective properties of the extracts, we did not induce α-SN oligomer formation in the presence of the extracts, but these were only added to the medium together with α-SN treatment. First, we determined the optimal treatment concentration of both extracts. For this, we treated dopaminergic neurons with different concentrations of the extracts (1, 10, 100, 1000 μg/mL) and counted the amount of TH+ neurons after the treatment. Whereas for DCMEx concentrations higher than 1 μM were toxic to TH+ neurons, in the case of BuOHEx/EtOAcEx concentrations up to 100 μM showed no toxic effects (Fig 3A). We then analyzed the neuroprotective effect of both extracts by treating dopaminergic neurons with α-SN monomers, an α-SN oligomers-monomer mixture, rotenone and paraquat alone or in combination with 100 μg/mL BuOHEx/EtOAcEx (in a ratio of 1/1(w/w) or 1 μg/mL DCMEx. Treatment with 12, 5 μM of paraquat, 10 nM of rotenone or 10 μM of the α-SN oligomer-monomer mixture induced morphological alterations and the loss of TH+ neurons (Fig 4A–4P). Our results show that BuOHEx/EtOAcEx and also DCMEx protected TH+ neurons against paraquat- and α-SN oligomers induced toxicity (Fig 3B). However, no significant protection against rotenone was observed (Fig 3B).
Fig 3. S. pinnatifida extracts are neuroprotective against paraquat and oligomeric α-SN toxicity on dopaminergic neurons in primary mesencephalic cell cultures.
(A) Box-Plot Graphic showing the effect of 1, 10, 100 and 1000 μg/ml to determine the non-toxic concentration of DCMEx (DCM) and BuOHEx / EtOAcEx (BE) on dopaminergic TH+ neurons. (B) Box Plot Graphic showing the toxic effect of paraquat, rotenone and an α-SN oligomer/monomer mixture on TH+ neurons and the protective effect of 100 μg/mL BuOHEx / EtOAcEx (BE) or 1 μg/mL DCMEx (DCM) against this aggression. (C) Box-Plot Graphic showing the effect of α-SN oligomers on ROS production in mesencephalic cells and its reduction in the presence of DCMEx, and BuOHEx / EtOAcEx. Whiskers represent Max and Min values. * represents P < 0.05, ** represents P < 0.01, n.s. non-significant. https://doi.org/10.1371/journal.pone.0184483.g003
Fig 4. Fluorescence microscopy images of mesencephalic neurons.
(A-P). Microscope images from immunostained mesencephalic neuronal cultures. Scale bar 20 μm. Cells were fixed and stained against tyrosine hydroxylase (TH, green). Nuclei were then stained with DRAQ5 (blue). TH+ neurons treated with DMSO (B), DCMEx (C) and BuOHEx / EtOAcEx (D) showed no morphological alterations when compared to control (A). Treatment with Paraquat (E), Rotenone (F) and an α-SN-oligomer-monomer mixture (G) induced morphological alterations in the form of neurite loss (arrows in E-G) and the previously described neuronal loss. This effect was not so prominent when α-SN-monomers were used for treatment. DCMEx and BuOHEx/EtOAcEx co-treatment was protective against paraquat (I and M) and α-SN-oligomer (K and O) toxicity. However, it was not able to rescue rotenone toxicity or its morphological phenotype (J and N). https://doi.org/10.1371/journal.pone.0184483.g004
Finally, we also analyzed the anti-oxidant effect of both extracts on mesencephalic neurons. Our results show 100 μg/mL BuOHEx/EtOAcEx or 1 μg/mL DCMEx alone reduced ROS production. This effect could also be observed in the presence of α-SN oligomers (Fig 3C).
Discussion
This study examined the neuroprotective effects of S. pinnatifida extracts through their effects on α-SN fibril formation and cytotoxicity. Since the medicinal properties of various species of the Scutellaria genus have been verified in many studies [22,47,48] and the presence of two flavones, skullcap flavone II and wogonin, have been detected in the root of S. pinnatifida [49], we hypothesized that fibrillation and also cytotoxicity of α-SN could be modulated by S. pinnatifida extracts.
In order to achieve efficient extraction compounds from the dried root of S. pinnatifida, in the first step a methanolic extraction and in the second step two-phase solvent extraction system were employed. To achieve extracts with high contents of α-SN fibrillation/cytotoxicity inhibitors along with ROS scavenging activity.
In this study, assessment of α-SN fibril formation using different methods showed that among different extracts, DCMEx and BuOHEx possessed the highest inhibitory activity against α-SN fibrillation. The CD and AFM data indicated that co-treatment of α-SN with the extracts reduced the content of fibrillar beta sheet structures. Thus, suggesting that in the presence of the extracts, the pathway for formation of high ordered fibrils with β-sheet structure was inhibited and small non-fibrillar particles were produced. Different studies on the mechanism of α-SN aggregation have shown that a common conformation exists between the toxic oligomers of α-synuclein and other aggregate-forming proteins and that this involves a high amount of β-sheet secondary structure that increases the protein-cellular membrane interactions leading to cytotoxicity [50,51]. In previous studies, it has been shown that flavonoids such as baicalein usually produce some oligomeric species that are not toxic (13).
Therefore, we measured the flavonoid content of the extracts. Our analysis showed that among all extracts containing different degrees of flavonoids, DCMEx contained the higher amount of flavonoids (2/244 mg baicalein/g of dry material). In comparison with Hex and EtOAc based on solvent polarity, DCM, belongs to the partially polar solvent groups, with 9.1 dielectric constant and the potential to extract semi polar compounds such as flavonoids [52]. Furthermore, using TLC, HPLC and MS analysis we confirmed that there is a small amount of baicalein in the extracts, especially in DCMEx; however more experiments need to be done in order to confirm the data (e.g. NMR or IR analysis). Many flavonoids including baicalein and epigallocatechin gallate are well-known multifunctional neuroprotective compounds against misfolded-protein induced toxicity, especially α-SN [13,14]. It has also been proved that flavonoids are strong antioxidant components [23].
We observed a high correlation between the flavonoid content and the anti-fibrillation properties of the extracts. By comparing the results collected from fibril formation assessment with those obtained from the analysis of the flavonoids content, it seems that DCMEx, the extract with the highest amount of flavonoid, is also the extract with the highest anti-fibrillation effects. In contrast HexEx has the lowest flavonoid content and the least inhibitory effect on α-SN fibril formation. These findings suggest that the anti-fibrillation activity of DCMEx may be attributed mainly to its flavonoids compounds, in accordance with previous studies [16,53,54].
A critical event in PD is oxidative stress, which leads to the overproduction of ROS and is a common pathogenic mechanism in neurodegeneration [55]. ROS has a deleterious impact on vital cellular components, which cause cellular impairment and apoptosis [56]. Based on the known antioxidant properties of flavonoids, we tested the antioxidant activity of S. pinnatifida extracts using the DPPH assay. Our results show that MeOHEx and also its related sub-extracts have a high free radical scavenging activity with a strong correlation between the flavonoid content and the diminution of ROS production induced by α-SN. The results further showed that EtOAcEx and DCMEx were the most active extracts in scavenging DPPH radicals. It is reasonable to expect that higher level of flavonoids content leads to higher antioxidant activity [57,58].
In a next step we tested the effect of inhibiting α-SN-aggregation with the extracts on their cellular toxicity by comparing the effect of α-SN incubated alone or in the presence of the extracts on PC12 cells. Our results show that incubating α-SN with BuOHEx had a significant protective effect on cell toxicity when compared to the effect of 7h-aged α-SN alone, that lead to cell death in concordance with previous studies [59]. It seems that BuOHEx has compounds with the ability to prevent cytotoxicity of the aggregated α-SN in the primary stages of the fibrillation process. On the other hand, co-treatment with α-SN and 100 μg/mL DCMEx and its presence in the media lead to death of PC12 cells, suggesting that, at this concentration this extract is toxic for PC12 cells. This toxicity seems to be concentration dependent, and 1 μg/mL of DCMEx was not toxic for PC12 cells. Interestingly, we did co-treatment dopaminergic neurons with toxic oligomeric form of α-SN and 1 μg/mL DCMEx. At this concentration DCMEx did not inhibit the fibrillation process of α-SN properly, suggesting that mechanism of its protective against toxicity of α-SN is different. In this regards, further studies need to be done supplementary fractionation of the DCMEx to find a fraction with high anti-fibrillation effects but without any considerable neurotoxicity.
Recent studies have shown that extracellular α-SN aggregates can be transported to neurons and are mostly responsible for propagation of α-SN pathology[10]. We assumed that if the neurons contaminate with extracellular α-SN similar to the pathophysiological situation of PD, the extracts can help neurons against neurotoxicity of α-SN. We used a mixture of α-SN containing α-SN aggregated in the absence of the extracts to treat primary mesencephalic neuronal cultures containing dopaminergic neurons. In this experimental setup, we show that α-SN oligomers increase ROS production and lead to death of dopaminergic neurons. Adding BuOHEx/EtOAcEx (in a ratio of 1 to 1(v/v)) or DCMEx to the media reduced α-SN-oligomers cytotoxicity and ROS production. Thus suggesting that the extracts were able to penetrate neurons and exert their effect intracellularly. Moreover, in order to analyze the anti-oxidant properties of the extracts alone, we treated dopaminergic neurons with the pesticides paraquat and rotenone. Paraquat induces NADPH depletion and ROS production in the cell and rotenone is an inhibitor of the mitochondrial Complex I. Interestingly, our results show that both BuOHEx/EtOAcEx and DCMEx were able to reduce the toxicity of paraquat but not rotenone, suggesting a protective effect against ROS production but not against mitochondrial function impairment. Overall our results suggest that the neuroprotective effect of DCMEx and BuOHEx/EtOAcEx is due to a double effect inhibiting α-SN-aggregation and protecting against ROS. Additionally, two important flavonoids, wogonin and skullcap flavone II, which have been identified in the roots of S. pinnatifida [60,61] exhibit significant anti-inflammatory effects [26,62]. The anti-inflammatory activity of wogonin is connected with its ability to inhibit NF-κB pathway [26–28]. Evidence shows that scullcap flavones exert potent anti-inflammatory effects by preventing the expression of monocyte chemotactic protein-1, a main factor for the early inflammatory responses [63,64]. We speculate that this effect may play an additional role in the neuroprotective effect of the extracts, but this hypothesis needs to be further evaluated.
There is no prior study on the antioxidant properties of S. pinnatifida. High level of the flavonoids in the extracts supports the importance of this plant as an excellent herbal source of antioxidants and amyloid inhibitors. It seems obvious that the constituents present in the extracts, such as flavonoids and especially baicalein, may have important roles for this activity. However, further research needs to be done in order to explore the chemical constituents present in the extracts, which are responsible for the anti-fibrillation activity.